
Barbeque Grill Market Size and Share
Market Overview
| Study Period | 2020 - 2031 |
|---|---|
| Market Size (2026) | USD 6.36 Billion |
| Market Size (2031) | USD 8.14 Billion |
| Growth Rate (2026 - 2031) | 5.06 % |
| Fastest Growing Market | Asia Pacific |
| Largest Market | North America |
| Market Concentration | Medium |
Major Players *Disclaimer: Major Players sorted in no particular order Image © Mordor Intelligence. Reuse requires attribution under CC BY 4.0. | |
Barbeque Grill Market Analysis by Mordor Intelligence
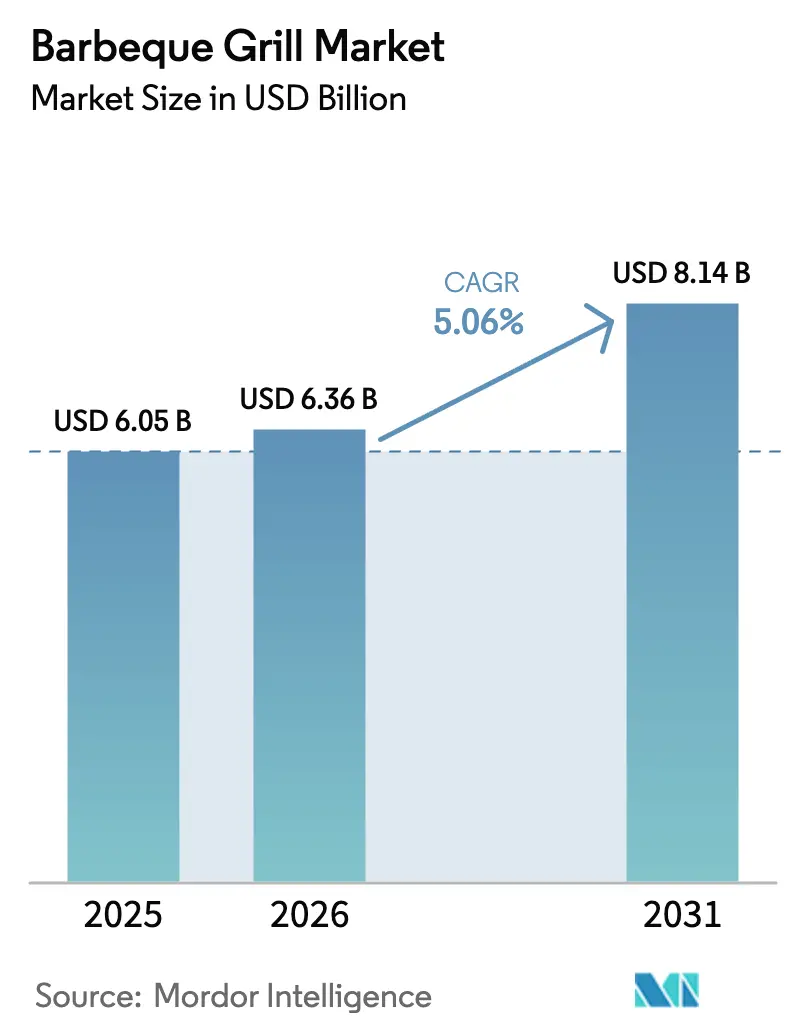
The barbeque grill market size was valued at USD 6.05 billion in 2025 and estimated to grow from USD 6.36 billion in 2026 to reach USD 8.14 billion by 2031, at a CAGR of 5.06% during the forecast period (2026-2031). Steady gains stem from the sector’s integration into a wider outdoor recreation economy, which contributed USD 639.5 billion GDP in 2023[1]. Consumer enthusiasm for home-centered leisure, coupled with rising disposable incomes in emerging markets, sustains consistent demand for gas and pellet units even as raw-material volatility challenges producer margins. Industry consolidation accelerates after the Weber–Blackstone tie-up, creating a global heavyweight with deep R&D resources and an expansive distribution footprint. In parallel, smart-enabled grills move rapidly from premium novelty to mass-market expectation as IoT connectivity improves precision, convenience, and brand differentiation.
Key Report Takeaways
- Gas grills led with 47.88% of barbeque grill market share in 2025, whereas pellet grills are advancing at a 6.54% CAGR through 2031.
- Freestanding formats captured 58.05% of the barbeque grill market in 2025; portable models record the fastest 6.06% CAGR to 2031.
- Conventional technology held an 84.55% share of the barbeque grill market in 2025, yet smart grills are growing at 6.63% CAGR.
- The residential end user segment accounted for 67.92% of barbeque grill market size in 2025, while commercial installations expand at 5.61% CAGR.
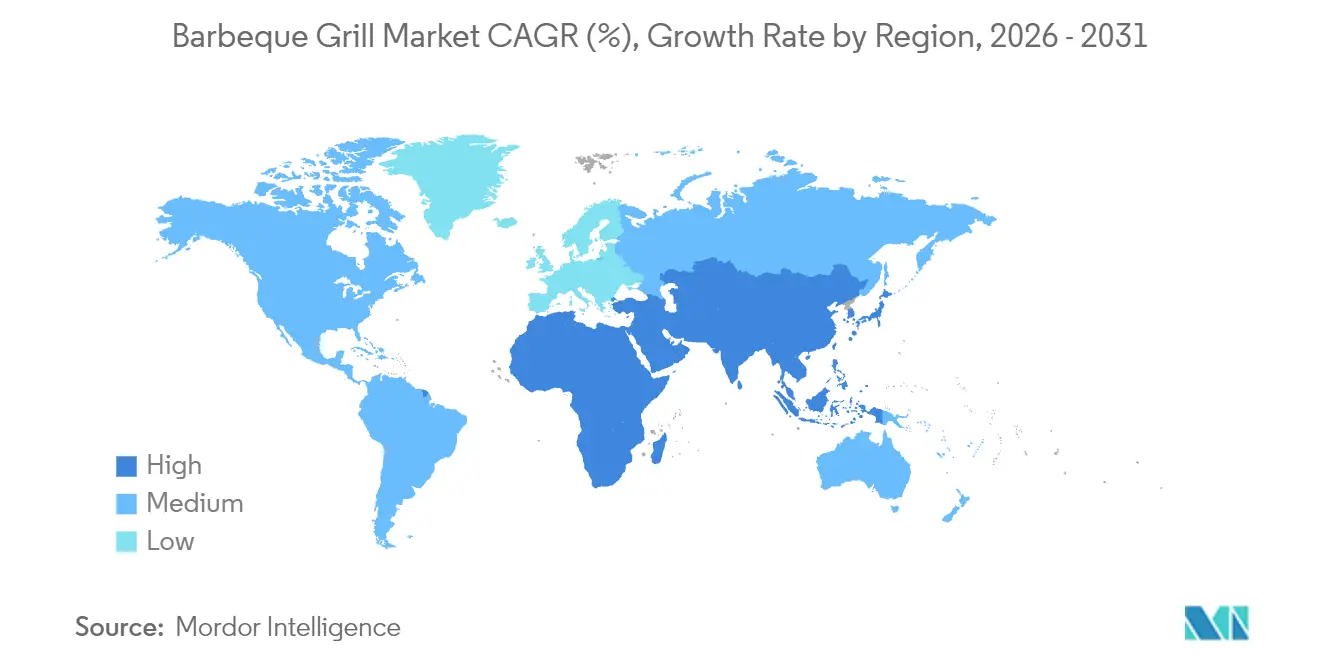
- North America commanded 28.84% of barbeque grill market size in 2025, whereas Asia-Pacific is forecast to post the highest 6.88% CAGR.
Note: Market size and forecast figures in this report are generated using Mordor Intelligence’s proprietary estimation framework, updated with the latest available data and insights as of 2026.
Market Trends and Insights
Drivers Impact Analysis of Barbeque Grill Market*
| Driver | (~) % Impact on CAGR Forecast | Geographic Relevance | Impact Timeline |
|---|---|---|---|
| Rising popularity of outdoor cooking in developed economies | +1.2% | North America & Europe | Medium term (2-4 years) |
| Increasing availability of multifunctional smart grills | +0.9% | Global, with early adoption in North America | Short term (≤ 2 years) |
| Growing disposable income & urbanization in emerging markets | +1.5% | Asia-Pacific core, spill-over to MEA | Long term (≥ 4 years) |
| Surge in tail-gating culture around e-sports tournaments | +0.3% | North America & Europe | Medium term (2-4 years) |
| Carbon-neutral propane blends spurring gas-grill demand | +0.4% | North America, California leading | Long term (≥ 4 years) |
| Rise of outdoor entertainment spaces in post-pandemic home renovations | +0.8% | Global, concentrated in suburban markets | Short term (≤ 2 years) |
| Source: Mordor Intelligence | |||
Rising popularity of outdoor cooking in developed economies
COVID-19 shifted leisure patterns toward outdoor pursuits, drawing 7.1 million additional Americans into recreation in 2020 and fueling an 18.9% jump in the broader outdoor economy by 2021[2]. Consumers now view grills as core components of backyard upgrades, often specifying commercial-grade units and multi-zone cook surfaces in new-build plans[3]. Flavor experimentation spans Asian, Italian, and Mexican profiles, encouraging purchases of specialty accessories such as woks and planchas. Premium outdoor kitchens leverage stainless steel, granite, and modular cabinetry to deliver year-round functionality even in colder climates. The barbeque grill market thus benefits from a durable lifestyle shift rather than a transitory pandemic spike.
Increasing availability of multifunctional smart grills
Traeger’s WiFIRE platform allows remote temperature control across 2.7 million connected units, illustrating how IoT elevates convenience and food safety. Weber’s 2024 Summit Smart Grill layers touchscreen controls and in-hood sensors that automate searing, roasting, and smoking cycles. Predictive maintenance alerts reduce downtime while app-based recipe libraries deepen brand engagement, keeping consumers within proprietary ecosystems. Mid-tier price points now include Bluetooth probes and voice-assistant integration, widening addressable audiences beyond early adopters. As more households value hassle-free precision, smart functionality becomes a baseline expectation rather than a premium upsell.
Growing disposable income & urbanization in emerging markets
Asia-Pacific’s rapid urban expansion stimulates rooftop and balcony grilling, even in space-constrained apartments where compact electric or portable gas models thrive. Rising middle-class wages turn grills into aspirational lifestyle products rather than utilitarian appliances. Youthful demographics embrace Western techniques yet adapt them to local flavors, buying accessories for skewers, flatbreads, and seafood common in regional cuisines. Developers respond by adding communal barbecue areas to high-rise complexes, embedding outdoor cooking into everyday social rituals. Urban apartment dwellers increasingly invest in compact, electric, and portable grilling solutions that accommodate limited outdoor space while delivering authentic cooking experiences.
Surge in tail-gating culture around e-sports tournaments
E-sports events attract younger, tech-savvy crowds that merge gaming with outdoor gatherings, expanding demand for lightweight, quick-deploy grills. Portable batteries such as EcoFlow’s RIVER 2 Pro enable electric grilling where propane is restricted, ensuring venue compliance. Social-media-friendly aesthetics—bright colors, folding legs, and multi-fuel versatility—resonate with this cohort and magnify word-of-mouth reach. Brands gain visibility by sponsoring tournament tailgates, introducing grilling to consumers previously outside the core audience. The trend opens incremental volume without cannibalizing mainstream suburban sales. The cultural fusion of gaming and grilling creates marketing opportunities for brands to engage with demographics traditionally outside the core grilling market, expanding the total addressable market beyond conventional outdoor cooking enthusiasts.
Restraints Impact Analysis of Barbeque Grill Market*
| Restraint | (~) % Impact on CAGR Forecast | Geographic Relevance | Impact Timeline |
|---|---|---|---|
| Fluctuating raw-material (steel & aluminum) prices | -0.8% | Global manufacturing hubs | Short term (≤ 2 years) |
| Seasonality of demand in colder regions | -0.6% | Northern North America & Europe | Medium term (2-4 years) |
| Municipal restrictions on charcoal emissions in cities | -0.4% | Urban centers globally | Long term (≥ 4 years) |
| Supply-chain disruptions & freight-cost volatility | -0.5% | Global, with Asia-Pacific manufacturing impact | Short term (≤ 2 years) |
| Source: Mordor Intelligence | |||
Fluctuating raw-material (steel & aluminum) prices
Weber posted a USD 330 million net loss in fiscal 2022 after inflation and currency swings inflated input costs, illustrating margin compression when spot steel rises 15-20% within one quarter. Larger players hedge through multi-year contracts, whereas smaller firms must absorb spikes or raise prices, risking share erosion. Some producers reduce thickness or switch to coated sheet to manage costs, but durability perceptions can suffer. Value-tier items face the harshest impact because price sensitivity limits pass-through latitude. Persistent volatility accelerates consolidation as capitalized manufacturers acquire distressed rivals to secure volume discounts. Premium brands can partially offset material cost increases through value-added features and brand positioning, while value-oriented products face direct margin pressure that may require retail price adjustments or specification reductions.
Seasonality of demand in colder regions
Retail sell-through peaks from April to August, leaving dealers with costly inventory that must be discounted before winter, squeezing gross margins. Production lines confront under-utilization during off-season months, inflating per-unit overhead. While cold-weather ignition systems exist, adoption remains niche because snow and low daylight discourage outdoor cooking. Brands counterbalance by expanding in milder Sun-Belt states and exporting to the Southern Hemisphere to create counter-seasonal revenue. Nevertheless, the barbeque grill market endures cyclical cash-flow swings that complicate working-capital management. Geographic concentration of seasonal demand in key markets like Canada and northern U.S. states limits total addressable market expansion and forces companies to rely heavily on southern and international markets for consistent revenue streams.
*Our forecasts treat driver/restraint impacts as directional, not additive. The impact forecasts reflect baseline growth, mix effects, and variable interactions.
Barbeque Grill Market Segment Analysis
By Fuel Type:
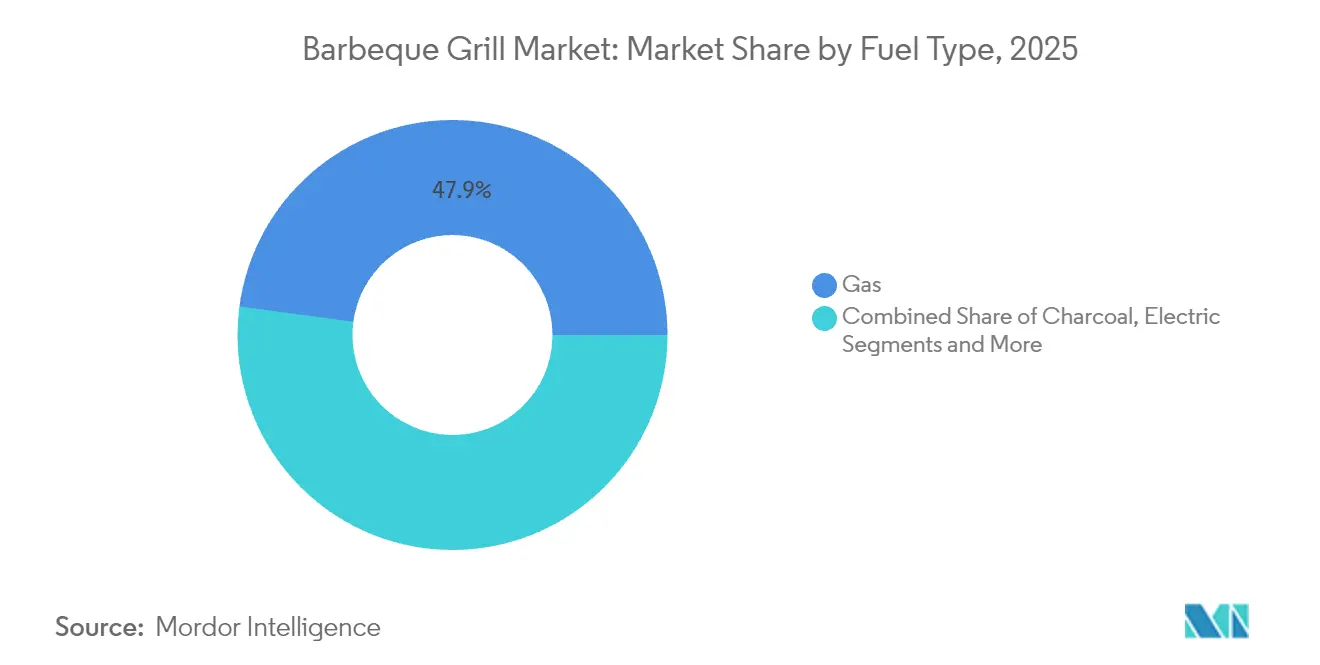
Gas Dominance Faces Pellet DisruptionGas grills hold 47.88% of barbeque grill market share in 2025 to push-button ignition and precise flame control, while pellet units account for 6.54% CAGR through 2031 due to wood-fired flavor and digital thermostats. Charcoal models persist among purists but encounter regulatory pressure from particulate limits, restricting urban adoption. Electric and hybrid designs address apartment rules and wildfire bans, broadening household penetration. Traeger’s Woodridge series helped December 2024 sales jump 30%, showcasing pellet appeal among flavor-driven consumers. Manufacturers now bundle multiple fuel options to hedge against regional regulation and taste preferences, supporting category resilience.
Pellet technology narrows performance gaps by introducing sear plates and direct-flame modes that rival gas for high-heat tasks, enhancing perceived versatility. Weber’s Searwood line combines app control with 600 °F searing, positioning pellets as an all-purpose platform. Renewable propane initiatives also sustain gas relevance by offering carbon-neutral options without hardware changes. The barbeque grill market size for gas models will still expand, but at a slower pace, as pellet adoption accelerates among younger buyers valuing flavor and tech convenience. Competitive dynamics thus hinge on balancing legacy gas loyalty with emerging pellet enthusiasm.

By Product Design:
Portability Gains GroundFreestanding units captured 58.05% of the barbeque grill market in 2025 because they balance cooking area, storage, and price. Portable grills, however, record a 6.06% CAGR on the back of tail-gating, camping, and apartment living trends. Built-in configurations flourish inside luxury outdoor kitchens where homeowners desire cohesive aesthetics and integrated utilities, lifting average transaction values beyond USD 5,000. Disposable single-use trays address convenience but face environmental pushback that deters permanent category growth. Consumers increasingly demand modularity, leading brands to design cart-mounted bases that detach into tabletop mode, blurring historical design boundaries.
Urban millennials gravitate toward Weber’s Traveler series, which folds to car-trunk size while retaining 320 sq in of cooking space. Premium homeowners invest in masonry islands featuring gas, charcoal, and pellet bays, illustrating multi-fuel convergence at high price tiers. Product marketers emphasize weight, setup time, and BTU output for portable lines, contrasting with finish, warranty, and customization for built-ins. The barbeque grill market leverages these divergent value propositions to maximize volume and margin across income brackets. Expect continued innovation in collapsible frames and lightweight alloys to satisfy growing mobility demands.
By Technology:
Smart Features Drive InnovationConventional knobs and analog thermometers still control 84.55% of 2025 shipments, yet smart grills register 6.63% CAGR as connectivity moves mainstream. Early adopters appreciated remote monitoring; today’s buyers also seek auto-shutdown, meat-probe algorithms, and cloud-recipe libraries that prevent overcooking. Traeger’s WiFIRE ecosystem posts only 3.6% U.S. household penetration, indicating vast headroom within the barbeque grill market. Middleby Corp. funnels commercial IoT expertise into residential launches, shortening cook cycles through predictive flame modulation. Voice assistants from Amazon and Google now integrate with grill apps, allowing hands-free temperature tweaks that enrich user experience.
Component costs decline as Wi-Fi modules commoditize, enabling mid-tier SKUs under USD 599 to include smartphone dashboards. Cloud analytics deliver firmware updates that extend appliance life and foster brand attachment long after the initial sale. Security patches and data-privacy assurances become selling points as grills increasingly join smart-home networks. For traditionalists, brands retrofit plug-and-play probe kits so legacy models participate in connected ecosystems, monetizing after-market accessories. The barbeque grill industry therefore transforms from hardware-centric to service-enabled, unlocking recurring revenue streams.
By End-User:
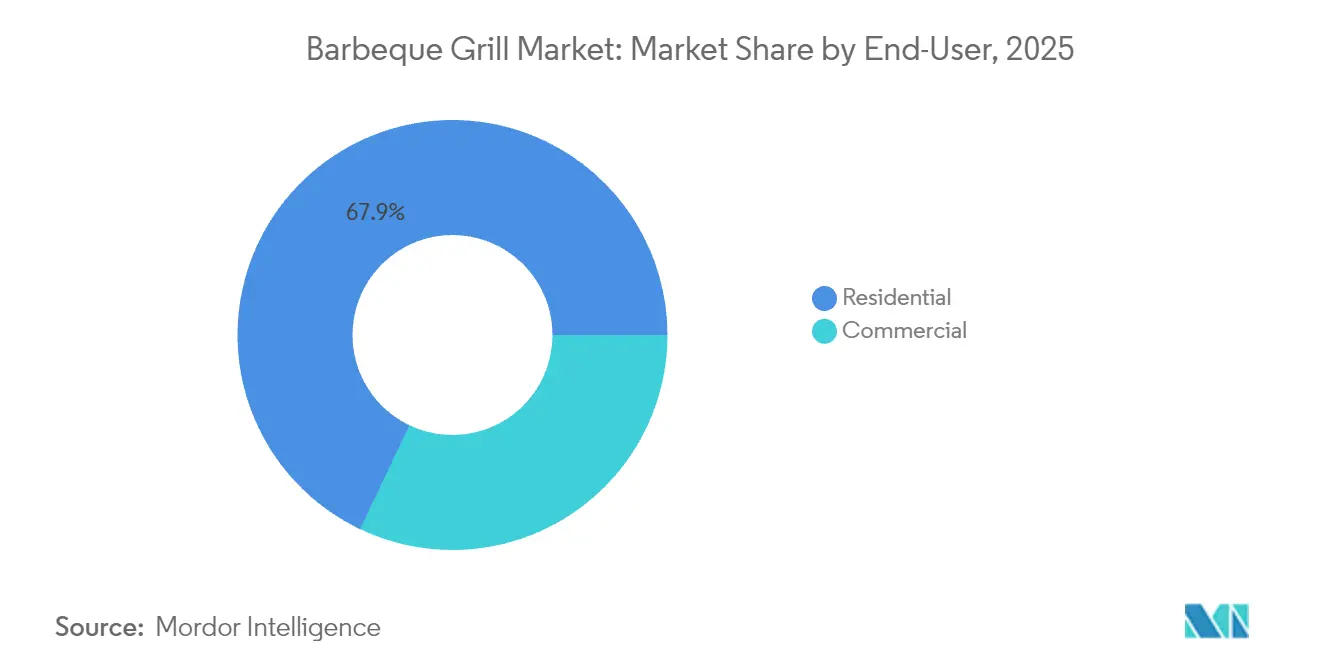
Commercial Growth AcceleratesResidential buyers represented 67.92% of barbeque grill market size in 2025, reaffirming backyard cooking as a home-life staple. Commercial venues—restaurants, resorts, and caterers—grow at 5.61% CAGR, drawn by live-fire theatrics that elevate dining ambience. Post-pandemic regulations encourage al-fresco service, prompting eateries to invest in NSF-rated, high-throughput units. Food trucks and pop-up kitchens choose compact, propane-fired models that meet safety codes and deliver consistent output in tight spaces. Cross-over products blur boundaries as residential customers buy commercial-grade stainless steel systems for long-term value and bragging rights.
Urban ordinances restricting smoke push restaurants toward gas or electric grills with catalytic converters, accelerating replacement cycles in dense metros. Hotels market poolside barbecue packages, bundling chef experiences with equipment rentals during peak tourist seasons. Corporate campuses add outdoor cooking stations to attract employees back on site, supporting weekday throughput. Manufacturers tailor SKUs with fold-out shelves, interchangeable grates, and heavy-duty casters to suit high-volume use cases. Consequently, commercial adoption diversifies revenue sources and offsets residential seasonality.
By Distribution Channel:
Retail Dominance StrengthensB2C retail commands 73.12% of 2025 global sales and posts a robust 6.17% CAGR as omnichannel strategies unify online research with store pickup. Tractor Supply’s rollout of Weber products to 500 outlets evidences big-box expansion into rural catchments that traditionally relied on independent dealers. Specialty stores retain relevance by staffing certified grill masters who offer assembly, maintenance, and cooking classes. E-commerce volumes rise due to curbside delivery of large crates, aided by freight partnerships that include lift-gate service and timed scheduling. Direct-to-consumer portals boost margins and harvest user-behavior data for targeted upsells such as rubs and covers.
Mass merchandisers focus on entry-level SKUs during Memorial Day and Prime Day promotions, funneling traffic toward premium lines displayed in end-caps. Virtual showrooms employ augmented reality to visualize built-in islands within customer patios, reducing return risk for big-ticket orders. Loyalty programs bundle accessories and consumables, generating annuity sales beyond the initial hardware purchase. Installation services become a differentiator as more consumers choose complex built-in modules requiring professional hookup. The barbeque grill market consequently rewards retailers that integrate fulfillment, financing, and after-sales support into one seamless journey.
Geography Analysis
North America Barbeque Grill Market
North America controlled 28.84% of barbeque grill market size in 2025, propelled by 76 million grill-owning households and a cultural penchant for outdoor gatherings. Southern states permit year-round usage, yet northern zones endure seasonal demand dips despite innovations like insulated fireboxes. Municipal smoke regulations hamper charcoal growth in cities, steering buyers toward gas and pellet alternatives that meet EPA thresholds. Premium adoption continues as suburban homeowners allocate renovation budgets to elaborate outdoor kitchens outfitted with refrigeration, sinks, and smart-enabled grills. Retail partnerships broaden rural reach, sustaining volume even when discretionary spending tightens.
APAC Barbeque Grill Market
Asia-Pacific delivers the fastest 6.88% CAGR through 2031, fueled by urbanization, rising middle-class incomes, and growing affinity for Western cooking styles blended with regional flavors. Compact electric grills and tabletop gas units cater to limited balcony spaces in megacities such as Shanghai, Mumbai, and Jakarta. Governments encourage communal recreation by adding barbecue pits to public parks, supporting casual social dining. International tourism spreads grilling culture as travelers emulate experiences enjoyed abroad, further stimulating local demand. Currency volatility and trade barriers remain risks, yet multi-plant sourcing within ASEAN reduces supply-chain exposure for global brands.
Europe Barbeque Grill Market
Europe exhibits steady mid-single-digit expansion as households extend living areas into gardens and terraces post-pandemic. Northern countries normalize winter grilling with double-layer lids and cold-start ignition systems, countering daylight shortages. Mediterranean consumers integrate grills into traditional wood-fired cuisine, preferring ceramic kamado styles for bread and pizza preparation. Stricter emissions frameworks prompt gas and electric substitution in dense urban neighborhoods, though countryside regions continue charcoal traditions. The barbeque grill market benefits from widespread environmental consciousness, spurring interest in renewable propane and sustainably sourced hardwood pellets.
Mordor Intelligence provides coverage of the barbeque grill market across other key regional markets, including Europe, each with their regulatory frameworks and demand patterns. Detailed country-level analysis extends to Germany incorporating local coverage and market participation, as required.
Regulatory Landscape
Safety and performance compliance remains central for outdoor cooking gas appliances, with certification pathways anchored to ANSI Z21.58:2022/CSA 1.6:2022 (Edition 6). The standard framework covers construction and functional safety, and it also includes test provisions relevant to real-world use (including wind resistance), which affect burner, ignition, and enclosure design choices across gas-grill platforms.
A notable compliance milestone is the certification change effective September 1, 2026, when conformity moves to ANSI Z21.58:2022/CSA 1.6:2022 Edition 6 plus Update 1. The update adds requirements for low-temperature operation, structure, and smart-enabled devices, tightening engineering and documentation expectations for connected grills and increasing coordination with certification bodies and testing labs during product-development cycles.
Value Chain Analysis
The barbeque grill value chain begins with upstream inputs and components such as steel and aluminum structures, burners and valves for gas units, heating elements for electric grills, and controllers and connectivity modules for smart models. From there, manufacturers handle production, assembly, and quality testing anchored to safety standards such as ANSI/CSA requirements for outdoor cooking gas appliances. Brands then route finished grills and accessories through B2C retail channels (big-box, specialty, and online) and B2B/direct programs that support commercial installations and premium outdoor-kitchen builds, where delivery, installation, and service networks shape the customer value proposition.
Industry associations also support midstream and downstream activities through advocacy and technical resources for manufacturers, retailers, and distributors. HPBA and HPBAC participation, including product sections used to fund and lead legislative and regulatory initiatives, links regulatory monitoring, education, and market coordination with channel execution. On the supply-chain side, tariff exposure and sourcing choices influence landed costs and resilience, as reflected by Traeger booking USD 12.7 million in IEEPA tariff refunds in Q1 2026 while continuing to manage manufacturing diversification amid changing tariff conditions.
Competitive Landscape
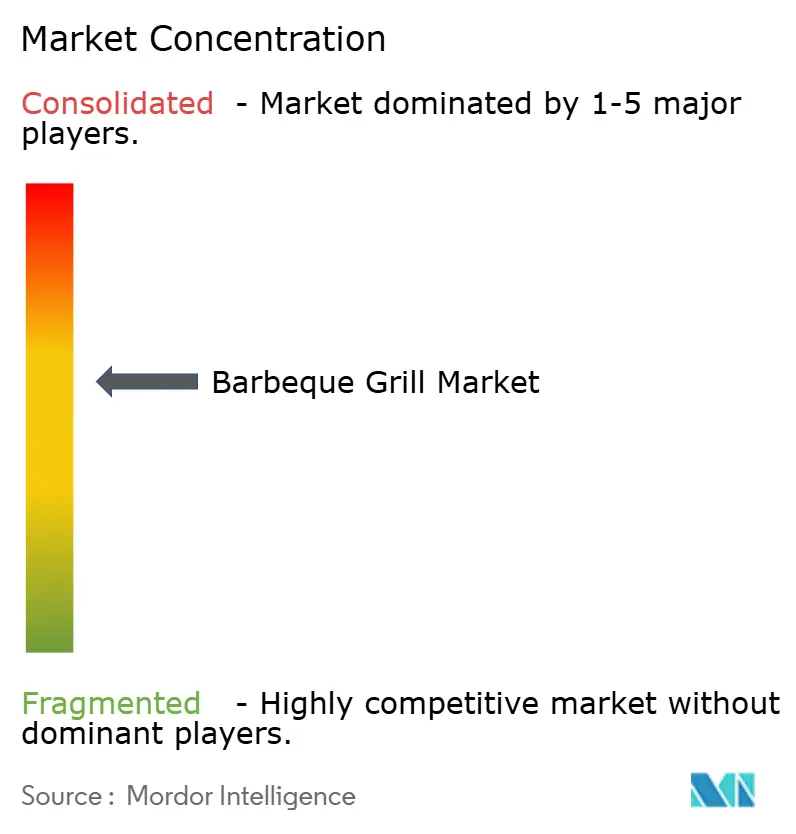
The global barbeque grill market remains moderately fragmented; however, consolidation trends intensify following the Weber–Blackstone merger that pools R&D, marketing, and supply-chain muscle under one corporate roof. Traeger dominates the pellet niche with 2.7 million U.S. units sold since 2020, yet that figure equates to only 3.6% household penetration, underscoring vast upside for connected wood-smoke technology. Char-Broil, Napoleon, and Coleman compete on value, leveraging private-label deals with mass merchants to undercut premium rivals. Middleby focuses on commercial crossover, repackaging professional ovens and vent-hood expertise into residential lines that command higher ASPs. New entrants like Spark Grills emphasize charcoal flavor with electric filament ignition, illustrating how innovation continues across fuel categories despite regulatory scrutiny.
Technology serves as the primary differentiator: cloud analytics, AI-driven cook algorithms, and subscription recipe services foster stickier customer relationships than hardware alone. Direct-to-consumer channels deliver higher gross margin, but require robust logistics and after-sales infrastructure to manage big-box packages. ESG narratives gain prominence, with brands publicizing decarbonization roadmaps and recyclable packaging to meet retailer scorecard criteria. As economies of scale favor multiproduct portfolios, niche startups may partner or license IP rather than building full-stack operations. Competitive intensity will likely increase until smart-feature penetration approaches parity with indoor kitchen appliances.
Barbeque Grill Industry Leaders
-
Weber Inc.
-
Traeger, Inc.
-
Napoleon Grills
-
Char-Broil (W.C. Bradley)
-
Masterbuilt
- *Disclaimer: Major Players sorted in no particular order
Barbeque Grill Market Companies Covered in this Report
- Blackstone
- Broil King (Onward Mfg.)
- Bull Outdoor Products
- Char-Broil (W.C. Bradley)
- Char-Griller
- Coleman Company
- Cuisinart (HomeWorld)
- Dyna-Glo (GHP Group)
- Empire Comfort Systems
- Everdure (Heston Blumenthal)
- Fire Magic (RH Petersen)
- George Foreman (Spectrum)
- Kamado Joe
- Kenmore
- Landmann
- Lynx Grills
- Masterbuilt Mfg.
- The Middleby Corporation
- MHP Grills
- Napoleon Grills
- Newell Brands
- Pit Boss (Dansons)
- Traeger Inc.
- Weber Inc.
- Z Grills
Market Opportunities and Future Outlook
Smart, app-centric grilling ecosystems offer a concrete differentiation space across fuel types, particularly as connected functionality extends beyond premium-only positioning. In January 2026, Weber expanded its smart grilling portfolio to build a more unified ecosystem across grills, accessories, and the WEBER CONNECT app, reinforcing demand for interoperable probes, controllers, and software experiences that can be extended through accessories and updates rather than requiring new-hardware replacements.
Portfolio breadth and cost takeout are also shaping where companies place new product bets and how they price into mass-market segments. After the Weber and Blackstone business combination completed in May 2025, the combined platform aligns traditional grilling and griddles under distinct brands and supports cross-selling through shared distribution and product roadmaps. At the same time, Traeger highlighted Project Gravity (phase 2) as an initiative targeting USD 6 million to USD 12 million in annualized pre-tax savings, which can fund reinvestment in new platforms (including entry price points and adjacent formats) and support margin protection amid input-cost and tariff-driven volatility.
Recent Industry Developments in Barbeque Grill Market
- May 2026: Weber Inc. unveiled its first Santa Maria-style live-fire grill platform at the Open Fire World Championship in Memphis, with availability planned for 2027. The launch expands the premium live-fire platform lineup. The release broadens the product ecosystem and strengthens Weber's premium live-fire portfolio.
- April 2026: Traeger, Inc. launched the Westwood Series entry-level wood-pellet grills, available in two sizes with automatic digital temperature control and WiFIRE connectivity. The series introduces a connected pellet-grill entry point. It broadens Traeger's price- and tech-led offering to reach entry-level buyers.
- April 2026: Traeger, Inc. launched the Irontop Series griddle line, designed to provide a new entry price point for Traeger outdoor cooking. The line expands the griddle category at an entry price. It also diversifies Traeger's product formats and consumer touchpoints in outdoor cooking.
Barbeque Grill Market Report Scope and Research Methodology
Market Definition and Coverage
For this study, the barbeque grill market covers the value of grills used for outdoor or indoor grilling that are sold through retail and direct channels, across residential and commercial end users, with revenues counted at the point of sale.
Scope exclusions: Grill accessories, fuels (charcoal, pellets, propane), replacement parts, and outdoor kitchen furniture are excluded from this market sizing.
Segments Covered in This Report
- By Fuel Type
- Gas Grills
- Charcoal Grills
- Electric Grills
- Pellet Grills
- Hybrid/Alternative Fuel
- Infrared
- By Product Design
- Built-In
- Freestanding
- Portable / Table-top
- Disposable / Single-use
- By Technology
- Conventional
- Smart/Connected
- By End-User
- Residential
- Commercial
- By Distribution Channel
- B2B/Direct from the Manufacturers
- B2C/Retail
- Specialty Stores
- Home Centers & DIY Stores
- Mass Merchandisers
- Online
- Other Distribution Channels
- By Geography
- North America
- United States
- Canada
- Mexico
- South America
- Brazil
- Peru
- Chile
- Argentina
- Rest of South America
- Europe
- United Kingdom
- Germany
- France
- Spain
- Italy
- BENELUX
- NORDICS
- Rest of Europe
- Asia-Pacific
- India
- China
- Japan
- Australia
- South Korea
- South East Asia
- Rest of Asia-Pacific
- Middle East and Africa
- United Arab Emirates
- Saudi Arabia
- South Africa
- Nigeria
- Rest of Middle East and Africa
- North America
Data Sources, Market Sizing, and Validation
Desk Research
We start with desk research to set the market boundaries and to build the first draft of the demand and supply picture. Public sources we use include government trade and production statistics such as UN Comtrade and national customs releases, US Census Bureau manufacturing and retail indicators, and energy and safety guidance referenced by regulators such as the US Consumer Product Safety Commission.
To sanity check usage patterns and seasonality, we also review association and standards materials such as HPBA publications, outdoor recreation statistics from the US Bureau of Economic Analysis, and peer reviewed papers on cooking emissions and appliance performance. This is complemented with company annual reports, investor presentations, and reputable business press, plus selective use of paid subscriptions for company financials, patent lookups, and shipment level import-export views when gaps appear. The sources listed above are illustrative only, and many other references were used for data collection, validation, and clarification during the study.
Primary Interviews and Surveys
Primary interviews and survey input are used to convert the desk findings into a workable market model, then to pressure test the inputs that can swing totals. We speak with manufacturers, brand distributors, retailers, component suppliers, and commercial buyers to validate price ladders, channel mix, and shifts across fuel types and smart connectivity.
Because demand and pricing vary by climate, housing type, and regulation, we cross-checked inputs across major consuming regions. Where responses did not align with observed trade and retail signals, we triggered follow-ups to reconcile the drivers.
Distribution of primary research fieldwork respondents
| Company type | Respondent position | Region |
|---|---|---|
| Top tier: 36% | CXOs: 12% | APAC: 53% |
| Mid tier: 42% | Functional/Unit leaders: 36% | EMEA: 29% |
| Smaller Players: 22% | Managers: 52% | Americas: 18% |
Market-Sizing & Forecasting
Sizing is built using a top-down approach where production, trade flows, and category demand indicators are reconstructed by region, and then translated into value using region-specific average selling prices and channel markups. Along the way, selective bottom-up approximations corroborate totals, such as sampling ASP x unit volumes in key countries, distributor and retail channel checks, and manufacturer revenue splits when disclosures allow it.
The model is guided by practical inputs that can be checked and refreshed, including household outdoor living participation, replacement cycles tied to durability and usage, the mix shift across gas, charcoal, electric, and pellet units, and the price premium associated with smart or connected features. It also accounts for the split between residential and commercial buying, and the share moving through B2C retail versus direct B2B selling, because pricing and discounting differ by route to market. Where unit signals are incomplete, gaps are handled by using proxy indicators like import dependence for certain regions and by applying conservative ranges that are later narrowed through interviews.
For forecasting, scenario analysis is used so price and volume can be adjusted separately, then checked against what industry participants expect for promotions, raw material pass-through, and premiumization. When the main drivers are aligned, the market path becomes clearer, and the final curve is set at the end.
Data Validation & Update Cycle
Validation is done by comparing model outputs against independent checks, then digging into mismatches before numbers are signed off. We review year over year swings by region, test whether implied unit values look reasonable against known price bands, and confirm that channel splits do not create double counting.
A second analyst review challenges assumptions with the biggest impact, such as ASP progression and the pace of smart grill adoption. Interviewees are re-contacted when a data point sits well outside the expected range. Reports are refreshed annually, and interim updates are made when material events occur that can move demand or pricing. Before delivery, a final pass is done so clients receive the most current view that can be supported at that time.
Mordor Intelligence's Barbeque Grill Market Size Compared Against Other Published Estimates
Published market sizes for barbeque grills can differ even when they appear to measure the same underlying category, because product boundaries and pricing logic are not always consistent. Differences usually come from what gets counted as a grill sale versus an adjacent purchase, the year used as the base, and how fast ASPs are assumed to rise.
Accessories and fuels often get blended into some estimates, and that is one of the biggest reasons the spread appears. These add-ons can be large and can follow different buying cycles than the grill itself. Another gap driver is how hybrid products and single-use or portable formats are treated, along with whether currency conversion is done at annual averages or spot timings, which can move the USD value for the same local sales.
Benchmark comparison
| Source | Market Size | Gaps in Research Methodology |
|---|---|---|
| Mordor Intelligence | USD 6.36 B (2026) | |
| Trade Data Aggregator A | USD 5.15 B (2024) | Uses a 2024 base and a narrower type list, and the definition appears to emphasize core grill types with simpler segmentation, which can understate value when premium smart and hybrid units are more common. |
| Press Release Digest B | USD 6.10 B (2024) | Reported as an incremental growth outlook over 2024 to 2028 with limited visibility on included revenue items and price build, so totals can shift depending on whether ASP inflation and channel markups are fully captured. |
The table shows that differences are mainly explained by what is counted as a grill-only sale, the base year chosen, and how pricing is carried forward. Accessories and fuels sit outside Mordor Intelligence's scope, which keeps the value tied to grill equipment revenues and makes the estimate easier to reconcile with unit and price checks year by year.
Key Questions Answered in the Report
How large is the global barbeque grill market in 2026?
The barbeque grill market size is USD 6.36 billion in 2026 and is forecast to reach USD 8.14 billion by 2031.
Which fuel type is growing the fastest?
Pellet grills show the highest momentum, expanding at a 6.54% CAGR through 2031 to wood-fire flavor and digital temperature control.
What share do gas grills hold today?
Gas grills hold 47.88% of barbeque grill market share as of 2025, maintaining leadership through convenience and wide availability.
Which region offers the strongest growth outlook?
Asia-Pacific leads with a projected 6.88% CAGR, driven by urbanization, rising incomes, and compact product formats suited to apartment living.
How important is smart technology to future sales?
Smart-enabled units are expected to grow at 6.63% CAGR as connectivity, app control, and predictive cooking features become mainstream.