Bag-on-valve (BOV) Technology Market Size and Share
Market Overview
| Study Period | 2020 - 2031 |
|---|---|
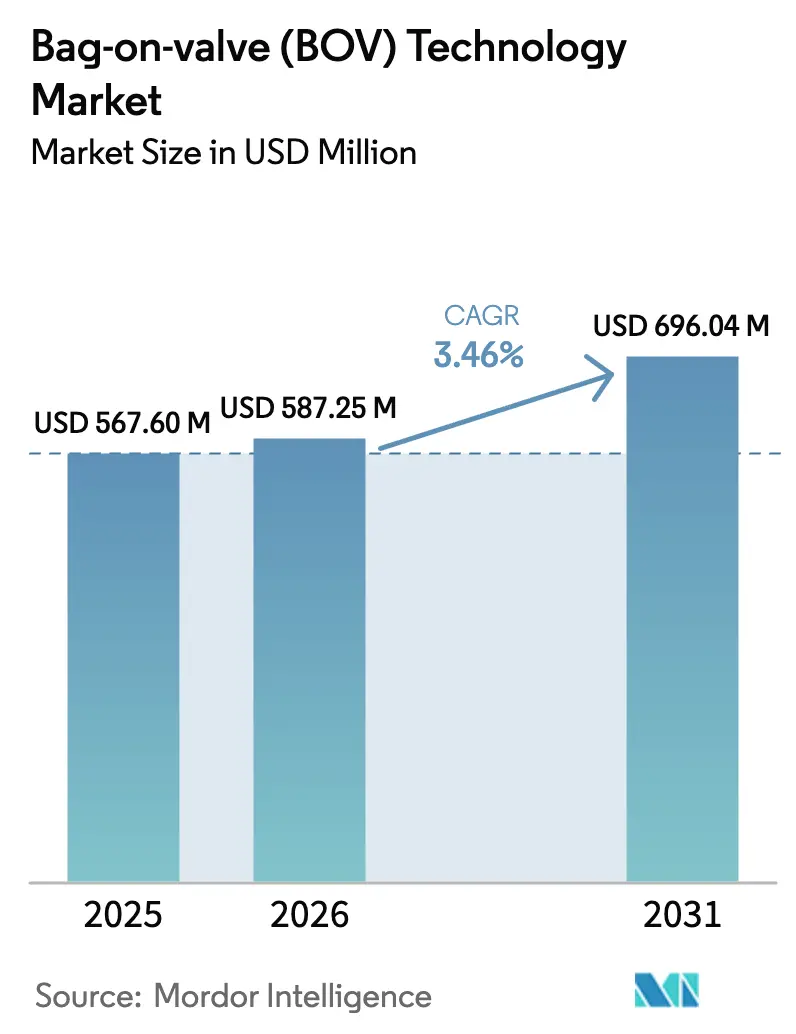
| Market Size (2026) | USD 587.25 Million |
| Market Size (2031) | USD 696.04 Million |
| Growth Rate (2026 - 2031) | 3.46% CAGR |
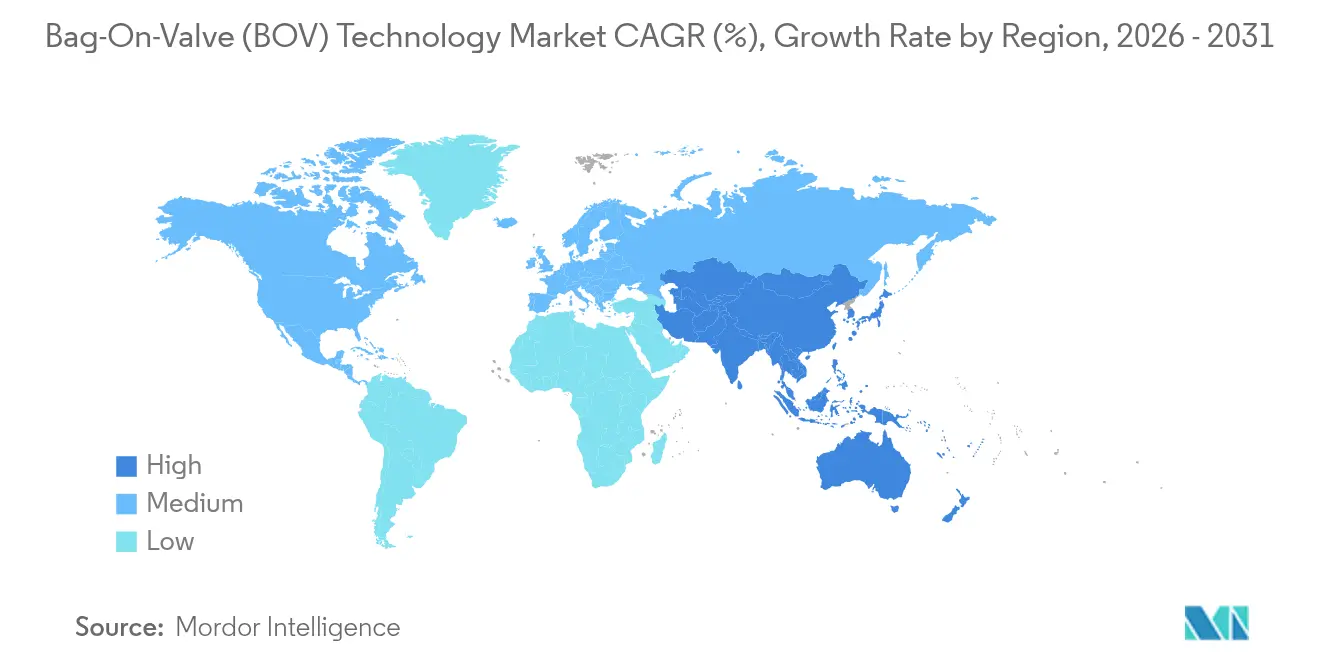
| Fastest Growing Market | Asia Pacific |
| Largest Market | Europe |
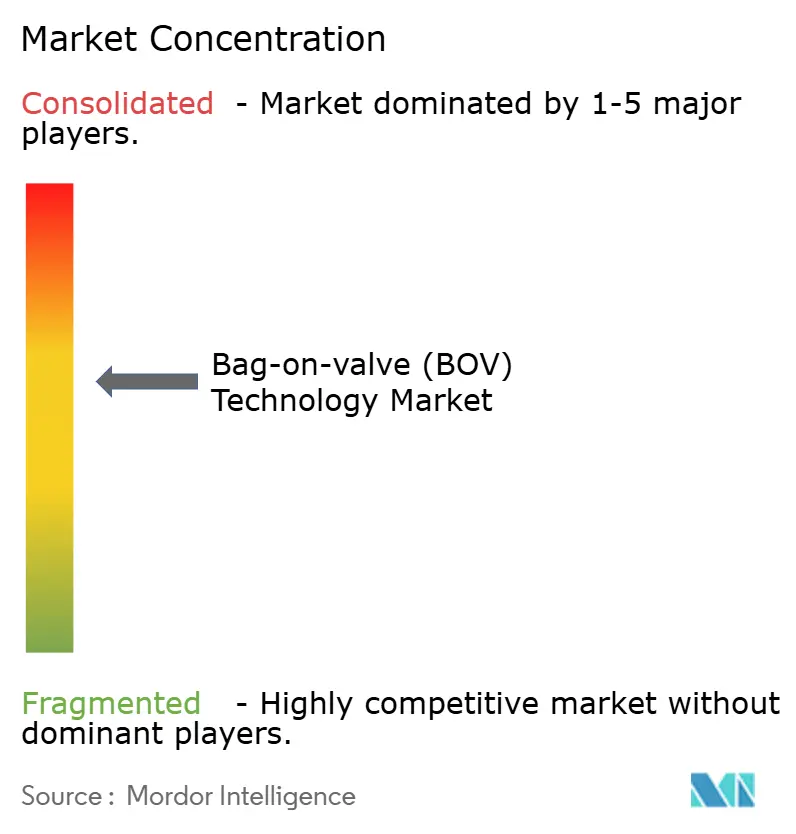
| Market Concentration | Medium |
Major Players *Disclaimer: Major Players sorted in no particular order Image © Mordor Intelligence. Reuse requires attribution under CC BY 4.0. | |
Bag-on-valve (BOV) Technology Market Analysis by Mordor Intelligence
Bag-On-Valve Technology market size in 2026 is estimated at USD 587.25 million, growing from 2025 value of USD 567.60 million with 2031 projections showing USD 696.04 million, growing at 3.46% CAGR over 2026-2031. This growth reflects the steady migration of the technology from niche pharmaceutical uses to mainstream personal-care, food-processing and industrial applications. Momentum stems from global restrictions on hydrofluorocarbon propellants, widening preference for nitrogen systems, and brand commitments to carbon-neutral packaging. Established filling infrastructure for aluminum containers and rising demand for premium, preservative-free formulations accelerate adoption, while technical innovations such as 360-degree dispensing broaden the addressable base of the Bag-On-Valve Technology market. Competitive pressure intensifies as leading suppliers strengthen patent portfolios and regional capacity, yet medium market concentration persists as specialized entrants target fast-expanding food and dermocosmetic niches.
Key Report Takeaways
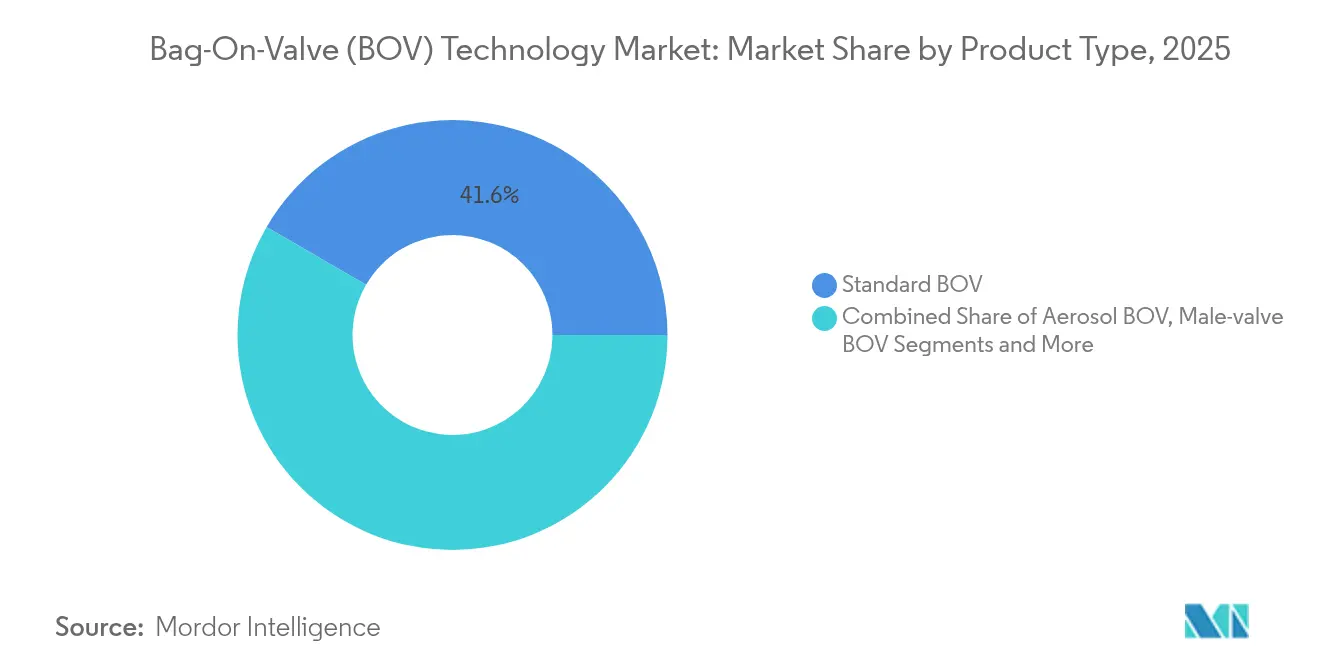
- By product type, standard BOV systems led with 41.62% of the Bag-On-Valve Technology market share in 2025.
- By container material, aluminum accounted for 47.94% share of the Bag-On-Valve Technology market size in 2025.
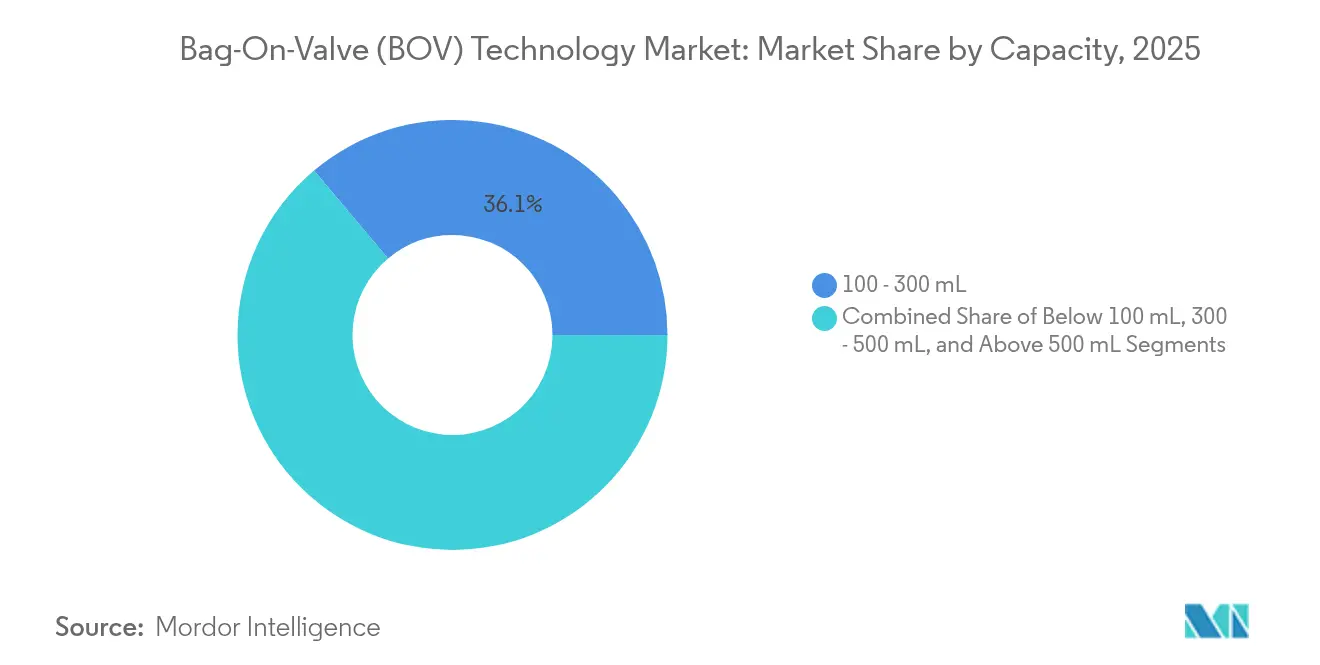
- By capacity, the 100-300 mL segment commanded 36.14% share of the Bag-On-Valve Technology market size in 2025.
- By end-use industry, personal care & cosmetics held 39.05% revenue share in 2025, while food & beverages is projected to expand at a 8.74% CAGR to 2031.
- By geography, Europe led with 33.15% market share in 2025; Asia-Pacific is advancing at an 8.32% CAGR through 2031.
Note: Market size and forecast figures in this report are generated using Mordor Intelligence’s proprietary estimation framework, updated with the latest available data and insights as of 2026.
Global Bag-on-valve (BOV) Technology Market Trends and Insights
Drivers Impact Analysis*
| Driver | (~) % Impact on CAGR Forecast | Geographic Relevance | Impact Timeline |
|---|---|---|---|
| Growing Preference For Eco-Friendly Aerosol Packaging | +0.8% | Global, with EU and North America leading adoption | Medium term (2-4 years) |
| Increasing Adoption Of BOV In Pharmaceuticals | +0.6% | North America & EU, expanding to APAC | Long term (≥ 4 years) |
| Rising Demand For Preservative-Free Personal-Care & Cosmetics | +0.5% | Global, concentrated in developed markets | Medium term (2-4 years) |
| OEM Shift To Nitrogen-Only Propellants Amid PFAS Bans | +0.7% | North America, EU, Australia | Short term (≤ 2 years) |
| Surge In Plant-Based Food-Spray Product Launches | +0.4% | North America & EU, emerging in APAC | Medium term (2-4 years) |
| Integration With Connected Dose-Counting Inhaler Actuators | +0.3% | North America & EU pharmaceutical markets | Long term (≥ 4 years) |
| Source: Mordor Intelligence | |||
Growing Preference For Eco-Friendly Aerosol Packaging
Brands facing carbon-reduction targets rely on BOV to eliminate volatile organic compound propellants and achieve product evacuation rates exceeding 95%, cutting residual waste and greenhouse-gas footprints. Aluminum’s infinite recyclability complements the compressed-air model, aligning with extended-producer-responsibility fees across Europe. Ball Corporation’s 2023 report underscores aluminum’s role in net-zero trajectories, reinforcing brand commitments to circularity[1]Ball Corporation, “2023 Combined Report,” ball.com. Consumer surveys show willingness to pay a 15-20% premium for visibly sustainable packaging, giving BOV formats pricing headroom that offsets higher valve costs. Retailers also favor recyclable packs because they lower disposal surcharges under emerging municipal-waste rules. As carbon-label disclosures spread, the Bag-On-Valve Technology market secures a durable advantage over conventional aerosols.
Increasing Adoption Of BOV In Pharmaceuticals
Sterile separation and closed-system dosing make BOV attractive for respiratory drugs and sensitive dermatological therapies. Early feasibility studies on climate-friendly albuterol inhalers using ultra-low-GWP propellants confirm technical viability and forecast annual peak sales above USD 500 million. Integrated dose counters enhance adherence monitoring, meeting payer demands for outcome-based reimbursement. Multi-patient trials report extended shelf life without preservatives, reducing formulary wastage for hospital pharmacies. Although regulatory dossiers remain complex, the higher clinical value proposition encourages originator firms to commit capital, raising the pharmaceutical share within the Bag-On-Valve Technology market.
Rising Demand For Preservative-Free Personal-Care & Cosmetics
Clean-beauty shoppers reject parabens and phenoxyethanol, driving formulators toward water-based BOV sprays that remain microbe-free without chemical stabilizers. Aptar’s recyclable airless bottles illustrate parallel moves toward minimal-additive packaging, blending eco claims with sensory convenience[2]AptarGroup, “Bag-On-Valve Technology Platform,” aptar.com. The 360-degree spray allows uniform application on hard-to-reach zones, a key selling point in sunscreens and therapeutic balms. Premium brands leverage BOV to launch viscous gels and whipped textures that conventional valves clog, expanding differentiated SKUs. Margin analytics show preservative-free lines earn 25% higher average selling prices, reinforcing segment growth in the Bag-On-Valve Technology market.
OEM Shift To Nitrogen-Only Propellants Amid PFAS Bans
Legal curbs on per- and polyfluoroalkyl substances, including Canada’s phased ban effective 2025, accelerate nitrogen adoption. Nitrogen is inert, abundant and price-stable, avoiding the cost spikes seen with specialty fluorinated gases. BOV’s dual-chamber architecture maintains constant pressure, delivering fine particle distribution without PFAS surfactants. Testing confirms stable spray profiles across temperature ranges common in automotive and household applications. Contract fillers already retrofit lines to handle nitrogen-only formats, shortening lead times for brand conversions and propelling the Bag-On-Valve Technology market.
Restraints Impact Analysis*
| Restraint | (~) % Impact on CAGR Forecast | Geographic Relevance | Impact Timeline |
|---|---|---|---|
| Technical Limitations & Regulatory Complexity | -0.4% | Global, particularly stringent in pharmaceutical applications | Long term (≥ 4 years) |
| Higher Unit Cost Vs. Conventional Aerosol Valves | -0.6% | Price-sensitive markets, emerging economies | Medium term (2-4 years) |
| Scarcity Of Circularity-Compliant Multilayer Films | -0.3% | EU and markets with extended producer responsibility | Short term (≤ 2 years) |
| IP-Blocking Patents On 360° Valve-Welding Designs | -0.2% | Global, affecting new entrant market access | Medium term (2-4 years) |
| Source: Mordor Intelligence | |||
Technical Limitations & Regulatory Complexity
BOV struggles with very viscous or particulate-laden formulas that demand unique pressure curves. Pharmaceutical filings require bioequivalence data plus validation of multilayer film integrity, often adding 18-24 months to launch schedules. Japan’s positive-list food-contact rules add further dossier obligations for valves entering food channels. Extreme storage temperatures can compromise laminate layers, prompting brands in Arctic logistics to retain steel cans. These factors temper penetration rates despite evident sustainability benefits.
Higher Unit Cost Vs. Conventional Aerosol Valves
Multilayer bag laminates, precise crimping and leak-testing raise BOV fill costs 40-60% above standard valves. Crown Holdings highlighted margin pressure in metal packaging, pressing suppliers to re-engineer lines for cost take-out. In emerging economies where consumers prioritize unit price over eco attributes, many brand owners delay conversion. Contract packers must invest in dedicated gassing tunnels and qualification protocols, a hurdle for small personal-care entrants. Until scale economies mature, price tension will restrain the Bag-On-Valve Technology market in value-sensitive channels.
*Our forecasts treat driver/restraint impacts as directional, not additive. The impact forecasts reflect baseline growth, mix effects, and variable interactions.
Segment Analysis
By Product Type: Standard BOV Dominates Established Applications
Standard bag-on-valve units accounted for 41.62% of 2025 revenue, anchoring the Bag-On-Valve Technology market in personal-care deodorizers, medical sprays and wound cleansers. Production familiarity among contract fillers and compatibility with existing crimping machines sustain its dominance. Manufacturers focus on valve-seal upgrades that improve pressure retention at high altitudes, opening travel-friendly SKUs for global airlines. Secondary innovation targets metered delivery heads that give caregivers dosing accuracy for pediatric dermatology.
Non-spray low-pressure BOV formats record the highest 7.86% CAGR through 2031, propelled by the food sector’s need for gentle gels and creamy plant-based toppings. Nitrogen cushions delicate foams, preventing oxidation and imparting artisanal mouthfeel that commands premium price tiers in gourmet retail. Brand narratives emphasize zero preservatives and minimal waste, reinforcing consumer trust. Suppliers promote quick-swap nozzle sets that reduce line downtime, a clear cost plus in co-packing contracts.


By Container Material: Aluminum Leadership Faces Plastic Innovation
Aluminum cans held 47.94% revenue in 2025, reaffirming leadership within the Bag-On-Valve Technology market. Infinite recyclability, robust barrier properties and a mature scrap collection network give metal a strong life-cycle score. Ball Corporation’s alliance with Meadow showcases reusable shell plus cartridge concepts that marry circularity with convenience.
Plastic containers, growing at 6.72% CAGR, capture marketers seeking lightweight logistics and shape freedom for ergonomic grip. Breakthrough plasma-coating keeps oxygen ingress below 0.1 cc/litre, meeting shelf-life demands for omega-rich nutritional oils. Brand owners employ translucent PET to highlight natural formula colors, adding shelf impact at point of sale. Life-cycle analysts note lower transit emissions per unit than metal, partially offsetting lower post-consumer recycling rates.
By Capacity: Mid-Range Volumes Optimize Cost-Performance Balance
The 100-300 mL bracket represents 36.14% of 2025 shipments in the Bag-On-Valve Technology market. It balances portion control, handbag portability and attractive price points for facial mists and dermal sprays. Contract fillers configure multi-lane lines in this range to exploit tooling efficiencies and minimize changeover.
Above-500 mL formats expand at 8.08% CAGR, driven by food-service and industrial degreasers where bulk dispenses cut packaging intensity. Caterers favor 600 mL whipped-cream sprays that reduce carton counts per outlet. Automotive workshops adopt 750 mL lubricant cans that maintain contaminant-free product as mechanics use the same valve upright or inverted.
By End-Use Industry: Food & Beverages Accelerates Past Personal Care
Personal care & cosmetics retained 39.05% revenue in 2025 and remain the cornerstone of the Bag-On-Valve Technology market. Premium sun filters, after-sun hydro-gels and probiotic mists gain from 360-degree actuation and chemical-free preservation. Marketing teams highlight dermatologically tested sterile packaging, converting sensitive-skin cohorts.
Food & beverages posts the fastest 8.74% CAGR through 2031. Nitrogen-cushioned bag chambers keep avocado oils fresh without antioxidants, appealing to clean-label cafeteria chains. Patent filings illustrate dual-chamber whipped-sunscreen analogues adapted for culinary foams, proving cross-sector knowledge transfer. Regulatory clarity on food-contact nitrogen boosts investor confidence, unlocking capital for high-speed aseptic BOV fillers.
Geography Analysis
Europe controlled 33.15% of 2025 turnover as stringent F-gas rules pushed brand owners toward nitrogen systems. Germany’s OTC nasal sprays, France’s dermocosmetic houses and the UK’s pet-care aerosols collectively anchor regional demand. LINDAL Group’s French plant relieves logistical pinch points and shortens lead times for major FMCG clients.
Asia-Pacific advances at 8.32% CAGR, the briskest pace in the Bag-On-Valve Technology market. China’s mandatory express-pack recycling rules and Japan’s resin positive list upgrade packaging standards to levels familiar in the EU, easing technology transfer. Rising middle-class spending supports premium mimosa-oil cooking sprays and K-beauty facial mists. Indigenous fillers in India commission multi-format BOV lines, lowering import reliance and pricing barriers.
North America maintains sizeable share underpinned by respiratory therapeutics and environmental policy. The U.S. Consumer Product Safety Commission proposal on HFC limits above 18 mg propels fast brand convergence to nitrogen BOV packs. Canadian PFAS curbs reinforce compliance benefits, giving domestic dairy whip brands first-mover advantage in green grocery channels.

Competitive Landscape
The Bag-On-Valve Technology market remains moderately concentrated. The top five players hold significant revenue, leaving space for niche innovators. AptarGroup leveraged a diversified drug-delivery portfolio to post record Q1 2024 healthcare packaging sales, confirming resilience against cyclicality. LINDAL Group doubled continental output through its new Briey unit, enhancing European supply-chain security and shortening art-to-shelf timelines for personal-care majors.
Precision Valve Corporation defends high-margin business via metered valve patents tailored to controlled-dose allergy sprays. Smaller challengers pursue specialization: Plastipak’s metal-free aerosol wins sustainability awards, and Tri-Pac’s cGMP filling lines target over-the-counter antiseptic foams. Cross-licensing remains limited, preserving pricing power for proprietary assemblies.
Strategic moves lean toward vertical integration and material innovation rather than price wars. Ball Corporation’s minority stake in Meadow champions reusable shell systems that match circular-economy regulations while enlarging the addressable Bag-On-Valve Technology market. Suppliers also co-develop smart actuators with Bluetooth modules for adherence tracking, aligning with tele-health reimbursement models.
Bag-on-valve (BOV) Technology Industry Leaders
AptarGroup, Inc.
LINDAL Group Holding GmbH
Precision Valve Corporation
Coster Tecnologie Speciali SpA
KOH-I-NOOR Mlada Vozice AS
- *Disclaimer: Major Players sorted in no particular order

Recent Industry Developments
- March 2025: Canada confirmed phased PFAS bans covering non-essential uses in consumer goods, elevating demand for nitrogen-based BOV formats.
- January 2025: Ball Corporation invested in Meadow to roll out fully recyclable aluminum cans with KAPSUL refill cartridges for personal and home-care products.


Research Methodology Framework and Report Scope
Market Definitions and Key Coverage
Our study defines the bag-on-valve (BOV) technology market as all pressurized dispensing systems in which a flexible product bag is crimped inside a metal can and the propellant (normally nitrogen or filtered air) sits between the bag and can, forcing nearly complete evacuation at constant pressure. The model tracks unit sales and equivalent value of empty BOV components as well as filled products shipped to retail across personal care, pharmaceutical, household, food, and industrial uses.
Scope exclusion: systems that employ mechanical pumps, pouches, or conventional one-piece aerosol valves without an internal bag have been left outside the baseline.
Segmentation Overview
- By Product Type
- Aerosol BOV
- Standard BOV
- Non-spray / Low-pressure BOV
- Male-valve BOV
- Female-valve BOV
- By Container Material
- Aluminum
- Tin Plate
- Steel
- Plastic
- By Capacity
- Below 100 mL
- 100 - 300 mL
- 300 - 500 mL
- Above 500 mL
- By End-Use Industry
- Pharmaceuticals
- Personal Care & Cosmetics
- Home Care
- Food & Beverages
- Automotive & Industrial
- Geography
- North America
- United States
- Canada
- Mexico
- Europe
- Germany
- United Kingdom
- France
- Italy
- Spain
- Rest of Europe
- Asia-Pacific
- China
- Japan
- India
- South Korea
- Australia
- Rest of Asia-Pacific
- Middle East and Africa
- GCC
- South Africa
- Rest of Middle East and Africa
- South America
- Brazil
- Argentina
- Rest of South America
- North America
Detailed Research Methodology and Data Validation
Primary Research
Mordor analysts spoke with component makers, contract fillers, propellant suppliers, and packaging engineers in North America, Europe, and Asia-Pacific. Interviews clarified fill-weight norms, private-label penetration, and the pace at which brands swap CFC-based aerosols for BOV, enabling us to tighten adoption curves and validate price ladders.
Desk Research
We started with trade statistics from Eurostat PRODCOM, UN Comtrade import lines for HS-codes 842420 and 761699, and shipment releases published by the European Aerosol Federation. Regulatory notes from the U.S. EPA SNAP database and ECHA PFAS restriction drafts helped us size propellant migration. Annual reports of ten leading filling contractors, patent counts through Questel, and price curves in PlasticsEurope resin dashboards completed cost and volume ranges. D&B Hoovers and Dow Jones Factiva supplied financials that anchored producer revenue splits.
These sources illustrate typical volumes, regional mix, and propellant choices; however, they are illustrative only, and many other public and subscription sources were additionally consulted for confirmation and gap closure.
Market-Sizing & Forecasting
A top-down reconstruction of filled-unit flows from production, trade, and fill-line utilization data establishes the demand pool. Then, selective bottom-up checks, sampled average selling price multiplied by can volumes and supplier revenue read-throughs, verify totals. Key variables include aerosol output per capita, propellant cost inflation, aluminum can conversion ratios, regulatory phase-out timetables, and brand SKU proliferation. Multivariate regression combined with scenario analysis projects these drivers to 2030. Where bottom-up datapoints are thin, we interpolate using historical elasticity observed in prior propellant bans before adjusting through expert consensus.
Data Validation & Update Cycle
Outputs run through variance checks against third-party shipment audits and quarterly earnings signals; anomalies trigger analyst re-contact. Two levels of internal peer review precede sign-off. The model refreshes each year, with interim amendments after material rule changes or supply disruptions, ensuring clients always receive a current view.
Why Mordor's Bag-on-valve Technology Baseline Inspires Confident Decision Making
Published estimates often diverge because firms mix empty-component sales with filled retail packs, choose different container cut-offs, or refresh data on uneven cadences.
Key gap drivers include scope breadth (some studies fold all aerosol formats), currency conversion timing, and untested propellant-price assumptions; by contrast, Mordor's baseline aligns strictly to BOV units, applies rolling 12-month FX averages, and vets every driver with industry interviews before finalizing figures.
Benchmark comparison
| Market Size | Anonymized source | Primary gap driver |
|---|---|---|
| USD 567.6 Mn | Mordor Intelligence | - |
| USD 8.18 Bn | Global Consultancy A | Combines BOV with entire aerosol packaging, relies on vendor revenue roll-ups, limited primary validation |
| USD 466.3 Mn | Trade Journal B | Excludes plastic cans and Asia-Pacific contract filling, derives volumes from capacity nameplates rather than actual runs |
Taken together, the comparison shows that while some publishers over-aggregate and others under-scope, Mordor's disciplined variable selection and yearly review deliver a balanced, reproducible baseline that decision-makers can trust.


Key Questions Answered in the Report
What is driving the Bag-On-Valve Technology market after 2025?
Rapid regulatory moves against HFC propellants and consumer demand for eco-friendly, preservative-free products raise adoption across personal-care, food and pharmaceutical channels.
How large is the Bag-On-Valve Technology market size today?
The Bag-On-Valve Technology market size stands at USD 587.25 million in 2026 and is forecast to reach USD 696.04 million by 2031.
Which end-use industry will grow the fastest by 2031?
The food & beverages segment is projected to record a 8.74% CAGR, the quickest pace among all industries examined.
Why do brands prefer aluminum containers in BOV applications?
Aluminum offers superior barrier properties, infinite recyclability and alignment with circular-economy mandates, securing 47.94% market share in 2025.
What are the main technical restraints facing the technology?
Handling of very viscous formulas, regulatory complexity in pharmaceuticals and higher unit costs compared with conventional valves present notable barriers.
Which region shows the strongest future growth?
Asia-Pacific leads with an 8.32% CAGR to 2031, driven by regulatory harmonization, rising middle-class spending and expanding local manufacturing capacity.
Page last updated on:


