Car Wash Market Size and Share
Market Overview
| Study Period | 2019 - 2031 |
|---|---|
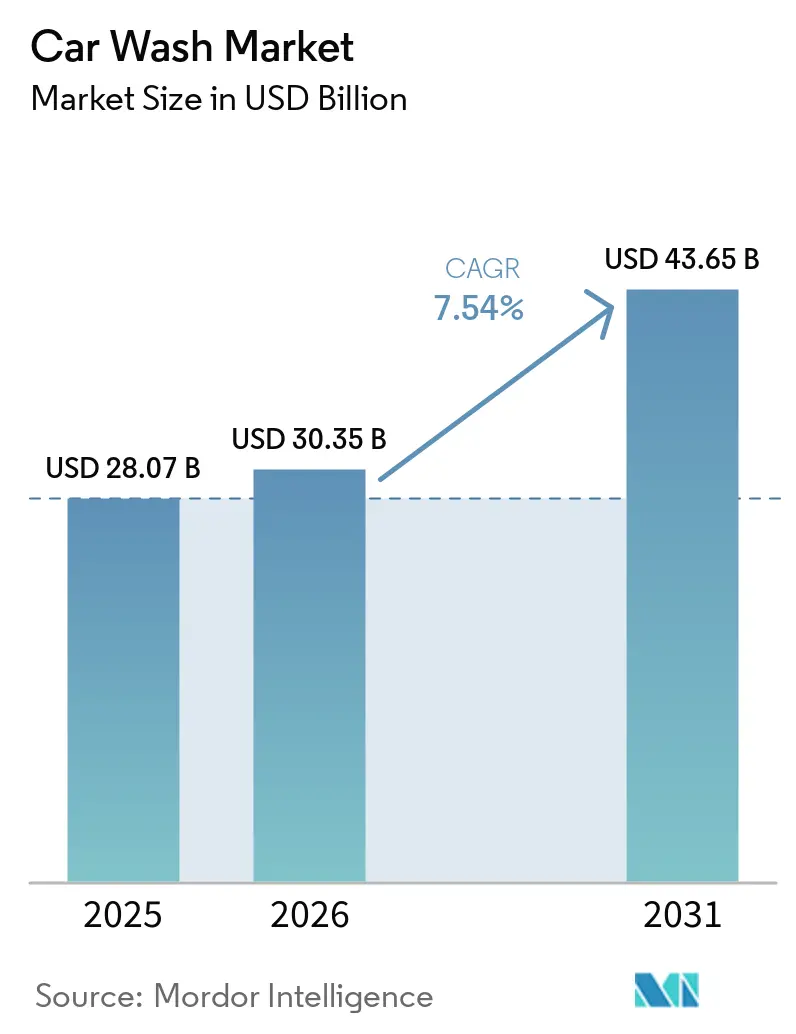
| Market Size (2026) | USD 30.35 Billion |
| Market Size (2031) | USD 43.65 Billion |
| Growth Rate (2026 - 2031) | 7.54% CAGR |
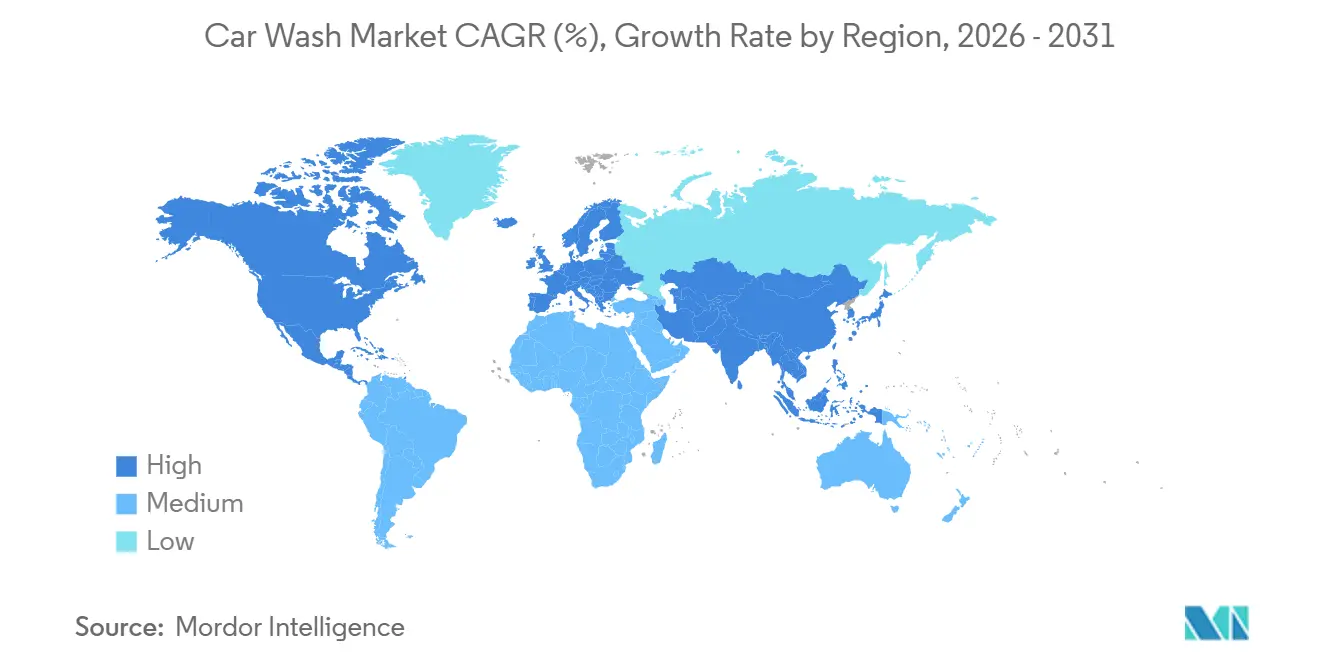
| Fastest Growing Market | Asia Pacific |
| Largest Market | North America |
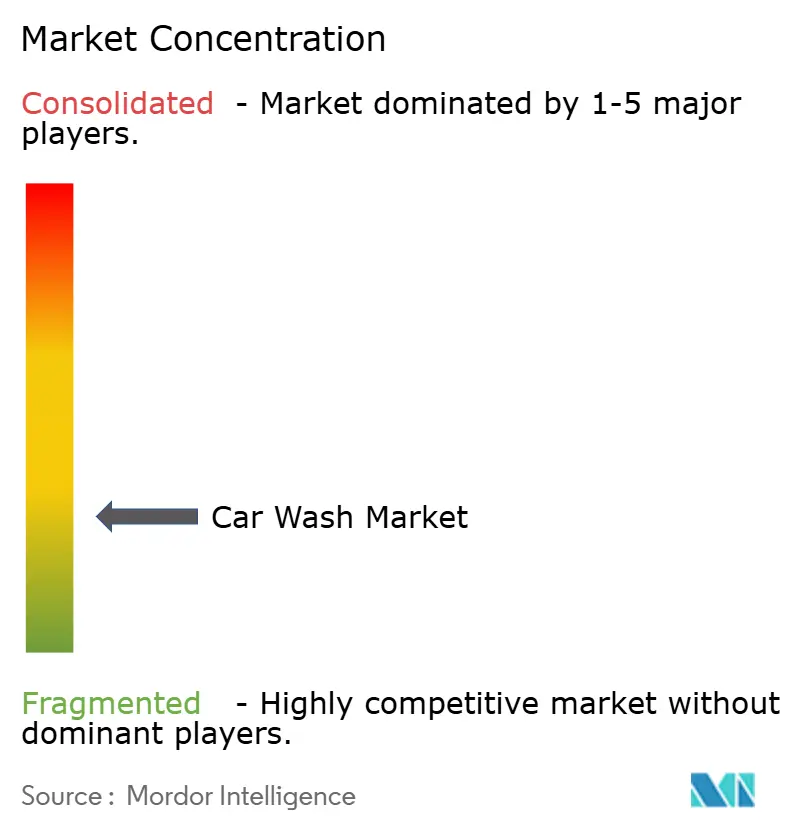
| Market Concentration | Low |
Major Players *Disclaimer: Major Players sorted in no particular order Image © Mordor Intelligence. Reuse requires attribution under CC BY 4.0. | |
Car Wash Market Analysis by Mordor Intelligence
The car wash market size is expected to grow from USD 28.07 billion in 2025 to USD 30.35 billion in 2026 and is forecast to reach USD 43.65 billion by 2031, advancing at a 7.54% CAGR during the forecast period (2026-2031). Subscription-based programs, cashless payments, and express exterior formats are reshaping value creation, while franchised chains leverage private-equity backing to consolidate fragmented assets. Recurring-revenue models boost member lifetime value above USD 440, license plate recognition (LPR) delivers 98% read rates, and water-recycling systems trim operating expenses in drought-prone regions. Competitive pressure has intensified as scale players pair technology with environmental compliance, though soaring land prices and labor turnover continue to weigh on margins. The Asia-Pacific region now offers the fastest incremental growth as urbanization boosts vehicle ownership and the modernization of coin-wash services unlocks latent demand.
Key Report Takeaways
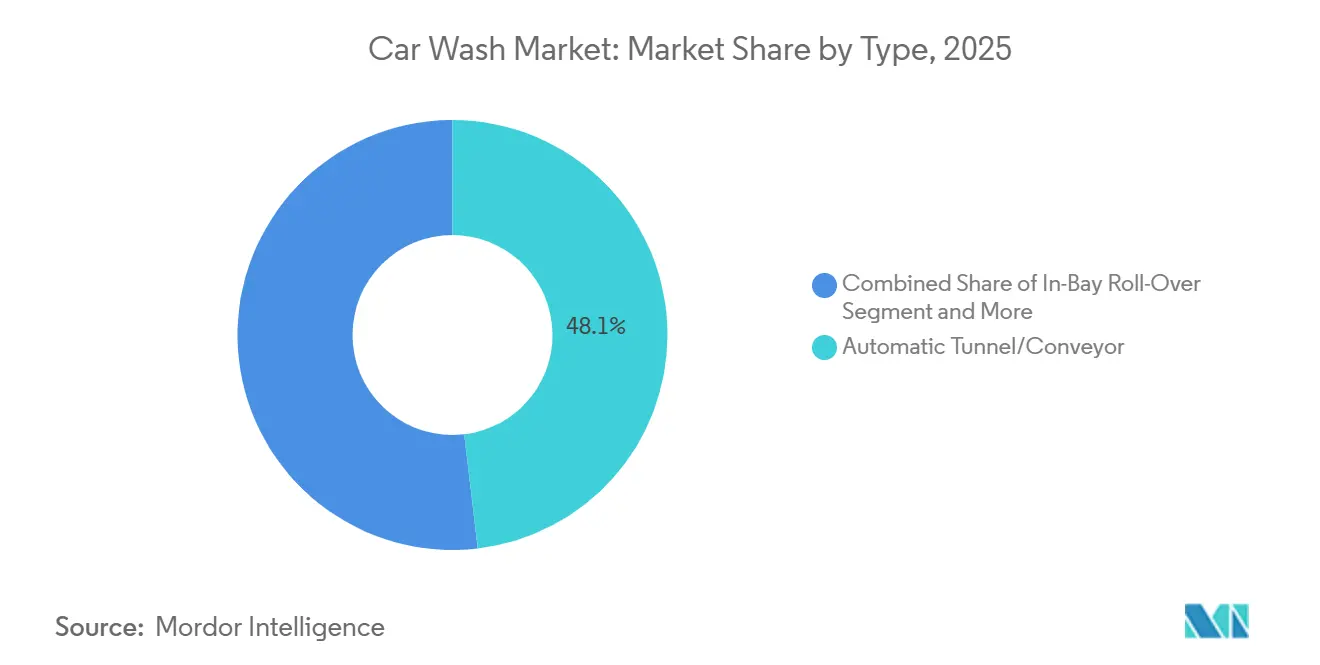
- By type, automatic tunnel and conveyor systems accounted for 48.12% of the car wash market share in 2025, while express-exterior formats are projected to log the fastest 8.27% CAGR through 2031.
- By mode of payment, cashless solutions accounted for 63.23% of the car wash market share in 2025, and in-app or LPR-linked payments are projected to grow at an 11.84% CAGR to 2031.
- By service model, single-service visits accounted for 55.78% of the car wash market share in 2025, whereas subscription plans are projected to advance at a 10.42% CAGR through 2031.
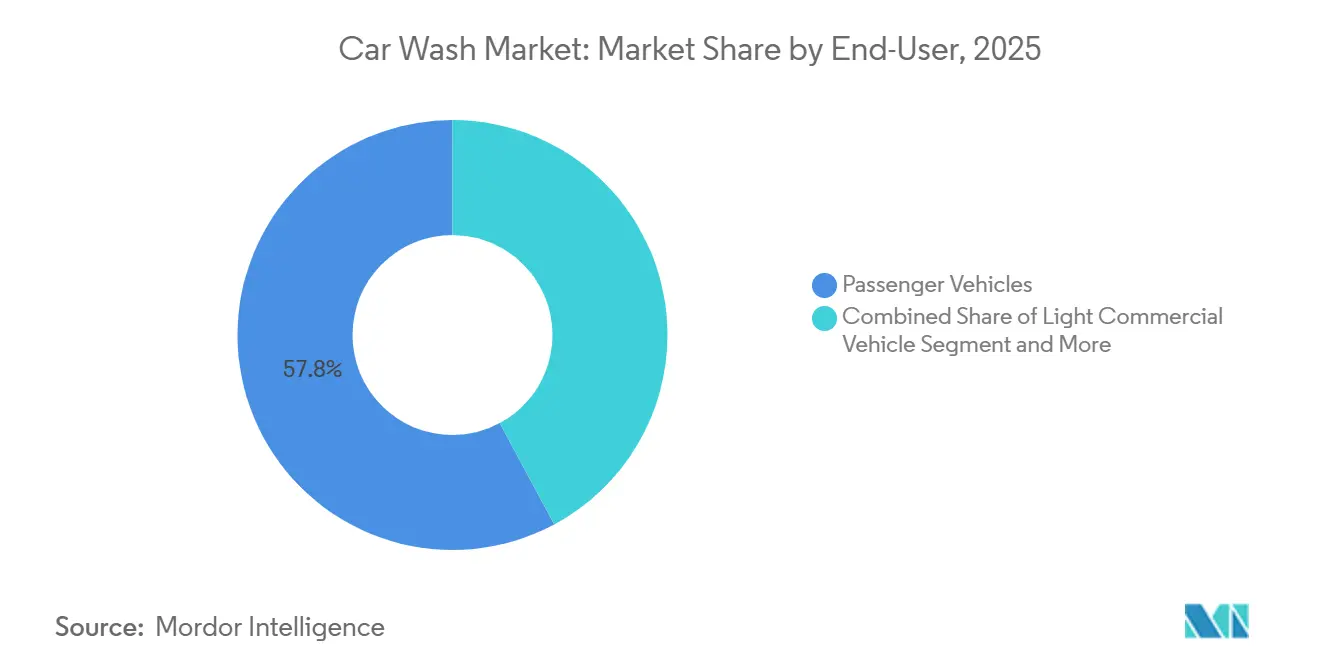
- By end-user, passenger vehicles accounted for 57.84% of the car wash market share in 2025; commercial fleets are projected to pace ahead at an 8.21% CAGR through 2031.
- By ownership, independent operators controlled 67.14% of the car wash market share in 2025, yet franchised and chain formats are expanding at a 9.42% CAGR through 2031.
- By geography, North America led the car wash market with a 40.76% share in 2025, while Asia-Pacific is forecast to record the fastest growth at an 8.43% CAGR through 2031.
Note: Market size and forecast figures in this report are generated using Mordor Intelligence’s proprietary estimation framework, updated with the latest available data and insights as of January 2026.
Global Car Wash Market Trends and Insights
Drivers Impact Analysis*
| Driver | (~) % Impact on CAGR Forecast | Geographic Relevance | Impact Timeline |
|---|---|---|---|
| Subscription-Based Unlimited Wash Programs | +1.5% | Global, with North America leading adoption | Medium term (2-4 years) |
| Rising Fleet and Ride-Hailing Vehicle Counts | +1.4% | APAC core, spillover to North America and Europe | Long term (≥ 4 years) |
| Shift to Cashless and In-App Payments | +1.1% | Global, accelerated in developed markets | Short term (≤ 2 years) |
| Express-Exterior Conveyor Format Expansion | +0.9% | North America and Europe, expanding to APAC | Medium term (2-4 years) |
| Water-Recycling and Eco-Compliance Regulations | +0.8% | Global, with California and EU leading requirements | Long term (≥ 4 years) |
| AI-Driven Dynamic Pricing and Upsell Kiosks | +0.6% | North America and developed APAC markets | Medium term (2-4 years) |
| Source: Mordor Intelligence | |||
Growth of Subscription-Based Unlimited Wash Programs
Operators transitioning from episodic ticket sales to membership-based models are turning unpredictable demand into a steady cash flow in the car wash market. Rinsed reported consistent growth in membership revenue, even as walk-in sales experienced a decline. Once customers embraced routine washing, churn rates stabilized at a low level, significantly increasing their lifetime value. Mister Car Wash revealed that club members accounted for a substantial portion of total sales, highlighting the potential dominance of subscriptions in established revenue streams [1]“Mister Car Wash Q1 2024 Form 10-Q,” Mister Car Wash, mistercarwash.com. Furthermore, unlimited plans act as a buffer against weather fluctuations, ensuring consistent revenue even during typically slow winter months, and bolstering the company's capacity for technology-related debt upgrades.
Shift to Cashless and In-App Payments
Cashless transactions have seen significant growth in the car wash market, driven by advancements such as License Plate Recognition (LPR) and Near Field Communication (NFC). These technologies have simplified entry processes, removed the need for kiosks, and enhanced operational efficiency. GO Car Wash has implemented LPR technology with high accuracy, enabling seamless and contactless customer experiences [2]“GO Car Wash Achieves Zero-Touch Throughput,” GO Car Wash, gocarwash.com. Daiwa House Parking’s D-Wash system utilizes artificial intelligence for plate recognition, allowing for instant payment settlements and aiming to expand its presence across multiple locations in Japan. The adoption of cashless systems has proven to reduce theft, minimize the need for cash-handling labor, and enable dynamic pricing strategies that enhance revenue potential by increasing the average ticket size.
Expansion of Express-Exterior Conveyor Formats
Express tunnels process vehicles quickly, typically within a few minutes, and generate higher revenue per square foot compared to full-service facilities in the car wash market. Quick Quack has expanded into new regions, demonstrating its ability to replicate its business model effectively across diverse locations. Spotless Brands has also opened several express locations, highlighting the growing interest from private-equity firms in operational models focused on high throughput. The reduced need for a large workforce in these operations helps alleviate concerns about employee turnover. Meanwhile, wages for attendants in the United States remain competitive, despite the convenience retail sector facing significant challenges, including high employee attrition rates.
Rising Fleet and Ride-Hailing Vehicle Counts
Fleet demand shields utilization from the fluctuations of retail seasons in the car wash market. Amazon has deployed a significant number of electric vans in India and committed substantial investments to expand its zero-emission fleet in Europe, thereby broadening its commercial reach. In Japan, the leasing fleet has experienced steady growth, with maintenance-inclusive contracts directing business to preferred wash providers. Operators that allocate dedicated fleet lanes or provide off-peak access can generate revenue from guaranteed trips while maintaining their retail capacity.
Restraints Impact Analysis*
| Restraint | (~) % Impact on CAGR Forecast | Geographic Relevance | Impact Timeline |
|---|---|---|---|
| Soaring Land and Construction Costs | -1.1% | Global, acute in urban centers | Short term (≤ 2 years) |
| Water-Use Restrictions and Drought Fees | -0.9% | Western US, Australia, water-stressed regions | Medium term (2-4 years) |
| High Staff Turnover in Labor-Tight Markets | -0.8% | North America and developed Europe | Short term (≤ 2 years) |
| Neighborhood Opposition to 24/7 Operations | -0.6% | Suburban US and Canada, select EU markets | Long term (≥ 4 years) |
| Source: Mordor Intelligence | |||
Soaring Land and Construction Costs
Site budgets have significantly increased, extending payback cycles and driving a rise in sale-leaseback transactions. Mister Car Wash has utilized these transactions to secure funding for license plate recognition systems and other upgrades. Lengthy permitting processes have significantly extended build timelines in major metropolitan areas, reducing the net present value of projects and encouraging developers to shift their focus to secondary markets, where land prices are substantially lower. The increase in capital expenditures has raised entry barriers for independent operators, further accelerating private equity firms' market consolidation.
Municipal Water-Use Restrictions and Drought Fees
California has mandated that new sites must recycle a significant portion of their water [3]“State Water Recycling Mandates,” State of California, ca.gov. In Texas, Stage 3 regulations prohibit the use of non-recirculating washes, putting older tunnel systems at risk of being shut down. The San Antonio Water System imposes penalties for non-compliance, which is driving the adoption of water reclaim systems. Basic reclaim installations require a considerable investment, while advanced biological units demand even higher costs, creating financial challenges for smaller operators. Meanwhile, early adopters are ensuring regulatory compliance and utilizing sustainability-focused messaging to attract environmentally-conscious drivers.
*Our forecasts treat driver/restraint impacts as directional, not additive. The impact forecasts reflect baseline growth, mix effects, and variable interactions.
Segment Analysis
By Type: Express-Exterior Formats Reshape Throughput Economics
Automatic tunnels controlled 48.12% of the car wash market share in 2025; however, express-exterior sites are advancing at an 8.27% CAGR by streamlining cycle times and reducing labor intensity. Quick Quack’s modular blueprint supports rapid greenfield builds, and Autobell’s stick-built or pre-engineered options reduce design overhead. The car wash market size for express formats is set to expand steadily as operators leverage standardized layouts and reinvest labor savings into LPR and reclaim technology.
Express tunnels attract subscribers who value speed over detailed cleaning, with 3-4 washes per month versus 1-2 for pay-per-visit users. Hybrid layouts now pair express exterior service with optional interior upsells, balancing high-volume throughput and revenue-per-vehicle goals. In-bay roll-overs serve gas stations and urban infill where lot depth is limited, while hand-wash and mobile services target niche luxury segments.


By Mode of Payment: Cashless Dominance Enables Frictionless Membership
Cashless methods accounted for 63.23% of the car wash market share in 2025, and their 11.84% CAGR underscores a structural shift away from handling cash. LPR, NFC, and app wallets merge access control and billing, raising the average ticket as add-ons surface during checkout. The car wash market size tied to app-based subscriptions is increasing because recurring billing requires digital rails.
Cash transactions persist in some self-service bays, while app enrollment increases as consumers adopt contactless behavior post-pandemic. Independent operators must bridge technology gaps or risk attrition to franchised chains, which offer seamless entry. Rich usage telemetry also informs marketing spend, staffing, and site selection, giving data-driven operators a widening edge within the car wash market.
By Service Model: Subscriptions Stabilize Revenue Across Weather Cycles
Single-service tickets still held 55.78% of the car wash market share in 2025, but unlimited plans are growing at 10.42% through 2031, as operators prioritize predictable income. Rinsed data show a lifetime value of over USD 440, with churn below 8%, supporting debt-funded expansion. The car wash market share for subscription plans is therefore set to climb as member penetration deepens.
Frequent washes shift competitive focus from per-visit pricing to perceived convenience. Apps trigger retention nudges when usage drops, support vacation pauses, and offer premium-tier upgrades. Full-service interior and detailing remains a high-ticket niche but suffers from labor tightness; many chains now price it as an add-on instead of a core format, improving margin consistency.
By End-User: Fleet Partnerships Complement Passenger-Vehicle Volume
Passenger vehicles accounted for 57.84% of the car wash market share in 2025; however, commercial fleets—from ride-hailing cars to electric delivery vans—are projected to grow at an 8.21% CAGR through 2031. Amazon’s electrified fleets in India, Europe, and Japan, along with millions of leased units, create predictable, contract-based throughput. The car wash market for fleet washing is poised to expand as operators install dedicated lanes and offer after-hours access.
Medium- and heavy-duty vehicles need larger bays and stronger equipment, but they command premium pricing and secured schedules. China’s 19.61 million used-car transactions in 2024 expand the addressable parc, increasing ancillary wash demand. EV owners expect sensor-safe cleaning and bundled service ecosystems, encouraging wash operators to partner with automakers and mobility platforms.
By Ownership: Franchised Chains Leverage Scale Over Independents
Independents still control 67.14% of the car wash market share in 2025, but franchised and chain platforms are advancing at a 9.42% CAGR through 2031. Driven Brands has redirected investments from its oil-change properties to focus on car wash assets. At the same time, Mammoth Holdings and Boyne Capital have implemented roll-up strategies to expand their presence across various banners. The car wash industry is witnessing larger players leveraging their scale to secure bulk equipment purchases, streamline marketing efforts, and utilize shared IT resources. This shift is gradually reducing the cost advantages traditionally held by single-site owners.
Challenges related to debt continue to serve as a cautionary example. Zips Car Wash, through a restructuring process, addressed significant liabilities, highlighting the risks of aggressive leveraging without a strong subscription base. Independent operators that remain in the market are differentiating themselves by offering hyper-local services, hand-wash detailing, or expertise in classic cars. However, they are also required to invest in license plate recognition and water reclaim systems to ensure compliance and maintain their relevance in the evolving market.
Geography Analysis
North America retained 40.76% of the car wash market share in 2025, sustained by dense chain networks, high vehicle ownership, and club penetration. However, elevated land values and drought conditions in California, Texas, and Arizona require capital-intensive water recycling, which poses challenges for small operators. Private-equity platforms, such as Boyne Capital, continue to consolidate second-tier markets, while Canada faces seasonal swings that necessitate winter membership pauses to defend retention.
The Asia-Pacific region is expected to register the fastest CAGR of 8.43% through 2031, as urban households adopt paid laundry services rather than rely on declining gas-station bays. China’s rise in used-car trading expands the total vehicle base, and EV owners prefer transparent, app-linked services that many local independents lack. Japan is modernizing coin-op sites with pure-water rinses and AI payment, while India’s expanding middle class and Amazon’s electric vans boost demand for fleet-compatible tunnels. Water-scarce Australia mirrors the United States' Southwest compliance pressures, further amplifying the appeal of high-efficiency reclaimed water equipment.
Europe, South America, and the Middle East & Africa round out the car wash market. Germany, the United Kingdom, and France are rapidly adopting automated tunnels and cashless payments, whereas Eastern Europe remains fragmented. Brazil and Argentina offer long-run growth tied to urbanization, but currency volatility complicates financing. The Gulf states benefit from year-round operations, yet they face acute water scarcity that necessitates full-cycle reuse from project launch. Early movers who secure compliant infrastructure and prime land can solidify their position before PE-backed entrants expand internationally.
Mordor Intelligence provides coverage of the car wash market across other key regional markets, including Europe, North America, Middle East, and Asia Pacific, each with their regulatory frameworks and demand patterns.

Competitive Landscape
While the car wash market remains fragmented, capital-rich chains are making significant strides. Quick Quack recently secured a substantial investment from KKR, aiming to bolster its multi-state expansion and advance its patent-backed anti-collision technology. Driven Brands is reshuffling its portfolio, indicating a strategic pivot towards higher-margin wash assets. Meanwhile, despite a notable decline in overall merger and acquisition activity, players such as Mammoth Holdings, Boyne Capital, and Red Dog Equity remain undeterred and continue their aggressive acquisition pursuits.
Technology suppliers are also reshaping the competitive landscape. Innovations such as AI-driven kiosks, dynamic pricing engines, and sensor-optimized chemistries empower operators to enhance gross margins, even amid wage pressures. As municipalities tighten water-use regulations, environmental credentials become a valuable marketing asset. Kärcher’s reclaim systems boast significant water savings, while ISTOBAL’s biological solutions achieve impressive recovery rates. Distressed assets, exemplified by Zips, emerge as prime targets for financially robust buyers, signaling a tightening market landscape in the years to come.
Car Wash Industry Leaders
Mister Car Wash
Splash Car Wash
Driven Brands
Zips Car Wash
Quick Quack Car Wash
- *Disclaimer: Major Players sorted in no particular order

Recent Industry Developments
- May 2025: Tommy's Express Car Wash unveiled four new locations across the United States, marking a significant expansion. The newly established sites are in Visalia, California; Norfolk, Virginia; Omaha, Nebraska; and Dayton, Ohio.
- April 2025: Whistle Express acquired Take 5 Car Wash, boosting its network to over 530 locations across 23 states and solidifying its position as the largest express car wash company in the United States.
- February 2025: Driven Brands finalized an agreement to sell its United States wash division to Whistle Express for USD 385 million.


Research Methodology Framework and Report Scope
Market Definitions and Key Coverage
Our study defines the global car wash market as the yearly revenue earned by professional fixed-site and mobile operators that clean passenger and light-duty vehicles through tunnel, roll-over, in-bay, and self-service formats, including single-visit tickets and membership fees.
Scope exclusion: Heavy truck washes, detailing-only boutiques, chemicals, and equipment sales fall outside this assessment.
Segmentation Overview
- By Type
- Automatic Tunnel
- In-Bay Roll-Over
- Self-Service Bay
- Express Exterior
- Mobile / Hand Wash
- By Mode of Payment
- Cash
- Cashless (Card / NFC)
- Subscription / Membership App
- By Service Model
- Single-Service Wash
- Full-Service (Wash + Detailing)
- Subscription-Based Unlimited
- By End-User
- Passenger Vehicles
- Light Commercial Vehicles
- Medium and Heavy Commercial Vehicles
- By Ownership
- Independent Operators
- Franchised / Chain Operators
- By Geography
- North America
- United States
- Canada
- Rest of North America
- South America
- Brazil
- Argentina
- Rest of South America
- Europe
- Germany
- United Kingdom
- France
- Italy
- Spain
- Russia
- Rest of Europe
- Asia-Pacific
- China
- India
- Japan
- South Korea
- Australia
- Rest of Asia-Pacific
- Middle East and Africa
- United Arab Emirates
- Saudi Arabia
- Turkey
- South Africa
- Egypt
- Nigeria
- Rest of Middle East and Africa
- North America
Detailed Research Methodology and Data Validation
Primary Research
We complemented desk work with interviews of chain executives, single-site owners, equipment distributors, and water-recycling technology vendors across North America, Europe, and Asia Pacific. These conversations let Mordor analysts validate ticket prices, membership uptake, outlet throughput, and regulatory friction, closing gaps that secondary data could not address.
Desk Research
We began with a broad scan of freely available data, then filtered what matters. Public sources such as the International Carwash Association wash counts, U.S. Bureau of Labor Statistics service revenues, Eurostat vehicle parc, and environmental agency water-use filings helped set the commercial context. Trade publications like Auto Laundry News and regional transport ministries' car registrations sharpened geography splits, while D&B Hoovers and Dow Jones Factiva supplied operator financials that grounded pricing and outlet economics. This list is illustrative, and many other open records were reviewed for cross-checks.
Market-Sizing & Forecasting
We built a top-down model starting with registered vehicle stock by country, applied average annual washes per vehicle and prevailing ticket prices, then adjusted for professional wash penetration. Outlet roll-ups and sampled average selling price times volume checks provided a bottom-up sense check before figures were locked. Key variables tracked include vehicle parc growth, subscription membership share, new express-tunnel openings, water tariffs, consumer disposable income, and weather normalization factors. A multivariate regression, calibrated with historic wash revenues and the six drivers above, projects values through 2030.
Data Validation & Update Cycle
Our outputs pass three layers of scrutiny: variance screens versus trade statistics, peer review within the analyst team, and a final senior sign-off. Models refresh each year, with interim updates triggered when material events such as a large chain bankruptcy or a sudden tariff shift occur and alter demand assumptions.
Why Mordor's Car Wash Baseline Commands Reliability
We recognize that published estimates often diverge because companies draw the borders of the market in their own way.
Key gap drivers include wider service bundles in competitor scopes, reliance on unverified consumer spending surveys, slower refresh cadences, and differing currency conversion dates.
Benchmark comparison
| Market Size | Anonymized source | Primary gap driver |
|---|---|---|
| USD 28.22 B | Mordor Intelligence | |
| USD 36.29 B | Global Consultancy A | Bundles detailing products and accessory retail, minimal primary validation |
| USD 35.19 B | Industry Association B | Adds heavy-vehicle washes, biennial updates rely on spending surveys |
The simple takeaway is that Mordor's focused scope, live primary checks, and yearly refresh give decision-makers a balanced, transparent baseline they can trust.


Key Questions Answered in the Report
What share did cashless payments hold in 2025?
Cashless transactions represented 63.23% of 2025 volume and are on an 11.84% CAGR trajectory.
Which geographic region is expanding the quickest?
Asia-Pacific leads with an 8.43% CAGR thanks to urbanization and rising vehicle ownership.
What is the biggest regulatory hurdle for operators?
Strict water-use rules in California, Texas, and similar regions make water-recycling systems mandatory for new or upgraded sites.
How are private-equity firms influencing the sector?
PE-backed platforms are consolidating fragmented assets, deploying technology, and driving subscription adoption to widen margins.
Page last updated on:


