Automotive Powertrain Systems Market Size and Share
Market Overview
| Study Period | 2020 - 2031 |
|---|---|
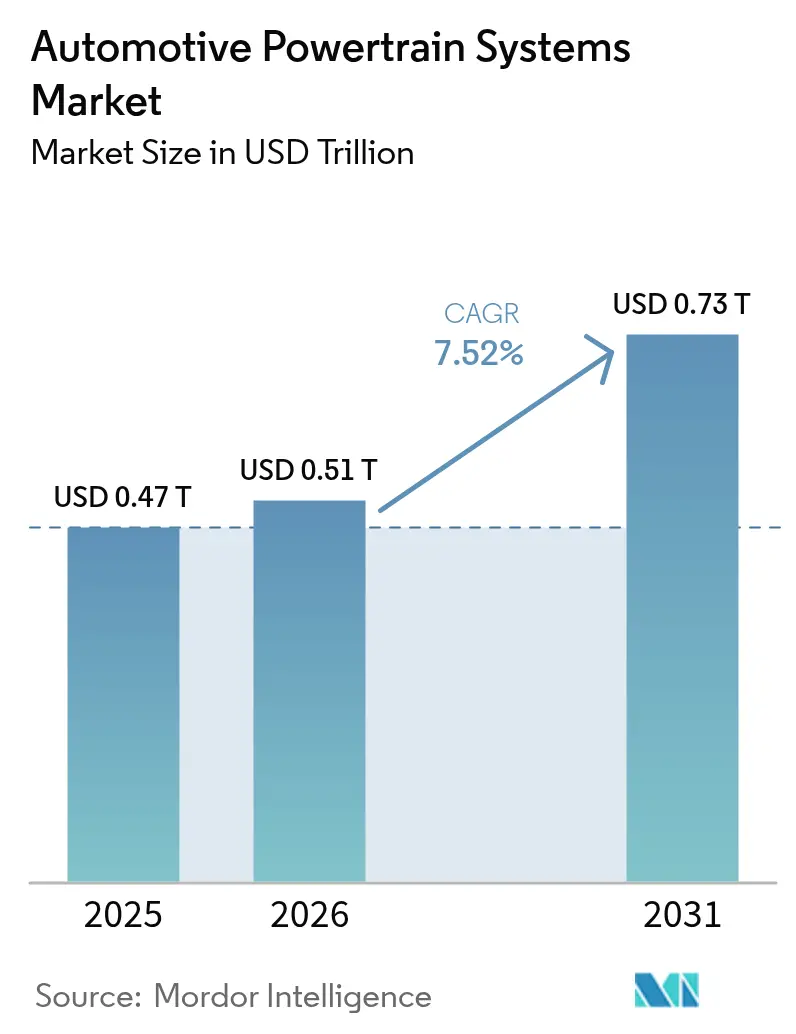
| Market Size (2026) | USD 0.51 Trillion |
| Market Size (2031) | USD 0.73 Trillion |
| Growth Rate (2026 - 2031) | 7.52% CAGR |
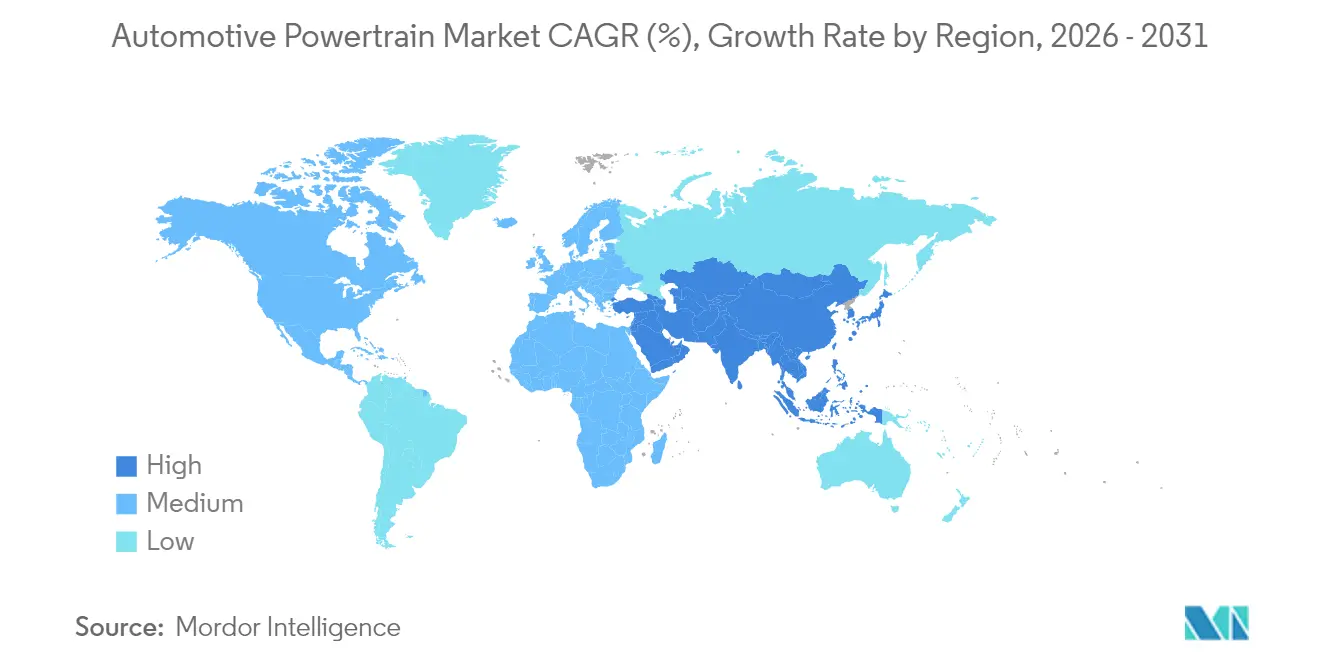
| Fastest Growing Market | Asia Pacific |
| Largest Market | Asia Pacific |
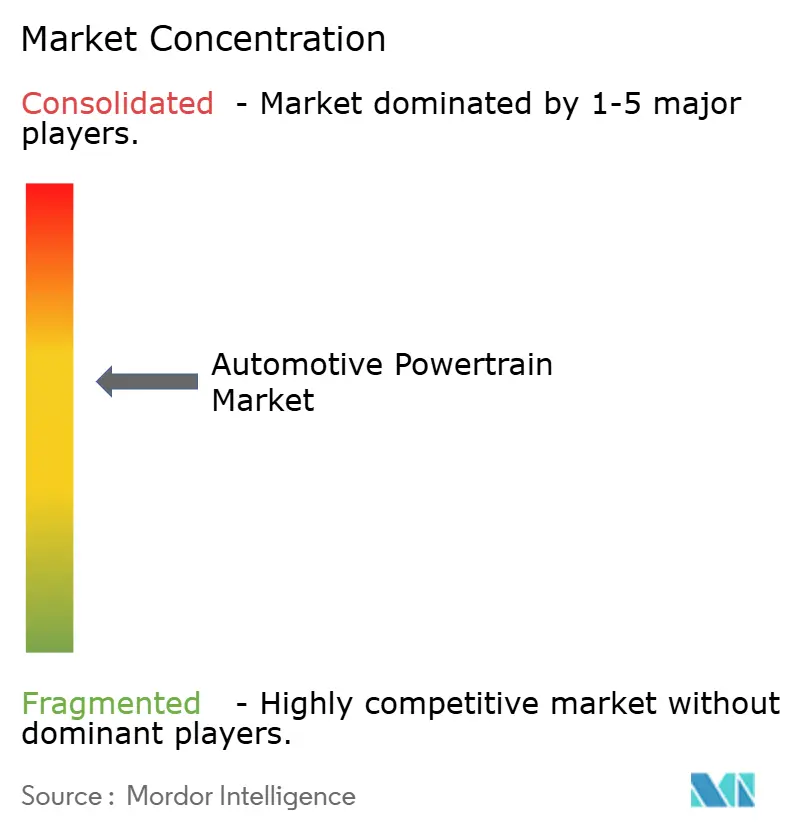
| Market Concentration | Medium |
Major Players *Disclaimer: Major Players sorted in no particular order Image © Mordor Intelligence. Reuse requires attribution under CC BY 4.0. | |
Automotive Powertrain Systems Market Analysis by Mordor Intelligence
The automotive powertrain systems market size is expected to grow from USD 0.47 trillion in 2025 to USD 0.51 trillion in 2026 and is forecast to reach USD 0.73 trillion by 2031 at 7.52% CAGR over 2026-2031. This expansion stems from tightening emissions rules, the rapid decline in battery costs, and a pronounced shift by automakers toward dedicated electric platforms. Even though internal-combustion engines (ICEs) retain considerable scale advantages, their technology roadmap now focuses on efficiency tweaks rather than breakthrough innovation, while electric powertrains absorb the bulk of new capital outlays. Suppliers are coping with shorter product cycles, a higher software content per unit, and volatile raw-material prices that disproportionately impact battery-centric designs. Competitive intensity is sharpening as OEMs vertically integrate e-axles and control software, squeezing traditional Tier-1 margins and spurring alliances among smaller specialists.
Key Report Takeaways
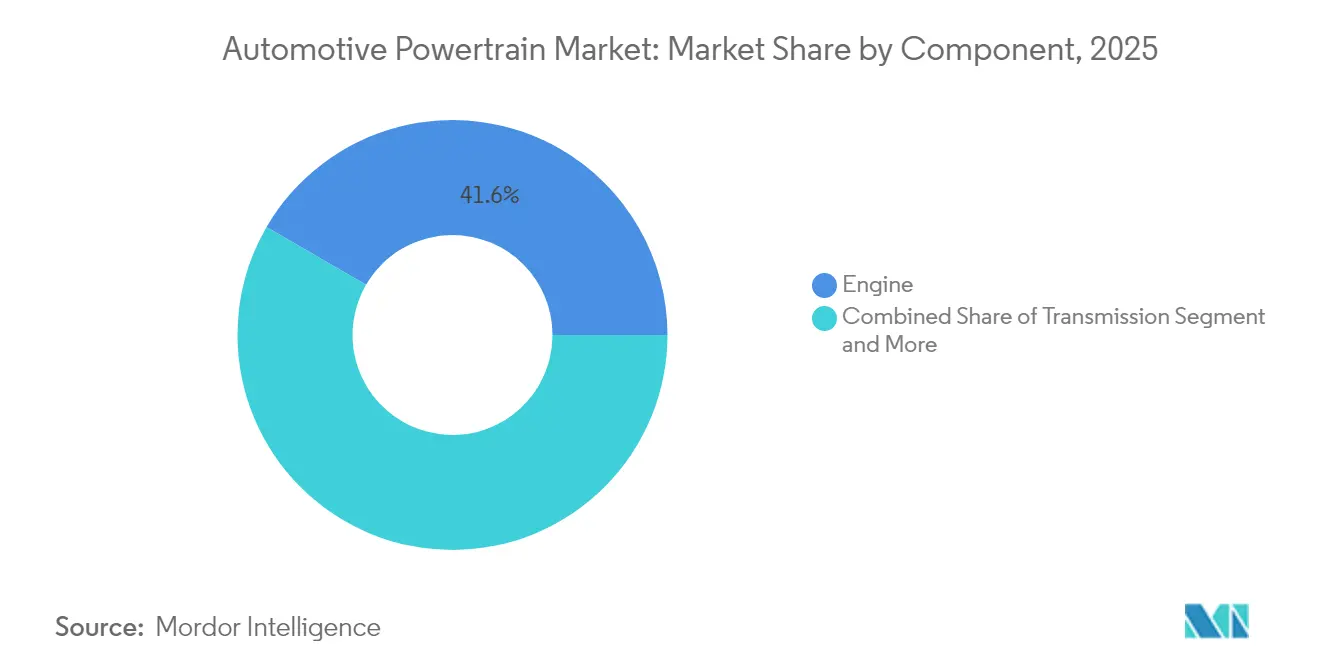
- By component, engines commanded 41.63% of the automotive powertrain systems market size in 2025, whereas the “Others” basket—chiefly e-drive units—will rise at a 9.43% CAGR over 2026-2031.
- By propulsion type, internal-combustion engines held 78.28% of the automotive powertrain systems market share in 2025; electric powertrains are projected to expand at a 10.18% CAGR through 2031.
- By drive type, front-wheel drive led with a 46.78% slice of 2025 revenue, while all-wheel drive systems show the highest 8.23% CAGR to 2031.
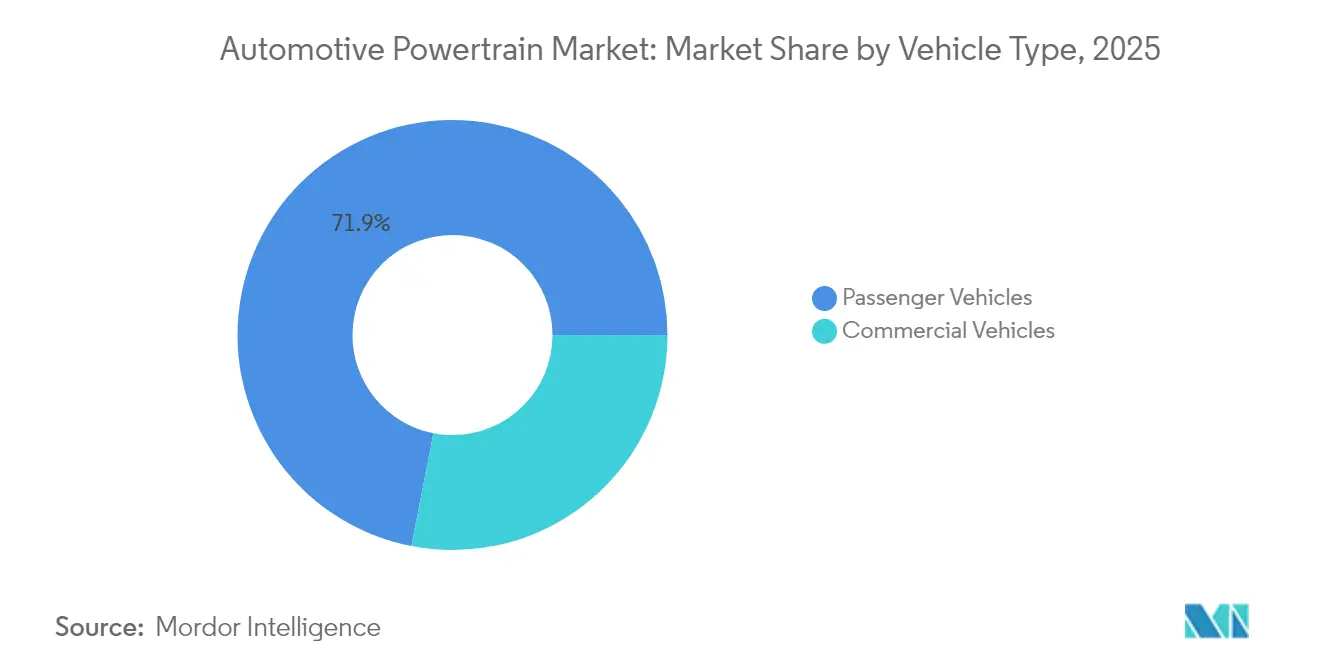
- By vehicle type, passenger vehicles accounted for a 71.94% share of 2025 sales and will register an 8.61% CAGR through 2031.
- By sales channel, OEM routes generated 86.88% of 2025 demand, yet the aftermarket is poised for a 8.79% CAGR thanks to AI-enabled predictive-maintenance services.
- By geography, Asia-Pacific captured 48.86% of 2025 revenue, while the same region is forecast to post the fastest 7.94% CAGR to 2031.
Note: Market size and forecast figures in this report are generated using Mordor Intelligence’s proprietary estimation framework, updated with the latest available data and insights as of 2026.
Global Automotive Powertrain Systems Market Trends and Insights
Drivers Impact Analysis*
| Driver | (~) % Impact on CAGR Forecast | Geographic Relevance | Impact Timeline |
|---|---|---|---|
| Rapid Battery-Cost Decline | +2.1% | Asia-Pacific core, spill-over to North America and the EU | Short term (≤ 2 years) |
| Tightening Global CO2 Rules | +1.8% | Global, led by the EU and China | Medium term (2-4 years) |
| OEM Shift to EV Platforms | +1.5% | Global, clustered in major auto hubs | Medium term (2-4 years) |
| Commercial Fleet Electrification | +1.2% | North America and the EU, spreading to Asia-Pacific cities | Long term (≥ 4 years) |
| Emergence of Sodium-Ion | +0.9% | Asia-Pacific core, chiefly China and India | Medium term (2-4 years) |
| AI-Driven Predictive Maintenance | +0.8% | Global, with early uptake in developed markets | Short term (≤ 2 years) |
| Source: Mordor Intelligence | |||
Rapid Battery-Cost Decline Enabling Affordable E-Powertrains
In 2024, average battery pack prices experienced a significant decline compared to earlier levels. Projections suggest prices will continue to decrease in the coming years. Scale advantages at plants operated by CATL and BYD, plus lithium-iron-phosphate chemistries that deliver near-par energy density at lower cost, help battery-electric vehicles (BEVs) undercut ICE total-cost-of-ownership earlier than forecast. Lower pack prices enable high-voltage, bi-directional charging designs that create new revenue streams for fleet operators who can resell stored energy to the grid. Commercial BEV payback periods now fall inside three years on high-utilization city routes, speeding fleet conversion.
Tightening Global CO₂ and Fuel-Economy Regulations
Regulators in Europe, China, and select states in the United States are enforcing stricter fleet-average CO₂ caps that push automakers to mainstream electric powertrains. The Euro 7 framework imposes fines for CO₂ on every vehicle an OEM registers, making non-compliance financially untenable [1]“CO₂ Emission Performance Standards for Cars and Vans,” European Commission, ec.europa.eu. China’s dual-credit scheme requires a notable share of electric or hybrid sales by 2030 and ties license-plate quotas to progress, accelerating powertrain shifts among domestic brands. California’s Advanced Clean Cars II program extends zero-emission targets to medium-duty trucks, compelling fleet operators to re-evaluate asset lifecycles. These converging rules shrink the addressable market for future ICE launches and compel suppliers to retool for high-volume e-axle production.
OEM Pivot to Dedicated EV Platforms and In-House E-Axles (Scale Economics)
Global brands are abandoning multi-energy “skateboards” in favor of purpose-built EV architectures. General Motors’ Ultium and Volkswagen’s MEB each receive significant investment in combined tooling and supplier re-qualification outlays. Dedicated layouts free designers from legacy tunnel and firewall constraints, cut wiring complexity, and allow battery packs to become structural elements. Automakers such as Ford now build e-axles internally, re-shaping make-versus-buy decisions and shifting significant cost of content per vehicle away from external Tier-1 suppliers. The trend compresses margins in the traditional supplier base while opening space for niche integrators of software-heavy power electronics.
Commercial-Fleet Electrification Mandates (Last-Mile, HD-Truck Corridors)
Government procurement and zero-emission zones give commercial BEV programs guaranteed volume. London, Paris, and Amsterdam restrict diesel vans during daylight hours, prompting logistics firms to secure charging depots near city centers to maintain service windows. Amazon’s 100,000-unit order with Rivian highlights how large operators leverage scale to lock battery supply and infrastructure concessions, anchoring demand for e-axles through 2030.
Restraint Impact Analysis*
| Restraint | (~) % Impact on CAGR Forecast | Geographic Relevance | Impact Timeline |
|---|---|---|---|
| Critical Mineral Price Swings | −1.4% | Global, the highest exposure in battery-dependent regions | Short term (≤ 2 years) |
| OEM Vertical Integration Squeezing | −0.9% | Global, clustered in legacy automotive hubs | Medium term (2-4 years) |
| Slow Rollout of Charging | −0.7% | North America and the EU, muted effect in Asia-Pacific | Long term (≥ 4 years) |
| Consumer Range Anxiety | −0.6% | Asia-Pacific emerging economies, the Middle East & Africa, and parts of South America | Medium term (2-4 years) |
| Source: Mordor Intelligence | |||
Critical-Mineral Supply-Chain Volatility and Price Swings
Between 2022 and 2024, lithium carbonate prices experienced significant fluctuations. This volatility compelled battery makers to adjust their contracts quarterly, disrupting their cost forecasts. Mining concentration in Chile, Australia, and China, plus a significant Chinese share of refining capacity, exposes OEMs to geopolitical shocks. Ford’s USD 3.5 billion investment in Michigan refining aims to localize a slice of the chain, yet start-up timelines stretch to 2026, limiting short-term relief.
OEM Vertical-Integration Squeezing Tier-1 ICE Suppliers’ Addressable Market
BorgWarner reported a significant revenue slide in legacy engine components as automakers insourced e-axle programs and trimmed ICE options per platform. BEV drivetrains carry one-quarter the moving parts of ICE assemblies, shrinking aftermarket filters, gaskets, and fluids demand. Suppliers scramble to fund acquisitions in power electronics while balancing cash flow from a shrinking ICE base, pressuring free-cash conversion and credit metrics.
*Our forecasts treat driver/restraint impacts as directional, not additive. The impact forecasts reflect baseline growth, mix effects, and variable interactions.
Segment Analysis
By Component: E-Drive Integration Reshapes Traditional Hierarchies
Engines generated the largest slice of the automotive powertrain systems market size with 41.63% share in 2025, as automakers wind down fresh ICE programs. Conversely, the “Others” basket—chiefly final drives and compact e-drive units—will outpace all peers at a 9.43% CAGR through 2031, taking advantage of integrated motor-inverter packages that cut weight and assembly steps. Transmissions cede share because most BEVs require a single reduction gear, although multi-speed boxes gain relevance for 40-ton trucks seeking highway efficiency. Differential suppliers pivot to electronic torque-vectoring modules synced with software controls rather than mechanical, limited-slip clutches .
Lightweight composite drive shafts and embedded vibration sensors turn once-passive parts into data nodes for predictive diagnostics, harmonizing with the AI-maintenance driver outlined earlier. As e-drive uptake scales, Tier-1 firms with both motor winding and power-module competencies win new-business awards, while pure mechanical specialists risk margin erosion. Overall, the component mix migrates toward fewer, higher-value assemblies governed by power-electronics IP rather than machining know-how.


By Propulsion Type: ICE Dominance Masks Electrification Velocity
ICE systems still represent 78.28% of 2025 revenue but might decline significantly by 2031, losing notable percentage points of share annually as BEVs sprint ahead. The electric vehicle segment is projected to expand at a 10.18% CAGR. Battery-electric powertrains achieve notable growth because falling pack costs intersect with punitive emissions penalties.
Plug-in hybrids act as transitional bridges in regions where charging infrastructure lags. Fuel-cell electric vehicles remain niche, limited to heavy-duty fleets along hydrogen corridors in Europe and California. Regional splits persist: China aims to significantly increase the adoption of plug-in vehicles among new cars, whereas India and parts of ASEAN still rely on Euro 6-plus ICE optimizations until public charging density improves.
By Drive Type: AWD Systems Capitalize on Electric Advantages
Front-wheel drive retains leadership with 46.78% share in 2025, propelled by small-car platforms. Yet dual-motor BEVs elevate all-wheel drive to the fastest 8.23% CAGR because software torque vectoring enhances traction without mechanical shafts. Rear-wheel drive enjoys a modest revival in premium sports sedans, where under-floor batteries free the front axle for steering purity.
Electric AWD units integrate inverter, motor, and reduction gear into a sub-75 kg package, unlocking skateboard flexibility and enabling over-the-air performance upgrades that consumers can purchase post-sale. The change shifts value from cast-iron differentials to silicon-carbide MOSFET stacks and firmware algorithms.
By Vehicle Type: Commercial Electrification Accelerates Fleet Transformation
Passenger vehicles account for most unit volume with a 71.94% in 2025, thanks to diverse price points and brand loyalty. Commercial vehicles will post an 8.61% CAGR as delivery-van and city-bus operators seek predictable running costs and urban-access compliance.
Fleets leverage depot charging to achieve notable overnight top-offs using discounted off-peak electricity, achieving fuel savings versus diesel benchmarks. Rising e-bus penetration in India, South America, and Southeast Asia accelerates pack capacity expansion at regional cell-assembly plants, shortening supply chains and reducing tariff exposure.
By Sales Channel: Aftermarket Services Transform Through Digital Integration
OEM sales channels held 86.88% share in 2025, reflecting factory-installed powertrain deliveries. The aftermarket, though smaller, grows at 8.79% as cloud analytics open fee-for-service models. Independent garages purchase subscription access to OEM data lakes, enabling just-in-time part stocking.
For BEVs, revenue centers shift from oil changes to battery health checks, thermal-management retrofits, and software unlocks that raise torque caps. Predictive algorithms cut unplanned downtime, an especially valuable metric for ride-hailing and last-mile fleets.
Geography Analysis
The Asia-Pacific dominated the automotive powertrain systems market with a 48.86% share in 2025 and is expected to maintain an 7.94% CAGR to 2031. China’s dual-credit program and generous EV subsidies spur domestic demand and export expansion, while India’s Faster Adoption and Manufacturing of Electric Vehicles (FAME) incentives extend commercial-vehicle electrification to tier-2 cities. Japan refines hybrid technologies, and South Korea excels in battery innovation, though growth slows relative to China’s surge.
North America registers significant growth, buoyed by the Inflation Reduction Act’s clean-technology credits that encourage localized battery supply chains . Commercial fleets benefit from federal procurement mandates and utility rebates for depot chargers, yet sparse rural infrastructure tempers private BEV adoption. Mexico’s cost-competitive parts plants satisfy domestic-content thresholds, reinforcing regional integration.
Europe leverages the European Green Deal’s 2050 climate neutrality aims to maintain a sizeable piece of the automotive powertrain systems market. Germany’s premium brands channel R&D into 800-volt architectures, while Eastern European nations attract final-assembly lines seeking lower labor expenses. High energy prices and reliance on Asian battery imports challenge economics, but recycling mandates spawn secondary-use and material-recovery ventures that may offset cost headwinds.

Competitive Landscape
The sector exhibits moderate fragmentation. Traditional engine and gearbox leaders—Toyota Industries, Aisin, and ZF—still capture sizeable ICE volumes, yet face secular decline. Bosch, Valeo, and BorgWarner acquire inverter specialists and silicon-carbide start-ups to protect content per vehicle. New entrants such as CATL, BYD, and Foxconn bundle cells, BMS, and e-drives, leveraging consumer-electronics supply-chain agility to undercut legacy pricing.
Tesla’s vertically integrated approach combines motor design, power electronics, and control firmware, enabling over-the-air upgrades that differentiate performance tiers without physical hardware changes. Strategic collaboration intensifies: Magna partners with LG Energy Solution on e-axles, while Stellantis co-invests in solid-state battery ventures to secure next-gen chemistry access.
Regulatory compliance favors scale, prompting M&A among mid-tier specialists lacking the balance-sheet strength for simultaneous ICE optimization and BEV expansion. Software capability emerges as the decisive battleground, with suppliers racing to deploy standardized middleware that orchestrates propulsion, battery, and charging functions across multi-brand portfolios.
Automotive Powertrain Systems Industry Leaders
Robert Bosch GmbH
Denso Corporation
ZF Friedrichshafen AG
Magna International Inc.
Aisin Corporation
- *Disclaimer: Major Players sorted in no particular order

Recent Industry Developments
- August 2025: ZF Group won three contracts in India to supply 440 kW differential-unit test benches and high-capacity tire testing systems.
- April 2025: Hyundai Motor Group began production of a hybrid system pairing a 2.5-liter turbo engine with new electrification tech for the 2025 Palisade SUV.
- October 2024: Tsuyo inaugurated India’s first high-wattage EV powertrain line for commercial trucks, buses, and construction equipment.
- September 2024: HORSE agreed to deliver 12,000 HR10 range-extender engines annually to Brazilian start-up Lecar for flex-fuel EV applications.


Global Automotive Powertrain Systems Market Report Scope
A powertrain is an assembly of every component that pushes a vehicle forward. A car's powertrain creates power from the engine and delivers it to the wheels on the ground. The key components of a powertrain include an engine, transmission, driveshaft, axles, and differential.
The automotive powertrain systems market is segmented by component type (engine, transmission, differentials, and driveshaft), by vehicle type (passenger cars and commercial vehicles), by drive type (front-wheel drive, rear-wheel drive, and all-wheel drive), and by geography (North America, Europe, Asia-Pacific, and Rest of the World).
The report offers market size and forecasts for Automotive Powertrain Systems in terms of value (USD billion) for all the above segments.
| Engine |
| Transmission |
| Differentials |
| Drive Shafts |
| Others (Final Drive, E-Drive Unit) |
| Internal Combustion Engine (ICE) |
| Electric Vehicle (EV) |
| Hybrid (HEV/PHEV) |
| Front-Wheel Drive (FWD) |
| Rear-Wheel Drive (RWD) |
| All-Wheel Drive (AWD) |
| Passenger Vehicles |
| Commercial Vehicles |
| OEM |
| Aftermarket |
| North America | United States |
| Canada | |
| Rest of North America | |
| South America | Brazil |
| Argentina | |
| Rest of South America | |
| Europe | Germany |
| United Kingdom | |
| France | |
| Italy | |
| Spain | |
| Rest of Europe | |
| Asia-Pacific | China |
| India | |
| Japan | |
| South Korea | |
| Rest of Asia-Pacific | |
| Middle East and Africa | United Arab Emirates |
| Saudi Arabia | |
| South Africa | |
| Turkey | |
| Rest of Middle East and Africa |
| By Component | Engine | |
| Transmission | ||
| Differentials | ||
| Drive Shafts | ||
| Others (Final Drive, E-Drive Unit) | ||
| By Propulsion Type | Internal Combustion Engine (ICE) | |
| Electric Vehicle (EV) | ||
| Hybrid (HEV/PHEV) | ||
| By Drive Type | Front-Wheel Drive (FWD) | |
| Rear-Wheel Drive (RWD) | ||
| All-Wheel Drive (AWD) | ||
| By Vehicle Type | Passenger Vehicles | |
| Commercial Vehicles | ||
| By Sales Channel | OEM | |
| Aftermarket | ||
| By Geography | North America | United States |
| Canada | ||
| Rest of North America | ||
| South America | Brazil | |
| Argentina | ||
| Rest of South America | ||
| Europe | Germany | |
| United Kingdom | ||
| France | ||
| Italy | ||
| Spain | ||
| Rest of Europe | ||
| Asia-Pacific | China | |
| India | ||
| Japan | ||
| South Korea | ||
| Rest of Asia-Pacific | ||
| Middle East and Africa | United Arab Emirates | |
| Saudi Arabia | ||
| South Africa | ||
| Turkey | ||
| Rest of Middle East and Africa | ||


Key Questions Answered in the Report
What is the current value of the automotive powertrain market?
The sector stands at USD 0.51 trillion in 2026.
How fast will the market expand through 2031?
Revenue is projected to rise at a 7.52% CAGR, reaching USD 0.73 trillion.
Which region leads both size and growth?
Asia-Pacific holds 48.86% of 2025 revenue and shows the highest 7.94% CAGR.
What component segment grows the quickest?
E-drive units inside the “Others” basket advance at a 9.43% CAGR.
Page last updated on:


