Electric Vehicle Parts And Components Market Size and Share
Market Overview
| Study Period | 2019 - 2031 |
|---|---|
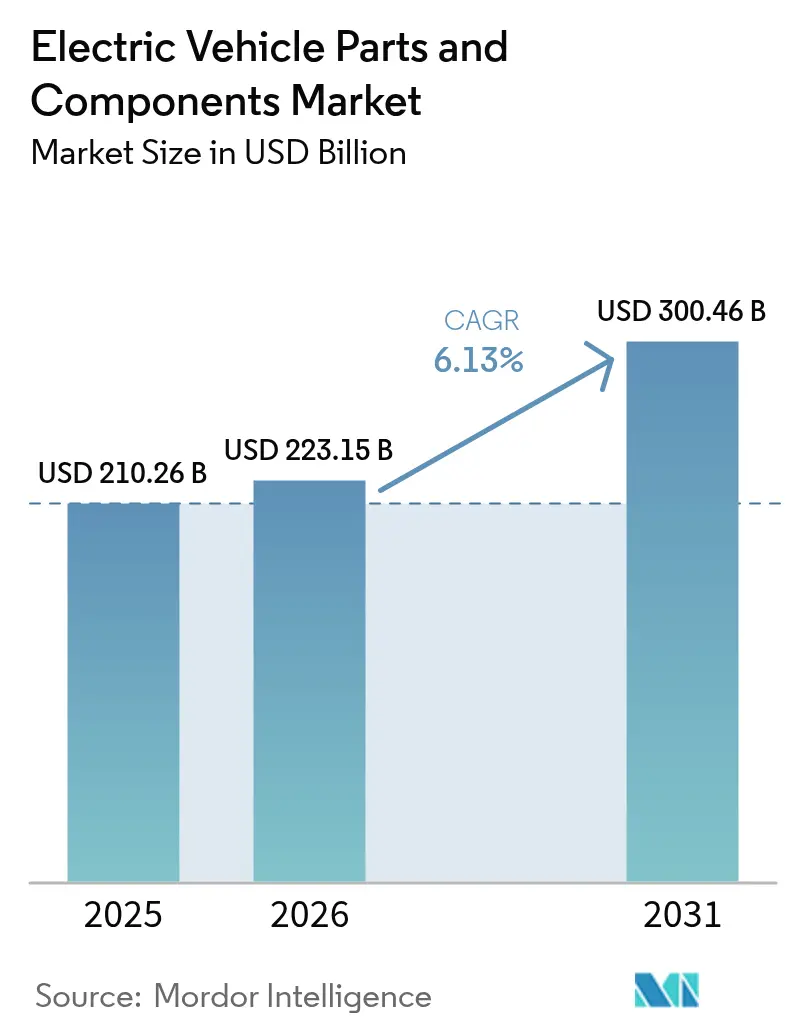
| Market Size (2026) | USD 223.15 Billion |
| Market Size (2031) | USD 300.46 Billion |
| Growth Rate (2026 - 2031) | 6.13% CAGR |
| Fastest Growing Market | Middle East and Africa |
| Largest Market | Asia-Pacific |
| Market Concentration | Medium |
Major Players *Disclaimer: Major Players sorted in no particular order Image © Mordor Intelligence. Reuse requires attribution under CC BY 4.0. | |
Electric Vehicle Parts And Components Market Analysis by Mordor Intelligence
The electric vehicle parts and components market size is projected to be USD 210.26 billion in 2025, USD 223.15 billion in 2026, and reach USD 300.46 billion by 2031, growing at a CAGR of 6.13% from 2026 to 2031. Government mandates for zero-emission vehicles, surging investments in advanced architectures, and the swift expansion of public fast-charging networks are reshaping the landscape of propulsion economics and technological blueprints. Suppliers of power electronics are benefiting from the industry's pivot to silicon-carbide devices, which offer greater value than traditional alternatives. Meanwhile, as battery packs become commoditized, Tier-1 suppliers are shifting focus toward software-defined domain controllers. Original equipment manufacturers (OEMs) are increasingly integrating cells and modules into their offerings. This trend is evident in efforts by leading companies to secure supply chains and enhance profit margins. While the Asia-Pacific region remains the cornerstone of demand, the Middle East and Africa are experiencing the fastest growth, driven by sovereign diversification initiatives that are fueling green mobility projects.
Key Report Takeaways
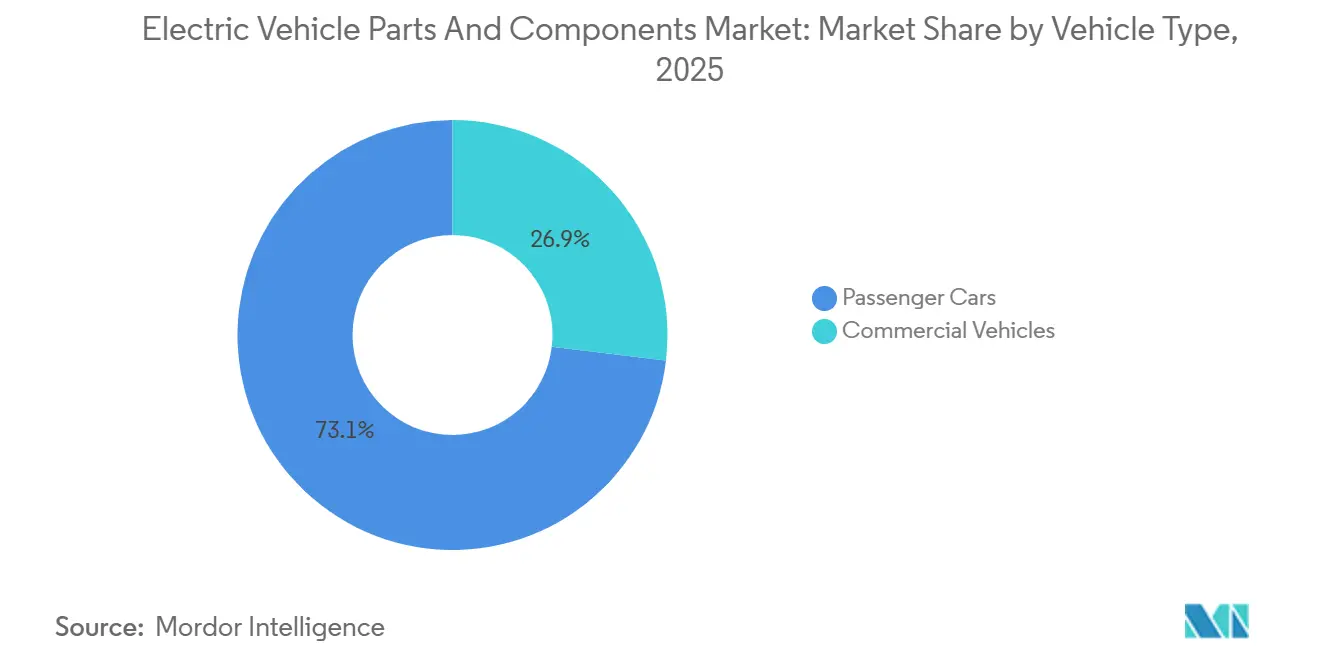
- By vehicle type, passenger cars accounted for 73.11% of the electric vehicle parts and components market share in 2025, while commercial vehicles are advancing at an 8.71% CAGR through 2031.
- By propulsion, battery-electric vehicles captured 62.25% of revenue in 2025; fuel-cell platforms are the fastest-growing at an 8.42% CAGR on maturing hydrogen corridors.
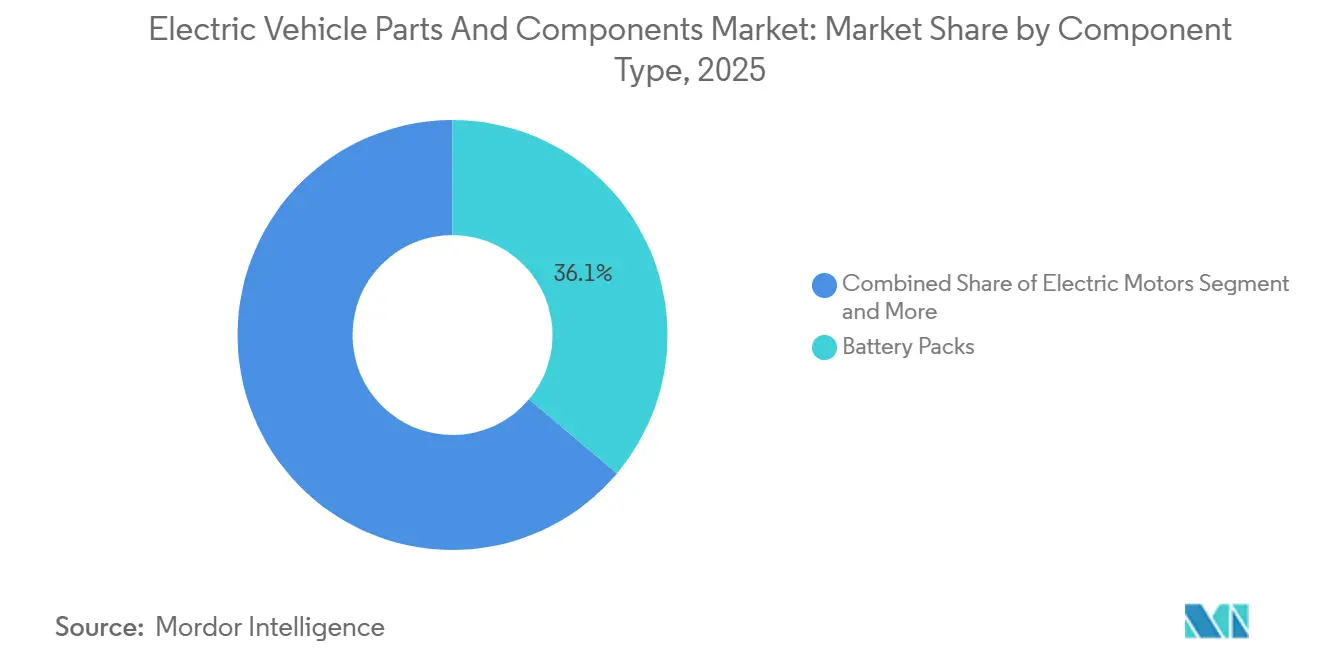
- By component, battery packs commanded 36.13% of the electric vehicle parts and components market in 2025; power electronics is the fastest-expanding segment, with a 9.79% CAGR through 2031.
- By voltage, up to 400-volt systems dominated with 83.28% share in 2025; 800-volt platforms are forecast to post 8.31% CAGR as premium OEMs prioritize faster charging.
- By region, Asia-Pacific generated 58.74% of 2025 revenue; the Middle East and Africa are projected to grow at an 8.28% CAGR.
Note: Market size and forecast figures in this report are generated using Mordor Intelligence’s proprietary estimation framework, updated with the latest available data and insights as of 2026.
Global Electric Vehicle Parts And Components Market Trends and Insights
Drivers Impact Analysis*
| Driver | (~) % Impact on CAGR Forecast | Geographic Relevance | Impact Timeline |
|---|---|---|---|
| Falling Li-Ion Costs and Gigafactory Output Driving Adoption | +1.2% | Global (China, United States, Europe) | Medium term (2-4 years) |
| ZEV Mandates and Incentives Accelerating Electrification | +0.9% | North America, Europe, expanding to Asia-Pacific | Short term (≤ 2 years) |
| OEM Shift To 800V Architectures Boosting Power Electronics Demand | +0.8% | Global, premium segments | Medium term (2-4 years) |
| Public Fast-Charging Infrastructure Expansion | +0.7% | North America, Europe, spill-over to Asia-Pacific | Long term (≥ 4 years) |
| Silicon-Carbide Devices Raising Component ASPs | +0.6% | Global, premium segments | Medium term (2-4 years) |
| Software-Defined E-Powertrain ECUs Emerging | +0.5% | Global, early adoption in North America and Europe | Long term (≥ 4 years) |
| Source: Mordor Intelligence | |||
Declining Li-ion Battery Costs and Gigafactory Output
Lithium-ion pack prices have declined significantly, enabling price parity for mass-market electric models in various regions [1]“Battery Price Survey 2024,”, BloombergNEF, about.bnef.com. Increased production capacity in key locations has eased supply constraints for North American OEMs. Panasonic’s high-nickel cylinder technology enhances energy density, reducing pack weight and increasing cabin space. BYD’s Blade battery, known for its high volumetric density and rigorous safety standards, allows the company to offer competitive pricing while maintaining compliance. Additionally, Samsung SDI's strategic joint venture highlights the growing trend of automaker-supplier collaborations that mitigate risks and capitalize on government incentives.
Government Incentives and ZEV Mandates
The Inflation Reduction Act provides a USD 7,500 tax credit tied to local-content thresholds, pushing suppliers to scale United States production[2]“Inflation Reduction Act Fact Sheet,”, U.S. Department of Energy, energy.gov. Europe’s Fit for 55 package sets a 2035 end date for internal combustion passenger cars, providing long-term visibility for component investments. China’s dual-credit mechanism continues to stimulate demand, following 16.49 million new energy vehicle sales in 2025. Subsidy design now emphasizes domestic manufacturing, R&D grants, and charging-network co-funding, ensuring that policy support transcends retail price cuts. The convergence of regulatory timelines across the three largest auto markets lifts global volumes, allowing suppliers to amortize R&D over broader, more predictable order books.
OEM Shift to 800 V Architectures Elevating Power-Electronics Demand
Hyundai's E-GMP, the foundation of Ioniq and Kia's EV lines, supports advanced charging capabilities at high-power stations. General Motors, with its dual-voltage Ultium platforms, is driving suppliers to develop scalable inverters and DC-DC converters. Porsche and Lucid have been instrumental in popularizing the 800 V standard, while Stellantis has announced plans to integrate it into its future platforms. Infineon has increased shipments of SiC modules following the signing of long-term agreements with Hyundai Mobis and BorgWarner. Although battery systems are becoming more commoditized, on-board chargers for the 800 V standard, which carry a significant price premium, continue to enhance supplier revenues.
Rise of Software-Defined E-Powertrain Control Units
Centralized computing merges traction, thermal, and charging logic into a single controller. The consolidation cuts wiring complexity and improves cybersecurity by reducing attack surfaces. Over-the-air updates enable percent-level efficiency gains via algorithm refinements and unlock new service revenue for automakers. Component suppliers increasingly bundle hardware with base software, while platform makers license reference architectures to smaller Tier-1s lacking in-house codebases. The shift elevates the strategic value of real-time operating systems, functional-safety libraries, and cloud analytics pipelines.
Restraints Impact Analysis*
| Restraint | (~) % Impact on CAGR Forecast | Geographic Relevance | Impact Timeline |
|---|---|---|---|
| Critical Mineral Bottlenecks | −0.8% | Global, acute in lithium-producing regions | Short term (≤ 2 years) |
| Grid Constraints in Emerging Markets | −0.6% | Asia-Pacific emerging, Middle East & Africa, Latin America | Medium term (2-4 years) |
| Rare-Earth Magnet Price Swings | −0.4% | Global, concentration risk in China | Short term (≤ 2 years) |
| OEM Vertical Integration Squeezing Tier-1 Margins | −0.3% | Global, varied by OEM | Long term (≥ 4 years) |
| Source: Mordor Intelligence | |||
Critical-Mineral Supply Bottlenecks
Lithium carbonate prices saw a pronounced early-year surge, only to drop sharply as the year drew to a close. These price swings underscore the evolving global supply-demand landscape, affecting battery production expenses and shaping strategies within the electric vehicle and energy storage sectors. Refining gaps rather than raw-ore shortages became the core constraint, prompting miners and cathode producers to fast-track hydroxide projects with two-year lead times. Cobalt dependence elevates political risk, while nickel sulfate tightness delays high-energy-density designs. Battery makers diversify chemistries toward lithium iron phosphate to ease pressure on constrained materials. Short-term volatility forces OEMs to hedge prices and reevaluate pack design roadmaps.
Inadequate Grid Capacity in Emerging Markets
India faces significant distribution losses, and transformer ratings in Tier-2 cities are unable to support multiple simultaneous high-capacity chargers, slowing the development of charging infrastructure. Southeast Asian grids, heavily reliant on coal, face challenges integrating renewable energy sources, which could lead to increased emissions for battery-electric fleets. In Sub-Saharan regions, low electrification levels undermine the viability of commercial fleet charging. Brazil's urban networks are strained during peak hours, necessitating substantial upgrades to enable widespread residential charging. In Argentina, frequent power outages discourage the electrification of logistics fleets, despite the availability of domestic lithium resources.
*Our forecasts treat driver/restraint impacts as directional, not additive. The impact forecasts reflect baseline growth, mix effects, and variable interactions.
Segment Analysis
By Vehicle Type: Fleet Economics Propel Commercial Adoption
Passenger cars dominated the electric vehicle powertrain components market, accounting for 73.11% of revenue in 2025. Light commercial vehicles are scaling fastest as parcel-delivery giants lock in total-cost-of-ownership savings, and their share of the electric vehicle powertrain components market size is projected to expand at 8.71% CAGR through 2031. OEM orderbooks—Amazon’s Rivian vans, DHL’s Ford E-Transit, and FedEx’s GM BrightDrop models—shed light on supplier capacity plans. Urban bus electrification has demonstrated the economic viability of battery-electric buses for stop-and-go duty cycles. Heavy trucks are beginning to adopt fuel-cell configurations, with Hyundai’s Xcient achieving significant operational milestones in Europe. Regulations like California’s Advanced Clean Fleets and the EU’s push for substantial CO₂ reduction in heavy-duty vehicles are steering the roadmap for long-haul decarbonization.
Despite the momentum in commercial vehicles, challenges arise from payload-range trade-offs and a lack of megawatt-class charging lanes. This has led fleet operators to favor depot-based charging strategies. In China, as subsidies begin to taper off, purchase incentives are being redirected towards infrastructure grants. This shift ensures that the total cost of ownership remains attractive without negatively impacting resale values. Component suppliers are customizing thermal-management and power-electronics modules to align with the higher average daily utilization observed in fleets. Additionally, the integration of telematics is paving the way for predictive-maintenance revenue opportunities.


By Propulsion Type: Battery Electric Dominance
Battery-electric vehicles captured 62.25% of revenue in 2025 and remain the anchor of the electric vehicle powertrain components market. Plug-in hybrids bridge infrastructure gaps, yet several automakers plan to sunset plug-in hybrid electric vehicle lines by 2028 as charging networks mature. Hybrids without external charging retain share in Japan but are losing global relevance as the BEV total cost of ownership falls below internal-combustion parity. Fuel-cell electric vehicles are expanding at an 8.42% CAGR, buoyed by South Korea’s 310 public hydrogen stations and California’s USD 150 million heavy-duty hydrogen corridor grants.
Hydrogen momentum is concentrated in heavy-duty freight and bus segments, where refueling speed and long-range metrics outweigh higher drivetrain costs. Compliance with SAE J2601 protocols ensures station-vehicle interoperability, mitigating early-adopter risk. OEMs continue to hedge with multi-propulsion portfolios, yet supply-chain investments increasingly favor BEV components—cells, packs, inverters—given higher volume certainty.
By Component Type: Power Electronics Surge
Battery packs accounted for 36.13% of 2025 spending, but intense price competition from Chinese suppliers is squeezing margins across the electric-vehicle powertrain components market. Power electronics posted the fastest growth at a 9.79% CAGR, propelled by 800-V migration and SiC adoption, which raises content per vehicle by 30–40%. Battery-management systems are moving to wireless topologies, cutting harness weight by up to 15% and simplifying pack assembly. Thermal-management innovations, including immersion cooling by Valeo and Mahle, address the higher heat fluxes generated during 400-kW fast charging.
Motor diversification continues: permanent-magnet synchronous units deliver top efficiency but face rare-earth volatility, while induction and switched-reluctance alternatives lessen material risk. Wiring and connectors must now meet USCAR-2 and LV 215 high-voltage standards, driving incremental content per vehicle. Domain controllers that merge powertrain, battery, and climate functions are emerging as the control-unit baseline, enabling over-the-air feature upgrades and cybersecurity hardening.

By Voltage Platform: Premium Segment Drives 800-V Migration
Up to 400-V systems held an 83.28% share in 2025, reflecting legacy platforms and cost-sensitive vehicle classes. Yet 800-V architectures are projected to log an 8.31% CAGR as Porsche, Hyundai, Kia, and Lucid popularize faster charging and reduced cable weight. General Motors plans to introduce 800-V capabilities across all Ultium trims, marking a significant step towards the widespread adoption of the 800-V standard. While Lotus and certain Chinese startups are testing higher-voltage systems to achieve faster charging speeds, they face challenges in component qualification and meeting safety approvals.
The transition to 800 V requires redesigns in inverter substrates, DC-link capacitors, and on-board charger topologies, all of which involve higher costs due to their reliance on advanced components. However, infrastructure compatibility remains a challenge: currently, only specific charging stations equipped with liquid-cooled cables can fully utilize the speeds offered by 800-V charging. Efforts to harmonize regulatory standards are underway to facilitate smoother cross-border deployment of commercial vehicles.
Geography Analysis
Asia-Pacific held 58.74% of global revenue in 2025, leveraging China’s scale from 16.49 million domestic EV registrations that year. China’s complete value chain—from lithium conversion and cathode production to motor assembly—creates cost advantages and shortens development loops. Japan specializes in high-precision motors and power electronics, while South Korea leads in NCM cell formulations and pouch technology. India’s production-linked incentives catalyze local module factories and attract foreign cell makers, moving the region from final assembly to deeper component integration over the decade [3]“ACC PLI Scheme Guidelines,”, Government of India, heavyindustries.gov.in.
The Middle East and Africa register the fastest 2026-to-2031 CAGR at 8.28%. Sovereign wealth projects in the United Arab Emirates and Saudi Arabia finance greenfield EV plants, battery enclosures, and silicon-carbide wafer fabs, leveraging solar resources to lower energy costs for electrolytic processes. South Africa capitalizes on platinum-group metals for fuel-cell stacks and manganese for LFP cathodes, embedding minerals deeper into domestic value chains. Grid upgrades and renewable expansion will dictate the pace at which component production scales regionally.
North America benefits from the Inflation Reduction Act, which ties tax credits to domestic content, GM channeling USD 35 billion into battery-cell and material plants. Localization reduces foreign-exchange risk and freight costs, but also demands new supplier bases for separators, current collectors, and cathode binders. Europe emphasizes recycling quotas and circular-economy directives; new gigafactory projects incorporate black-mass processing lines to capture cobalt and nickel for closed-loop cathodes. Environmental regulations elevate the role of life-cycle analysis software and traceability modules within each component's bill of materials.


Competitive Landscape
The electric vehicle parts and components market is moderately fragmented. Battery cell supply is dominated by major players like CATL, LG Energy Solution, and BYD. In contrast, segments such as power electronics, thermal management, and wiring harnesses are more dispersed. This dispersion allows niche specialists to secure programs through rapid innovation rather than sheer scale. While Tesla and BYD's vertical integration compresses Tier-1 margins on commoditized modules, it simultaneously presents opportunities in software, analytics, and integration for suppliers willing to co-develop architectures.
Patent filings for silicon-carbide power devices have increased, highlighting a technology-driven competitive landscape. Veteran automotive suppliers, armed with ISO-certified quality systems and longstanding OEM ties, face a pivotal shift. To transition from sub-system vendors to system integrators, they must embrace code-intensive offerings. Meanwhile, semiconductor manufacturers are encroaching on traditional Tier-1 domains, offering reference designs and partially assembled modules.
Regional industrial policies intensify the competition. In the United States, domestic-content regulations foster joint ventures that meld Asian battery expertise with American automotive brands. Simultaneously, Europe's recycling mandates favor players with metallurgical skills. As OEMs prioritize supply security by dual-sourcing essential parts, it limits any single supplier's market-share expansion in standardized categories like contactors and busbars.
Electric Vehicle Parts And Components Industry Leaders
Contemporary Amperex Technology Co. Ltd
LG Energy Solution Ltd
Robert Bosch GmbH
BYD Co. Ltd
Panasonic Holdings Corp.
- *Disclaimer: Major Players sorted in no particular order


Recent Industry Developments
- September 2025: Seres Group Co., Ltd. acquired a controlling stake in Chongqing Landian Automotive Technology Co., Ltd. for CNY 175 million (USD 24.84 million), establishing its position as the company's largest shareholder. The acquisition enables Seres Group to develop strategic partnerships with Landian Auto across technical collaboration, supply chain integration, and market expansion, enhancing its position in the electric vehicle core component market.
- September 2025: In a strategic move, Mazda Motor Corporation inked a deal with Yamaguchi Prefecture and Iwakuni City to establish the "Mazda Motor Corporation Iwakuni Plant." This facility will focus on producing module packs for automotive cylindrical lithium-ion battery cells, marking a significant step in Mazda's expansion in Iwakuni City, Yamaguchi Prefecture.
- May 2025: Garrett Motion Inc. received its first major production contract for a high-speed electric traction motor and matching inverter, designed for integration into electric axles for heavy-duty trucks. The company plans to commence production in 2027.


Global Electric Vehicle Parts And Components Market Report Scope
The electric vehicle parts and components market report is segmented by vehicle type (passenger cars and commercial vehicles), propulsion type (battery electric vehicle, plug-in hybrid electric vehicles, hybrid electric vehicles, and fuel cell electric vehicle), component type (battery packs, electric motors, power electronics, thermal-management components, wiring, harness and connectors and sensors and control units), voltage platform (up to 400 v systems, 800 v systems, and above 800 v systems), and geography (North America, South America, Europe, Asia-Pacific, and Middle East and Africa). The market forecasts are provided in terms of value (USD).
| Passenger Cars | Compact |
| Sport utility Vehicles / Crossover | |
| Luxury | |
| Commercial Vehicles | Light Commercial Vehicles |
| Buses and Coaches | |
| Medium and Heavy Trucks |
| Battery Electric Vehicle |
| Plug-in Hybrid Electric Vehicle |
| Hybrid Electric Vehicle |
| Fuel Cell Electric Vehicle |
| Battery Packs | Battery Cells |
| Battery Management Systems | |
| Battery Thermal Management Systems | |
| Electric Motors | Permanent-Magnet Synchronous |
| Induction | |
| Switched-Reluctance | |
| Power Electronics | Inverters |
| DC-DC Converters | |
| On-board Chargers | |
| Thermal-Management Components | Heat Exchangers |
| Cooling Plates | |
| Wiring, Harnesses and Connectors | |
| Sensors and Control Units |
| Up to 400 V Systems |
| 800 V Systems |
| Above 800 V Systems |
| North America | United States |
| Canada | |
| Rest of North America | |
| South America | Brazil |
| Argentina | |
| Rest of South America | |
| Europe | Germany |
| United Kingdom | |
| France | |
| Italy | |
| Spain | |
| Russia | |
| Rest of Europe | |
| Asia-Pacific | China |
| India | |
| Japan | |
| South Korea | |
| Australia | |
| Rest of Asia-Pacific | |
| Middle-East and Africa | United Arab Emirates |
| Saudi Arabia | |
| Turkey | |
| Egypt | |
| South Africa | |
| Rest of Middle-East and Africa |
| By Vehicle Type | Passenger Cars | Compact |
| Sport utility Vehicles / Crossover | ||
| Luxury | ||
| Commercial Vehicles | Light Commercial Vehicles | |
| Buses and Coaches | ||
| Medium and Heavy Trucks | ||
| By Propulsion Type | Battery Electric Vehicle | |
| Plug-in Hybrid Electric Vehicle | ||
| Hybrid Electric Vehicle | ||
| Fuel Cell Electric Vehicle | ||
| By Component Type | Battery Packs | Battery Cells |
| Battery Management Systems | ||
| Battery Thermal Management Systems | ||
| Electric Motors | Permanent-Magnet Synchronous | |
| Induction | ||
| Switched-Reluctance | ||
| Power Electronics | Inverters | |
| DC-DC Converters | ||
| On-board Chargers | ||
| Thermal-Management Components | Heat Exchangers | |
| Cooling Plates | ||
| Wiring, Harnesses and Connectors | ||
| Sensors and Control Units | ||
| By Voltage Platform | Up to 400 V Systems | |
| 800 V Systems | ||
| Above 800 V Systems | ||
| By Geography | North America | United States |
| Canada | ||
| Rest of North America | ||
| South America | Brazil | |
| Argentina | ||
| Rest of South America | ||
| Europe | Germany | |
| United Kingdom | ||
| France | ||
| Italy | ||
| Spain | ||
| Russia | ||
| Rest of Europe | ||
| Asia-Pacific | China | |
| India | ||
| Japan | ||
| South Korea | ||
| Australia | ||
| Rest of Asia-Pacific | ||
| Middle-East and Africa | United Arab Emirates | |
| Saudi Arabia | ||
| Turkey | ||
| Egypt | ||
| South Africa | ||
| Rest of Middle-East and Africa | ||


Key Questions Answered in the Report
What is the projected value of global electric-vehicle parts and components in 2031?
The value is forecast to reach USD 300.46 billion by 2031.
How fast are 800-volt vehicle platforms expanding?
Shipments tied to 800-volt architectures are expected to advance at an 8.31% CAGR between 2026 and 2031.
Which vehicle class is adding volume most rapidly?
Commercial vehicles, especially last-mile delivery vans, are scaling at an 8.71% CAGR as fleet operators chase total-cost-of-ownership gains.
Why are lithium-ion pack prices crucial for adoption?
Crossing the sub-USD 100 kWh threshold in 2024 pushed battery-electric purchase prices toward parity with internal-combustion cars, unlocking wider consumer demand.
What factor poses the greatest supply-chain risk for component makers?
Critical-mineral bottlenecks, particularly lithium refining and rare-earth magnet supplies, constrain near-term capacity.
Page last updated on:


