Automotive Parts and Aftermarket Packaging Market Size and Share
Market Overview
| Study Period | 2019 - 2030 |
|---|---|
| Market Size (2025) | USD 9.18 Billion |
| Market Size (2030) | USD 11.26 Billion |
| Growth Rate (2025 - 2030) | 4.17% CAGR |
| Fastest Growing Market | Asia Pacific |
| Largest Market | North America |
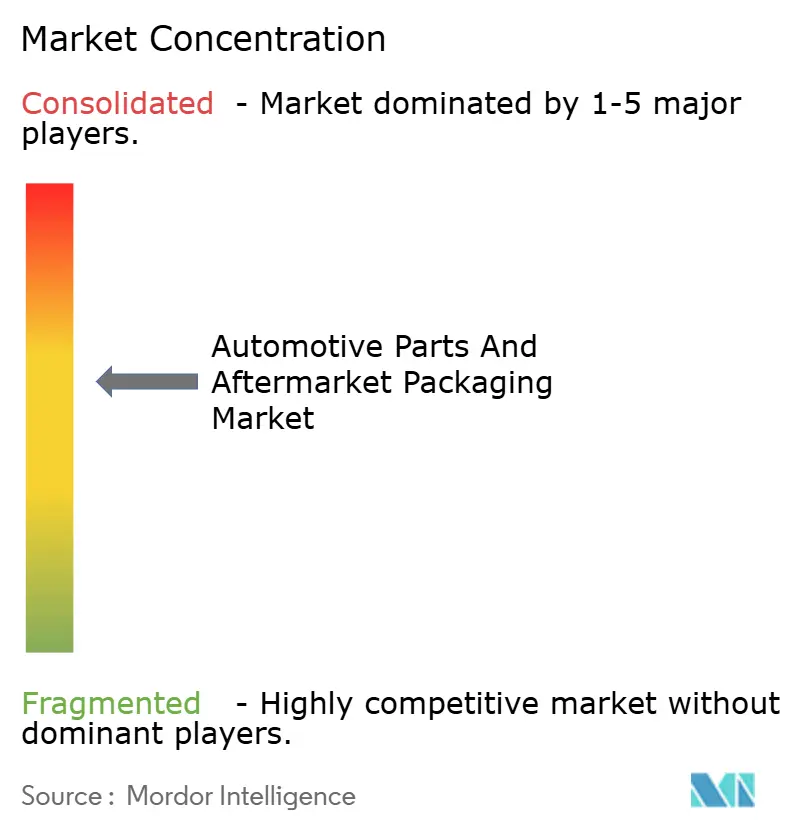
| Market Concentration | Medium |
Major Players *Disclaimer: Major Players sorted in no particular order Image © Mordor Intelligence. Reuse requires attribution under CC BY 4.0. | |

Automotive Parts and Aftermarket Packaging Market Analysis by Mordor Intelligence
The automotive parts and aftermarket packaging market size stands at USD 9.18 billion in 2025 and is forecast to reach USD 11.26 billion by 2030, reflecting a 4.17% CAGR during the period. Growth relies on the steady migration of parts sales to direct-to-consumer e-commerce channels, which require rugged, trackable, and increasingly eco-compliant packaging formats. Corrugated fiberboard retains its primacy because it balances price and recyclability; however, value is shifting toward lighter plastics that incorporate anti-static additives and smart-label features, which are increasingly demanded for electronic components. Sustainability rules, notably extended producer responsibility mandates, keep recyclability in sharp focus, while rising SKU complexity accelerates demand for digitally printed, small-batch solutions that preserve branding and regulatory labeling accuracy. Scale economies, automation, and pooling platforms for returnable containers are expected to moderate raw material volatility and improve inventory turns, enabling suppliers to protect margins even as packaging specifications broaden by component and geography.
Key Report Takeaways
- By material, corrugated fiberboard captured 42.11% of the automotive parts and aftermarket packaging market share in 2024.
- By packaging type, the automotive parts and aftermarket packaging market size for protective films and tapes is forecast to advance at a 6.91% CAGR through 2030.
- By component, engine parts captured 24.39% of the automotive parts and aftermarket packaging market share in 2024.
- By vehicle class, the automotive parts and aftermarket packaging market size for two-wheelers is forecast to advance at a 6.89% CAGR through 2030.
- By region, North America captured 28.42% of the automotive parts and aftermarket packaging market share in 2024.
Note: Market size and forecast figures in this report are generated using Mordor Intelligence’s proprietary estimation framework, updated with the latest available data and insights as of January 2026.
Global Automotive Parts and Aftermarket Packaging Market Trends and Insights
Drivers Impact Analysis*
| Driver | (~) % Impact on CAGR Forecast | Geographic Relevance | Impact Timeline |
|---|---|---|---|
| Aggressive SKUs proliferation in e-commerce aftermarket | +1.2% | Global, with APAC and North America leading | Medium term (2-4 years) |
| OEM mandates on returnable eco-packaging | +0.8% | Europe and North America core, expanding to APAC | Long term (≥ 4 years) |
| Tightening extended producer-responsibility laws | +0.6% | Europe leading, North America following | Long term (≥ 4 years) |
| Surge in thermoplastics with anti-static additives | +0.5% | Global, concentrated in electronics-heavy regions | Medium term (2-4 years) |
| Digital printing lowering MOQ for customized kits | +0.4% | North America and Europe, expanding globally | Short term (≤ 2 years) |
| Growth of over-the-air software updates reducing on-site servicing demand | +0.3% | Premium vehicle markets globally | Long term (≥ 4 years) |
| Source: Mordor Intelligence | |||
Aggressive SKUs Proliferation in E-Commerce Aftermarket
Online parts platforms stock hundreds of thousands of SKUs, dwarfing the assortments of brick-and-mortar stores and forcing packaging suppliers to engineer modular kits that fit dramatically varied geometries without requiring bespoke tooling. Quick-change die-cutting, digital printing, and inventory-on-demand workflows compress lead times and keep small volumes economical, letting distributors avoid SKU rationalization while still meeting cost targets. The trend especially favors protective films and tapes that wrap irregular items more flexibly than fixed-wall cartons. Increased labeling variations for multilingual compliance are handled by late-stage, print-on-box technology, eliminating the need for pre-printed overstock. As e-commerce now represents the fastest-growing aftermarket channel, pack designs are optimized for parcel carriers, integrating scannable codes that interface with fulfillment software for real-time inventory reconciliation. These capabilities enable sellers to minimize damage-in-transit returns, preserve seller ratings, and accelerate next-day shipping promises that drive repeat purchase behavior.[1]BMW Group, “Circular Economy and Sustainability,” bmwgroup.com
OEM Mandates on Returnable Eco-Packaging
Global automakers commit to circular-economy targets that require suppliers to shift away from one-way corrugate toward rigid, trackable, multi-cycle totes. BMW expects 95% of inbound production parts to be in returnable containers by 2025, setting a procurement precedent that other brands will likely quickly emulate. The mandate increases capital costs because engineered plastic totes cost roughly three times more than one-time packs; however, the total cost of ownership improves over three to five cycles through lower scrap and the elimination of disposal fees. Pooling specialists such as CHEP manage asset rotation, clean-and-repair operations, and IoT tracking, allowing tier suppliers to outsource logistics complexity while meeting OEM scorecard targets.[2]CHEP, “Automotive Packaging Solutions,” chep.com Returnable programs stimulate demand for molded pulp corner blocks and metal reinforcements, which extend tote life and deepen supplier engagement across multiple vehicle programs.
Tightening Extended Producer-Responsibility Laws
The European Union requires a 65% recycling rate of automotive packaging by 2025 under its Packaging and Packaging Waste Regulation, with monetary penalties for failing to meet the target. Similar laws in Canada, Germany, and several U.S. states shift the disposal cost burden onto producers, effectively internalizing landfill externalities. Non-recyclable laminates are phased out in favor of mono-material corrugate or high-density polyethylene that meet single-stream sorting rules. Label adhesives, inks, and even pallet stretch wrap are reformulated to meet the toxicity thresholds set by authorities such as the German Environment Agency. Producers undertake design-for-disassembly workshops and lifecycle audits that extend beyond car parts to secondary and tertiary packaging, embedding sustainability as a key criterion for competitive tenders.
Surge in Thermoplastics with Anti-Static Additives
Electronic modules, sensors, and battery-management systems are increasingly accounting for a larger share of vehicle value, and protecting them from electrostatic discharge is now non-negotiable. Conductive PE and PP compounds infused with carbon black or graphene form lightweight trays and clamshells that safely dissipate surface charges below 10^12 Ω/sq, outclassing heavier aluminum boxes without sacrificing protection. Developers ensure additive concentrations do not impede recyclability so the finished pack still meets EU recycling mandates. The shift pushes plastics growth 200 basis points above the total automotive parts and aftermarket packaging market CAGR and encourages line investments in co-extrusion and in-line conductivity testing to certify every batch. North American and Japanese electronics hubs adopt the technology first, with South Korea and China scaling quickly for EV modules.
Restraints Impact Analysis*
| Restraint | (~) % Impact on CAGR Forecast | Geographic Relevance | Impact Timeline |
|---|---|---|---|
| Rising resin price volatility | -0.7% | Global, with higher impact in price-sensitive regions | Short term (≤ 2 years) |
| Weight-adding impact on freight cost for heavy corrugates | -0.4% | Global, particularly long-distance shipping routes | Medium term (2-4 years) |
| Complex recyclability certification across regions | -0.3% | Europe and North America leading, expanding globally | Long term (≥ 4 years) |
| Counterfeit spare parts channels bypassing formal packaging | -0.2% | Global, concentrated in emerging markets | Medium term (2-4 years) |
| Source: Mordor Intelligence | |||
Rising Resin Price Volatility
Polypropylene and polyethylene spot prices have whipsawed by double-digit percentages quarter-to-quarter, eroding margins on fixed-price packaging contracts and delaying capital projects at smaller converters. Hedging instruments exist but require balance-sheet strength that many mid-tier players lack, forcing them to introduce pass-through clauses or accept income volatility. The uncertainty also hampers long-term innovation budgets because ROI calculations become cloudy. OEMs accustomed to year-over-year cost-down expectations often balk at quarterly surcharges, which add procurement friction and lengthen sourcing cycles. Over time, the turbulence nudges buyers toward hybrid programs that blend returnable assets with single-use corrugate to temper resin exposure, potentially slowing plastics penetration until feedstock markets stabilize.[3]FedEx Corporation, “Dimensional Weight Pricing Guide,” fedex.com
Weight-Adding Impact on Freight Cost for Heavy Corrugates
Parcel carriers bill by dimensional weight, so thick corrugate walls trigger rate up-charges once shipments dip below density thresholds. Automotive parts, particularly lightweight plastic trim, frequently ship at sub-optimum fill factors, meaning packages can cost more to move than the part itself on transcontinental lanes. Warehouse managers respond by trimming board weight, but that raises damage rates and customer dissatisfaction. E-commerce sellers increasingly experiment with multi-layer bubble laminations that weigh less yet resist impact better than double-wall corrugate. Until carrier pricing models evolve or on-demand packaging robots reduce void space, dimensional penalties will remain a drag on the automotive parts and aftermarket packaging market expansion.
*Our forecasts treat driver/restraint impacts as directional, not additive. The impact forecasts reflect baseline growth, mix effects, and variable interactions.
Segment Analysis
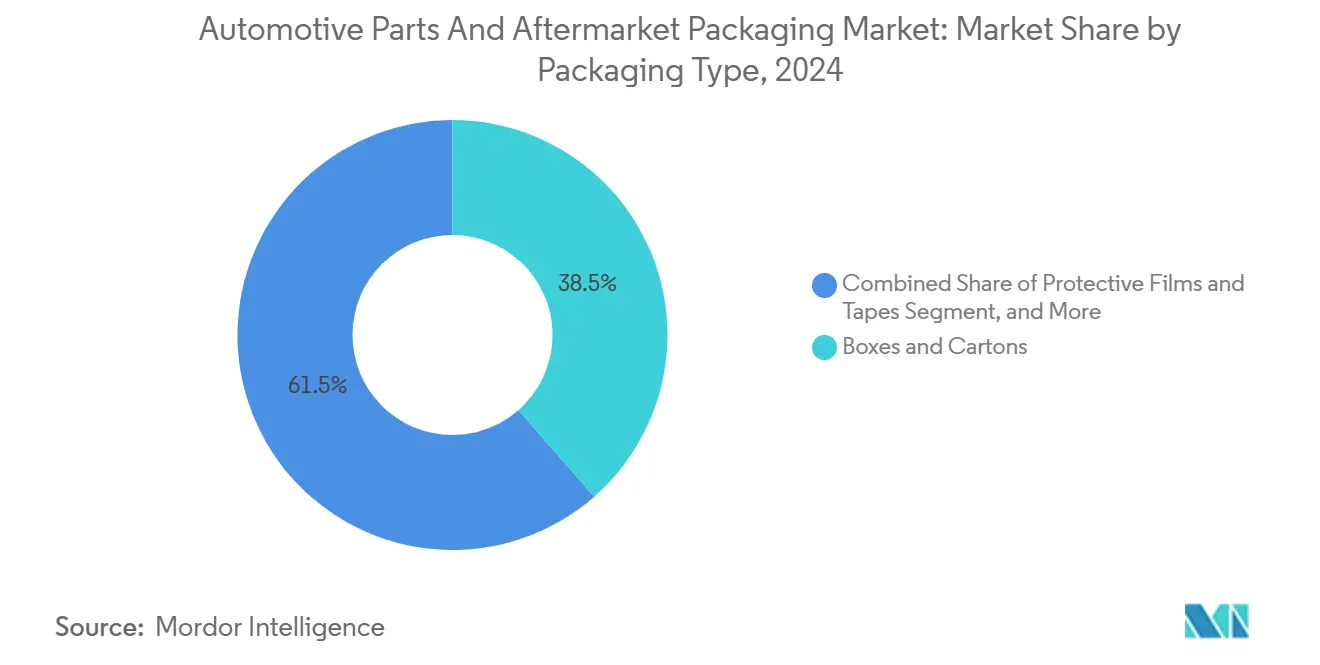
By Packaging Type: Protective Solutions Drive Innovation
Boxes and cartons accounted for 38.54% of 2024 revenue, confirming their ubiquity for engines, filters, and brake pads; however, their share is edging downward as parts sellers chase lighter, tailor-fit formats. Protective films and tapes are expected to achieve the fastest 6.91% CAGR by 2030, driven by the ballooning e-commerce volumes that ship single parts across multiple hand-offs, where scuff, moisture, and static are significant risks. Digital printing on film substrates enhances SKU matching and brand security while reducing the minimum order quantity to 500 sheets, a crucial step when aftermarket SKUs exceed half a million. Clamshells and blisters remain aligned with retail channels that value shelf visibility, but their uptake slows as direct shipping bypasses store fixtures. Labels evolve from basic ID to multi-layer booklets that embed QR codes for fitting videos and include tamper-evident seals. Fluid pouches utilize barrier films that withstand lubricants while meeting UN hazardous goods regulations, underscoring the category’s technical complexity. Niche containers for hazardous batteries and airbags continue to be premium offerings.
Protective films capitalize on low density and small storage footprints, empowering fulfillment centers to stock micro-rolls that fit under packing benches for just-in-time usage. Their stretch and cling technology enables secure wraps around irregular shapes without the need for additional paper void fill, reducing carton sizes and freight costs. Adhesive tapes with printable zones offer compliance labeling without the need for extra stickers, allowing for a more efficient use of material per pack. Market education is key: technicians trust familiar cartons, so suppliers demonstrate drop-test data to prove the resilience of their films. Volume buyers lock in multi-year contracts that bundle films with automated wrapper machines, thereby cementing supplier relationships that extend far beyond the sale of consumables alone. These trends meld to push the automotive parts and aftermarket packaging market toward higher-margin protective solutions.


By Material: Plastics Innovation Accelerates Growth
Corrugated fiberboard still accounts for 42.11% of the 2024 volume, but plastics are projected to outgrow all rivals at a 6.39% CAGR, benefiting from weight savings, moisture barriers, and anti-static performance. Injection-molded totes integrate RFID for closed-loop tracking while thin-wall thermoforms shield sensors without adding bulk. Paperboard remains a price leader for filters and gaskets shipped in bulk master cartons, although sustainability demands are pushing mills to derive fibers from certified forestry programs. Molded pulp emerges as a versatile middle ground, combining cushioning with recyclability in a single material pass, thereby avoiding the need for separate foam inserts. Metals keep relevance for high-value precision tools or battery modules that need electromagnetic shielding and flame resistance.
Plastics suppliers invest in bio-resin blends that meet OEM carbon goals without compromising mechanical properties. Conductive masterbatches reduce per-unit costs for anti-static trays significantly below those of aluminum dunnage, enabling electronics-heavy parts to surpass automotive parts and aftermarket packaging market size forecasts for plastics. However, REACH compliance requires rigorous chemical disclosures, which can stretch product-launch timelines. Corrugate producers counter by laminating water-resistant coatings derived from sugarcane, thereby preserving the eco-image of paper. Life-cycle assessments are increasingly dictating material choices, and customers are comparing cradle-to-gate emissions rather than sticker prices alone. This data-driven scrutiny encourages substitution cycles in favor of materials with verifiable recycling streams.
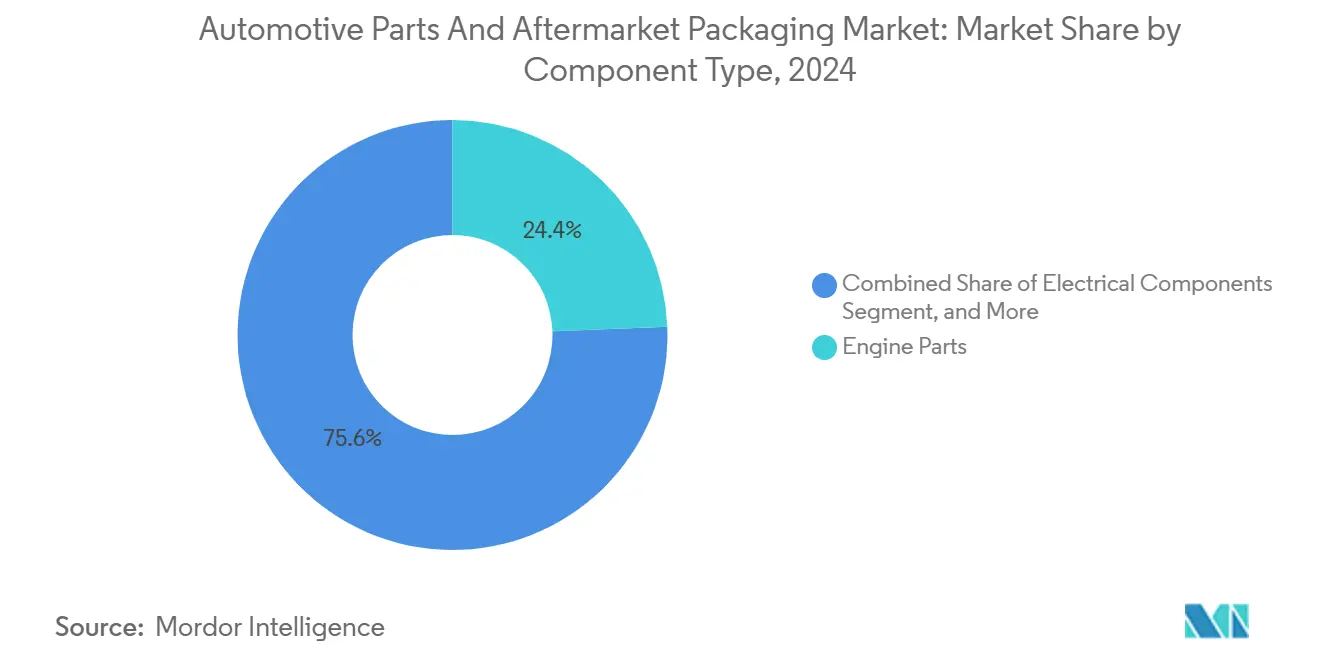
By Component Type: Electronics Drive Premium Packaging
Engine components still account for 24.39% of demand, despite high wear-and-tear rates, while electronic modules drive faster growth with a 5.49% CAGR, nearly triple that of the total automotive parts and aftermarket packaging market. Electronics-focused packs feature ESD-certified trays, moisture barrier bags, and foam inserts that both wick away static and cushion delicate solder joints. Brake and suspension kits require stackable, high-strength boxes lined with molded pulp pads to restrain dense cast-iron calipers that could rupture lighter packs. Body panels rely on corner protectors and stretch films that shield painted surfaces from abrasion. Fluids such as coolants utilize UN-rated pouches with leak-proof spouts, driving demand for specialty films.
Diagnostic tools and smart sensors introduce small-batch challenges: a repair shop may order one unit, yet the item costs hundreds of dollars and cannot arrive damaged. Packs, therefore, incorporate tamper icons that discourage gray-market diversion. Interior trims utilize dust-free bagging to maintain scratch-free polymer surfaces, and color-coded labels facilitate line-side sequencing. ISO 9001 audit trails mandate that each pack records lot codes, supplier IDs, and fitment models, turning the box into a data carrier as much as a protective shell. The increasing electrification of drivetrains ensures that electronic components continue to outpace mechanical parts, thereby multiplying premium-pack revenue streams.
By Vehicle Type: Two-Wheelers Accelerate Market Growth
Passenger cars remained the largest volume consumer, with a 46.27% share in 2024. However, two-wheelers logged the fastest 6.89% CAGR through 2030, driven by urban congestion policies that promote the uptake of scooters and motorcycles. Smaller, lighter parts benefit from padded envelopes and flexible pouches that cut postage costs, making online parts orders viable when units sell for under USD 10. Light commercial vehicles are edging upward as gig-economy deliveries heighten brake pad and tire replacement intervals, injecting steady demand for mid-sized corrugated products. Heavy commercial vehicles, although slower in unit terms, generate high-value shipments for transmissions and turbochargers that require specialty crating.
Off-highway vehicles, such as agricultural machines, often operate far from service centers; therefore, the packaging must safeguard parts during rough transit. Returnable crates are prevalent here, reducing waste on remote farms. Two-wheeler aftermarket channels flourish on mobile apps that ship directly to roadside mechanics, where single-use packs favor tear-strip openings for quick part identification during daylight-limited repairs. Electrified motorcycles introduce electronics-loaded battery packs, merging two-wheeler volumes with electronic component packaging standards. Diversity across vehicle classes keeps the automotive parts and aftermarket packaging market fragmented, allowing nimble suppliers to tailor portfolios and defend margins.
Geography Analysis
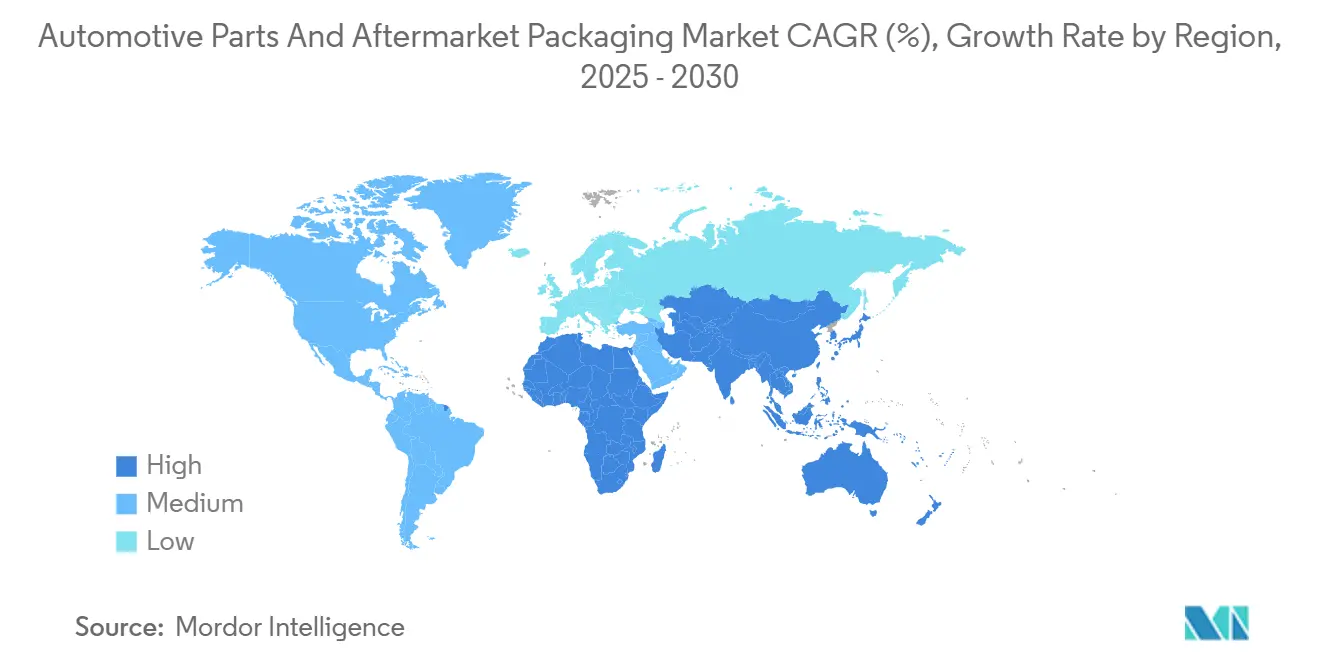
North America accounted for 28.42% of the revenue in 2024, driven by a mature aftermarket network, same-day courier services, and stringent hazmat regulations that prioritize tested packaging protocols. U.S. winter-salted roads accelerate part wear, thereby increasing demand for corrosion-resistant inner liners. Meanwhile, Canadian temperature swings necessitate material testing from -40 °C to 40 °C to prevent brittleness. Cross-border flows with Mexico incentivize returnable rack programs that circumnavigate landfill surcharges at maquiladora plants. Environmental Protection Agency rules on volatile organic compounds are pushing printers toward water-based inks, giving early-adopting converters a compliance edge.
The Asia-Pacific region is forecast to post a 6.61% CAGR, the fastest worldwide, driven by the expansion of the vehicle parc in India and Thailand, as well as steep e-commerce penetration. Chinese megahubs operate fully automated fulfillment centers that print labels on demand and synchronize with customs databases, easing exports for cross-border sellers. Japan pioneers conductive bioplastics for hybrid-vehicle electronics, a niche that regional suppliers are rapidly adopting. Varied recycling mandates, from Singapore’s mandatory waste-electrical recycling to India’s nascent regulations, compel packaging designs that accommodate multiple end-of-life pathways. Local language requirements encompass 20-plus dialects, making late-stage printing capacity indispensable.
Europe remains a sustainability bellwether, leveraging policy to steer material portfolios toward closed-loop solutions. Germany’s Packaging Act charges producers directly for collection costs, accelerating the transition to mono-material fiberboard and molded pulp that fit within existing municipal streams. France’s circular-economy roadmap promotes eco-modulation fees that reward lower-impact packages, influencing design guidelines across the trading bloc. Post-Brexit United Kingdom enforces its own plastic tax on virgin polymer content, nudging distributors to import recycled-content clamshells for aftermarket electronics. Mediterranean exports to North Africa are often repackaged into lighter cartons in free-trade zones to shave freight bills, underscoring the region’s role as a logistics bridge between continents.

Competitive Landscape
The market structure is moderately concentrated, with no firm holding more than 12% and the top five firms accounting for nearly 48%, creating a balanced field where both global conglomerates and regional specialists can thrive. Scale advantages matter, as shown by Amcor's acquisition of Berry Global for USD 8.43 billion, which will enable the pooling of resin procurement and R&D labs. Competitors respond with vertical specialization; molded-pulp experts craft precision engine cradles that corrugate giants struggle to replicate, letting them capture profitable niches. Automation divides the field: multi-national plants run high-throughput, digital-print lines staffed by robotics, whereas mid-size firms differentiate through rapid prototyping and overnight die-cut revisions.
Technology integration shapes future winners. Smart labels embedding NFC tags fetch premium pricing as dealers digitize warranty validation processes. Partnerships between packaging vendors and cloud-platform providers accelerate adoption: one Detroit converter bundles IoT sensors with returnable racks, sharing usage data to predict life-cycle costs for fleet operators. Meanwhile, compliance burdens are pushing regional roll-ups as smaller shops, lacking ISO 14001 accreditation, sell to larger groups eager for capacity in regulated markets. Patent filings spike around conductive masterbatches and molded-pulp corner supports, and litigation is expected as material suppliers defend proprietary blends. Overall, the rivalry remains intense yet offers opportunities for innovators.
Automotive Parts and Aftermarket Packaging Industry Leaders
Sealed Air Corporation
DS Smith Plc
Sonoco Products Company
Mondi plc
Smurfit Westrock plc
- *Disclaimer: Major Players sorted in no particular order

Recent Industry Developments
- January 2025: Sealed Air begins field trials of its SEE Automation IoT platform with a tier-one Japanese parts distributor, integrating shock and temperature sensors into returnable totes.
- December 2024: Mondi finalizes the EUR 650 million (USD 705 million) purchase of Schumacher Packaging, expanding heavy-component corrugate capability across Germany.
- November 2024: Amcor closes its USD 8.43 billion acquisition of Berry Global, forming the world’s largest diversified packaging supplier with an expanded automotive aftermarket portfolio.
- October 2024: Novolex and Pactiv Evergreen complete a USD 6.7 billion merger, creating a broad U.S. platform in corrugate and protective films.


Global Automotive Parts and Aftermarket Packaging Market Report Scope
| Boxes and Cartons |
| Blister Packs |
| Clamshells |
| Bags and Pouches |
| Protective Films and Tapes |
| Labels |
| Other Packaging Types |
| Paperboard |
| Corrugated Fiberboard |
| Plastics |
| Metals |
| Molded Pulp |
| Other Materials |
| Engine Parts |
| Electrical Components |
| Suspension and Braking |
| Body Parts |
| Fluids and Lubricants |
| Interior Components |
| Accessories |
| Other Component Types |
| Passenger Cars |
| Light Commercial Vehicles |
| Heavy Commercial Vehicles |
| Two Wheelers |
| Off-Highway Vehicles |
| North America | United States | |
| Canada | ||
| Mexico | ||
| South America | Brazil | |
| Argentina | ||
| Rest of South America | ||
| Europe | Germany | |
| United Kingdom | ||
| France | ||
| Italy | ||
| Spain | ||
| Russia | ||
| Rest of Europe | ||
| Asia-Pacific | China | |
| Japan | ||
| India | ||
| South Korea | ||
| South-East Asia | ||
| Rest of Asia-Pacific | ||
| Middle East and Africa | Middle East | Saudi Arabia |
| United Arab Emirates | ||
| Turkey | ||
| Rest of Middle East | ||
| Africa | South Africa | |
| Nigeria | ||
| Rest of Africa | ||
| By Packaging Type | Boxes and Cartons | ||
| Blister Packs | |||
| Clamshells | |||
| Bags and Pouches | |||
| Protective Films and Tapes | |||
| Labels | |||
| Other Packaging Types | |||
| By Material | Paperboard | ||
| Corrugated Fiberboard | |||
| Plastics | |||
| Metals | |||
| Molded Pulp | |||
| Other Materials | |||
| By Component Type | Engine Parts | ||
| Electrical Components | |||
| Suspension and Braking | |||
| Body Parts | |||
| Fluids and Lubricants | |||
| Interior Components | |||
| Accessories | |||
| Other Component Types | |||
| By Vehicle | Passenger Cars | ||
| Light Commercial Vehicles | |||
| Heavy Commercial Vehicles | |||
| Two Wheelers | |||
| Off-Highway Vehicles | |||
| By Geography | North America | United States | |
| Canada | |||
| Mexico | |||
| South America | Brazil | ||
| Argentina | |||
| Rest of South America | |||
| Europe | Germany | ||
| United Kingdom | |||
| France | |||
| Italy | |||
| Spain | |||
| Russia | |||
| Rest of Europe | |||
| Asia-Pacific | China | ||
| Japan | |||
| India | |||
| South Korea | |||
| South-East Asia | |||
| Rest of Asia-Pacific | |||
| Middle East and Africa | Middle East | Saudi Arabia | |
| United Arab Emirates | |||
| Turkey | |||
| Rest of Middle East | |||
| Africa | South Africa | ||
| Nigeria | |||
| Rest of Africa | |||


Key Questions Answered in the Report
How large is the automotive parts and aftermarket packaging market in 2025?
The automotive parts and aftermarket packaging market size is USD 9.18 billion in 2025 and is projected to reach USD 11.26 billion by 2030.
Which material leads automotive parts packaging today?
Corrugated fiberboard is the largest material at 42.11% share in 2024, thanks to cost and recyclability advantages.
What segment grows fastest through 2030?
Protective films and tapes record the highest 6.91% CAGR because e-commerce shipping demands flexible component protection.
Which region delivers the quickest growth?
Asia-Pacific posts a 6.61% CAGR, lifted by India and Thailand’s expanding vehicle fleets and rapid e-commerce expansion.
Why are returnable containers gaining favor?
OEM sustainability mandates make reusable totes attractive by spreading cost across multiple cycles and cutting landfill fees, improving total ownership economics.
How concentrated is supplier power?
The market scores 6 out of 10 for concentration, as the top five firms capture just under half of global revenue, leaving room for regional specialists.
Page last updated on:


