Automotive OEM App Store Market Size and Share
Market Overview
| Study Period | 2019 - 2030 |
|---|---|
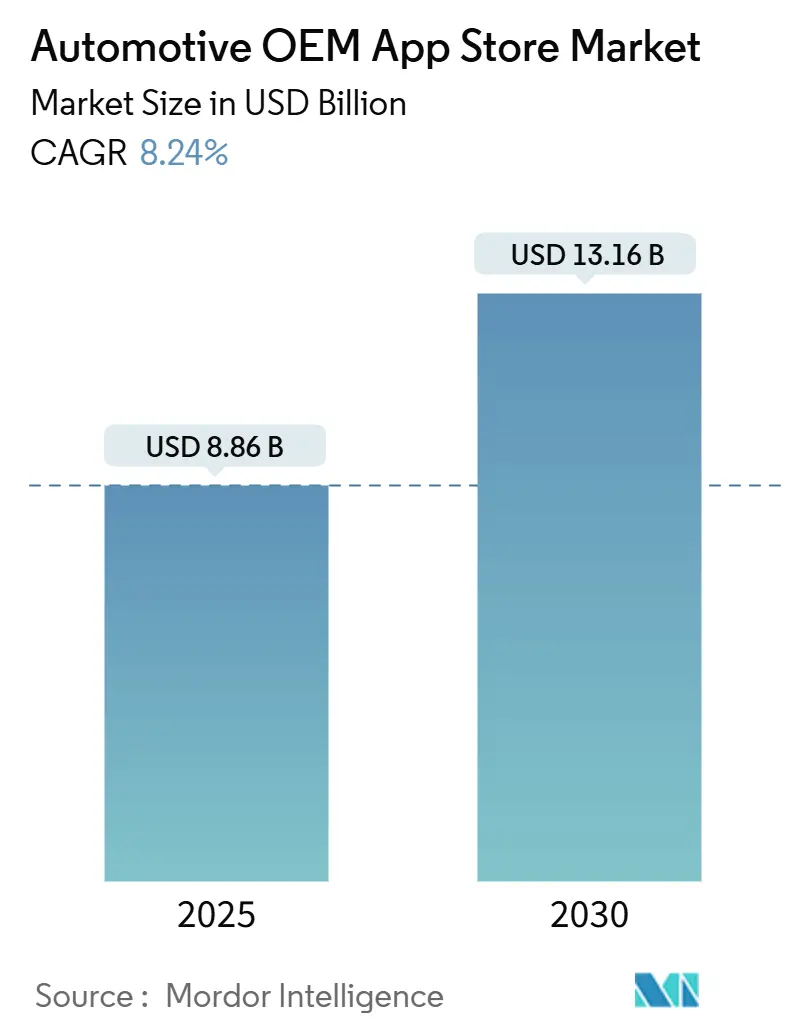
| Market Size (2025) | USD 8.86 Billion |
| Market Size (2030) | USD 13.16 Billion |
| Growth Rate (2025 - 2030) | 8.24% CAGR |
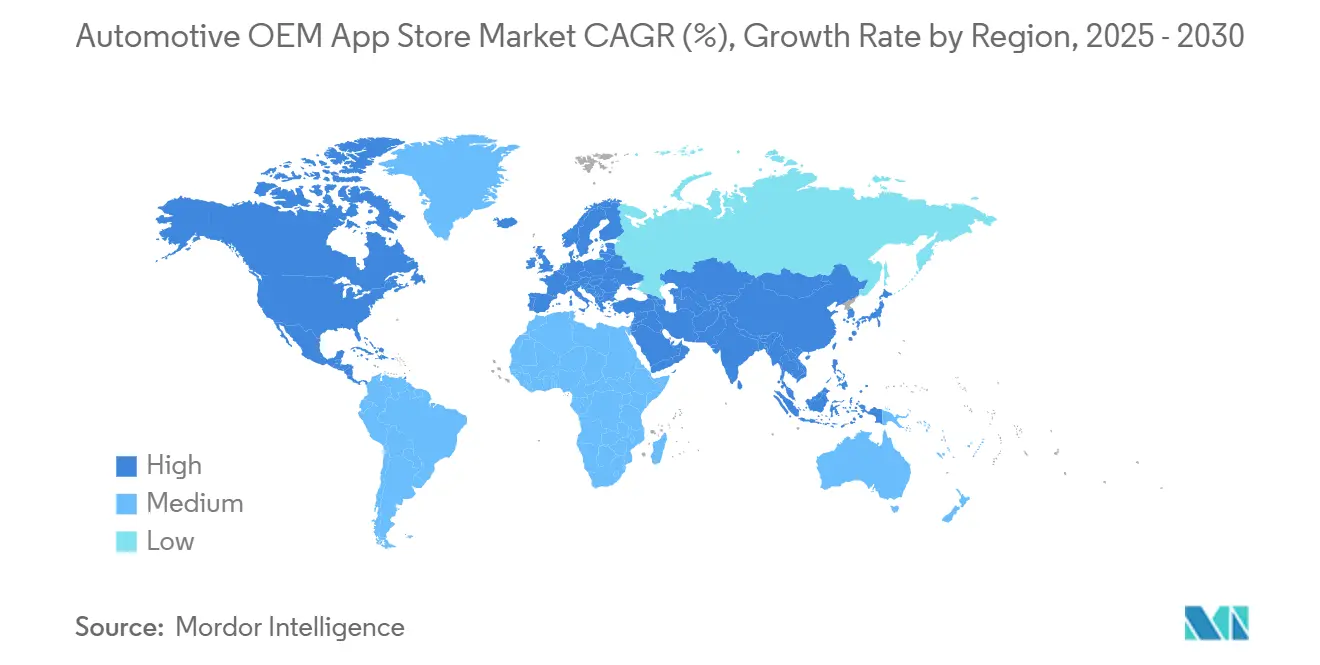
| Fastest Growing Market | Asia Pacific |
| Largest Market | North America |
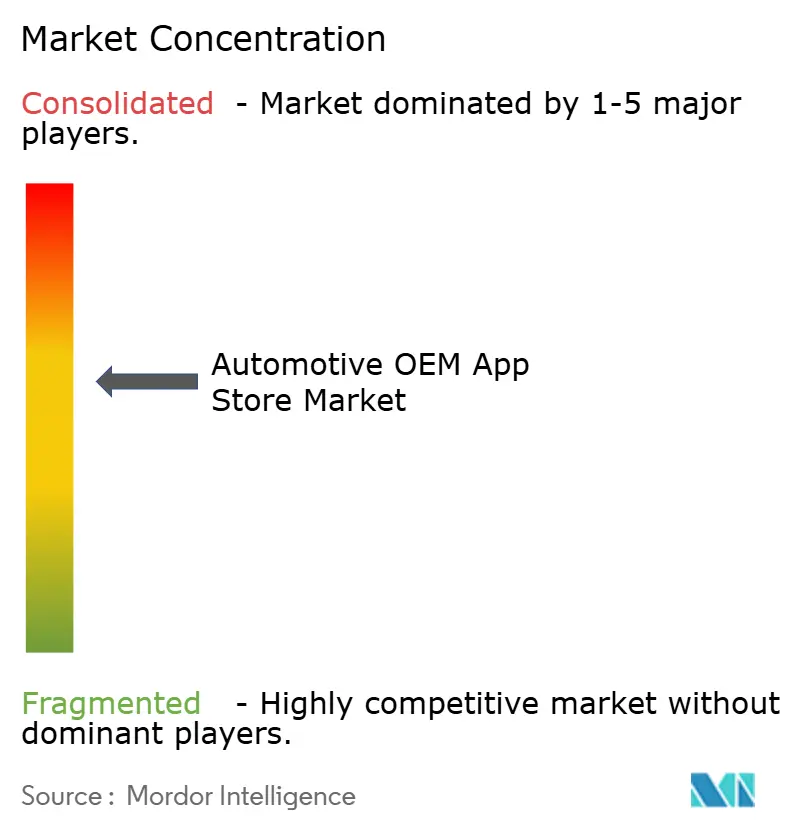
| Market Concentration | Medium |
Major Players
*Disclaimer: Major Players sorted in no particular order Image © Mordor Intelligence. Reuse requires attribution under CC BY 4.0. |
|
Automotive OEM App Store Market Analysis by Mordor Intelligence
The automotive OEM app store market size stood at USD 8.86 billion in 2025 and is forecast to reach USD 13.16 billion by 2030, advancing at an 8.24% CAGR. This uptrend reflects a decisive shift to software-defined vehicles, where in-car digital services drive brand stickiness and recurring revenue. North America leads early monetization thanks to mature connectivity, but Asia-Pacific is closing the gap as electric-vehicle momentum and pro-digital policies accelerate demand. Navigation apps still anchor consumer value, yet in-vehicle commerce and payment solutions are growing fastest, turning cars into transaction hubs. Third-party developers dominate code production, signaling OEM reliance on specialist expertise and open ecosystems. Meanwhile, cybersecurity mandates and driver-distraction ceilings create compliance headwinds that lengthen app approval cycles and raise development costs.
Key Report Takeaways
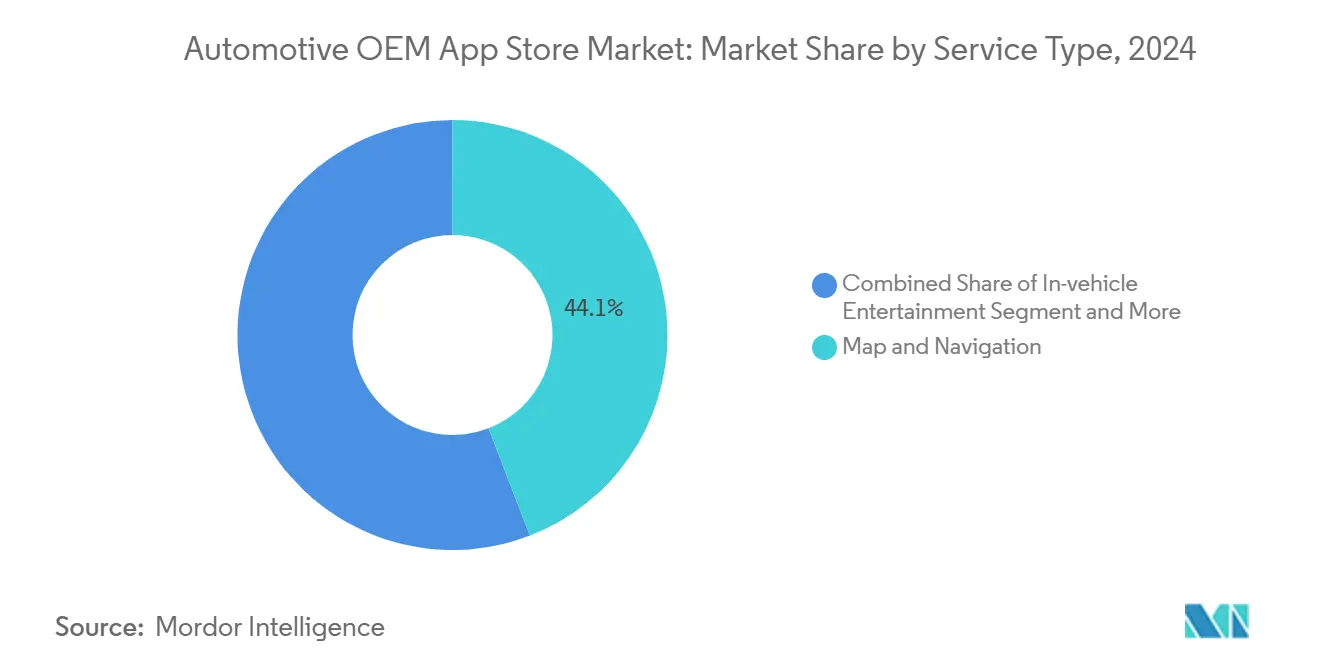
- By service type, map and navigation applications captured 44.13% of the automotive OEM app store market share in 2024, while payment and purchase services are projected to expand at a 12.76% CAGR through 2030.
- By development type, third-party and outsourced coding held a 67.24% share of the automotive OEM app store market size in 2024; in-house initiatives record the highest projected CAGR at 10.13% through 2030.
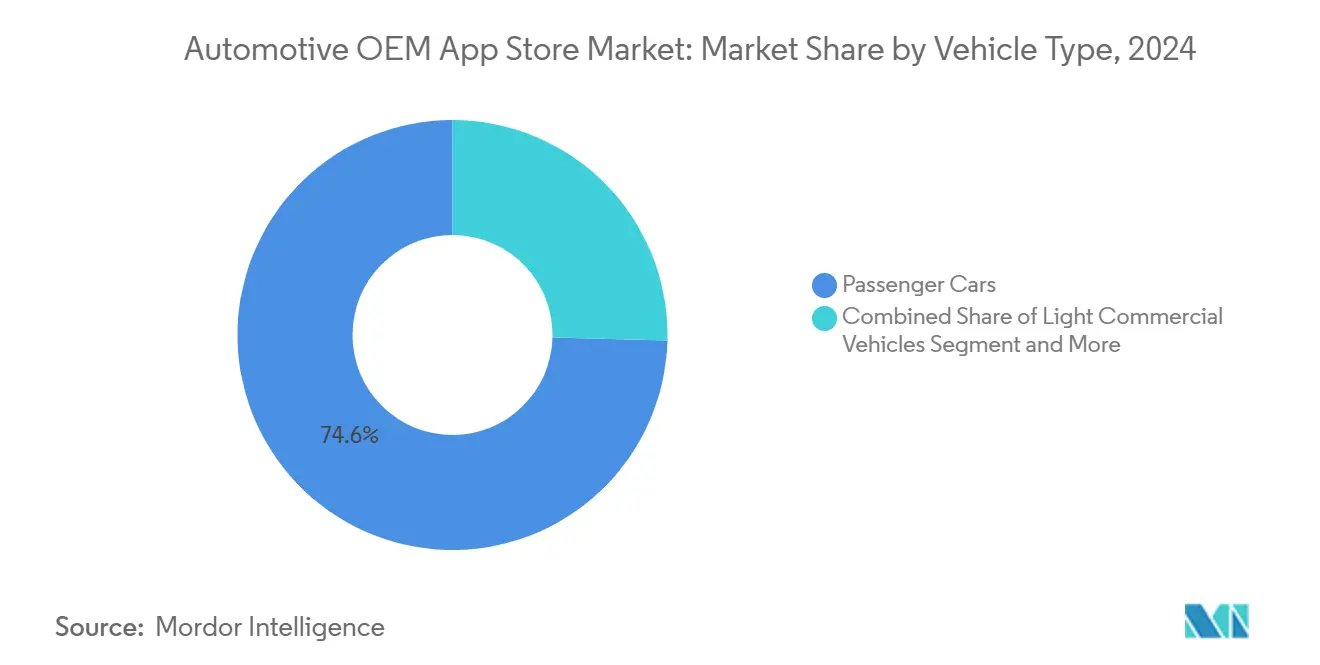
- By vehicle type, passenger cars commanded a 74.59% share of the automotive OEM app store market size in 2024, and light commercial vehicles are advancing at a 10.21% CAGR through 2030.
- By operating system, Android led with 75.65% share of the automotive OEM app store market size in 2024, whereas iOS adoption is rising at a 17.11% CAGR to 2030.
- By geography, North America accounted for 39.92% of the automotive OEM app store market share in 2024; Asia-Pacific posts the fastest regional CAGR at 12.34% through 2030.
Global Automotive OEM App Store Market Trends and Insights
Drivers Impact Analysis*
| Driver | (~) % Impact on CAGR Forecast | Geographic Relevance | Impact Timeline |
|---|---|---|---|
| Soaring Connected-Car Penetration | +2.8% | Global, with North America & China leading | Medium term (2-4 years) |
| Software-Defined Vehicles and Recurring Revenue | +2.1% | Global, particularly Europe and North America | Long term (≥ 4 years) |
| Third-Party App Availability | +1.4% | Global, strongest in APAC markets | Short term (≤ 2 years) |
| EU Data Act | +1.2% | Europe, with spillover to global standards | Medium term (2-4 years) |
| Digital Commerce and Payments | +0.9% | North America & Europe, expanding to APAC | Long term (≥ 4 years) |
| 5G/Edge APIs | +0.7% | Urban centers globally, led by Asia-Pacific | Medium term (2-4 years) |
| Source: Mordor Intelligence | |||
Soaring Connected-Car Penetration
Connected capability is reaching a tipping point, with nine out of ten new vehicles expected to ship online by 2030. As buyers rank digital features above traditional hardware, OEMs position high-quality app ecosystems as core purchase criteria. Larger connected fleets, in turn, magnetize more developers, creating network effects that raise platform stickiness. The economic upside also rests on data-monetization pathways, from usage-based insurance to contextual advertising, that ride atop always-on connectivity.
OEM Shift to Software-Defined Vehicles and Recurring Revenue
Manufacturers are transitioning from one-off sales toward lifetime digital relationships. Subscription bundles, over-the-air upgrades and feature unlocks shift cash flows into steady annuities. App stores become the storefront for this model, enabling continuous content refresh that elongates vehicle relevance. Organizationally, firms restructure around agile software teams, yet talent scarcity in cybersecurity and user-experience design remains a material bottleneck.
Android Ecosystem Accelerating Third-Party App Availability
A standardized Android automotive stack reduces porting friction, making it simpler for consumer-app developers to enter the cockpit. The result is a rising catalog of media, productivity, and commerce apps certified for multiple brands. Android's open-source architecture allows OEMs to customize while ensuring core compatibility, balancing manufacturer control with developer accessibility. However, dependency on a single platform raises strategic questions for OEMs wary of external data harvesting, leading some to explore non-Google forks and dual-OS strategies.
EU Data Act Opening In-Vehicle Data Access
From September 2025, European law compels manufacturers to expose in-vehicle data to owners and qualified third parties in machine-readable form. The mandate lowers barriers for independent software vendors eager to create personalized mobility services. Compliance, however, demands secure APIs, consent management, and harmonized data schemas, adding upfront engineering workload even as it enlarges the overall addressable market.
Restraints Impact Analysis*
| Restraint | (~) % Impact on CAGR Forecast | Geographic Relevance | Impact Timeline |
|---|---|---|---|
| Android and iOS Fragmentation | -1.8% | Global, particularly affecting developer resources | Short term (≤ 2 years) |
| Cyber-Security Bottlenecks | -1.5% | Global, with strictest impact in Europe and North America | Medium term (2-4 years) |
| Revenue-Share Conflicts | -0.9% | Global, concentrated in traditional automotive regions | Long term (≥ 4 years) |
| Driver-Distraction Regulatory Ceilings | -0.7% | North America and Europe leading, expanding globally | Medium term (2-4 years) |
| Source: Mordor Intelligence | |||
OS Fragmentation Between Android and iOS
Operating system fragmentation creates substantial development complexity and resource allocation challenges for app developers targeting automotive platforms. Developers must now certify code across two full-stack vehicle OSs plus multiple OEM forks. The burden includes divergent UI guidelines, screen formats, and sensor integrations. Smaller studios often lack funds for parallel pipelines, reducing overall app diversity and slowing iteration cycles. Fragmentation also complicates quality-assurance testing, pushing release cadences beyond smartphone norms.[1]Louisiana State University. "Understanding and Detecting Compatibility Issues in Android Auto Apps." arxiv.org
Cyber-Security / Privacy Approval Bottlenecks
UN Regulation 155 obliges every new vehicle platform to embed a cybersecurity management system from July 2024, mandating rigorous penetration tests and continuous monitoring[2]TÜV SÜD. "Mandatory Digital Shield for All New Cars This Year." tuvsud.com. Certification queues lengthen, especially for start-ups without embedded security teams. Differing regional schemas, from Europe’s UNECE rules to U.S. self-certification, further multiply paperwork, lifting barriers to market entry.
*Our forecasts treat driver/restraint impacts as directional, not additive. The impact forecasts reflect baseline growth, mix effects, and variable interactions.
Segment Analysis
By Service Type: Commerce-Centric Growth Redefines Core Utility
A 44.13% share in 2024 cements navigation as the historic anchor service, yet payment and purchase apps, scaling at 12.76% CAGR, signal the cockpit’s evolution into an e-commerce gateway. The automotive OEM app store market size for navigation remains robust, but commercial traction pivots toward frictionless fueling, tolling, and food-ordering integrations. Rising confidence in biometric authentication and tokenized card storage underpins this shift, as does improved location-based marketing that drives measurable merchant ROI. Entertainment offerings continue modest expansion, buoyed by premium audio hardware and longer commute times. Meanwhile, news and magazine consumption migrates to voice summaries, hampering growth.
The automotive OEM app store market fosters bundled service packages that blend routing with parking reservations and real-time charging availability, creating sticky subscription tiers. Payment orchestration partners embed APIs directly within OEM middleware, cutting checkout latency to single-digit seconds. As these capabilities mature, monthly active users and dwell times rise, reinforcing recurring revenue streams.


By Development Type: External Talent Pools Sustain Velocity
Third-party and outsourced teams delivered 67.24% of published apps in 2024, reflecting OEM reliance on specialized skill sets. This segment of the automotive OEM app store market expands at a 10.13% CAGR as Agile, DevOps, and security specialists remain scarce inside traditional automaker hierarchies. Outsourcing also de-risks fixed labor costs during platform transitions. In-house programs, though smaller, gain traction as marques view software as brand DNA. Firms replicate consumer-tech playbooks, dedicated platform teams, feature sprints, and continuous integration, to compress update cycles.
The automotive OEM app store industry prizes modular code ownership, prompting hybrid models that marry core IP protection with external accelerators for niche features. Partnership templates increasingly feature revenue-share clauses and shared DevSecOps toolchains that rationalize collaboration. Certification workflows converge onto common cloud-based validation suites, expediting approvals across multiple OEM tenants. This co-creation ethos fosters interoperability layers that ease future portability across emerging operating systems.
By Vehicle Type: Commercial Fleet Digitization Outpaces Volume Leaders
Passenger cars delivered 74.59% of automotive OEM app store market revenue in 2024 on a unit scale alone. Feature packs such as premium navigation, streaming, and gaming sustain steady upsell. Yet light commercial vehicles post the quickest 10.21% CAGR as fleet managers embrace telematics-driven cost optimization. Integrated routing, maintenance alerts, and driver scorecards convert directly into fuel savings and downtime reduction, simplifying ROI narratives.
Medium and heavy trucks adopt curated marketplaces focused on load-matching, tachograph compliance, and real-time tire health. The automotive OEM app store market size for commercial segments thereby captures higher per-vehicle software spend even at lower volumes. However, vocational-specific integrations and rigorous uptime SLAs heighten certification rigor, lengthening release cycles relative to passenger offerings.
By Operating System Type: Platform Control Defines Future Bargaining Power
Android powered 75.65% of deployed stores in 2024 due to open-source flexibility and broad device-side tooling. The automotive OEM app store market nonetheless witnesses iOS growing 17.11% CAGR on the back of ecosystem coherence that appeals to premium buyers. Cross-platform frameworks attempt to abstract code across both OSs, yet native performance optimizations still compel separate branches.
OEMs evaluate total cost of ownership beyond licensing fees, factoring data-sovereignty clauses and ad-tech dependencies. Some elect to strip Google Mobile Services in favor of bespoke equivalents, preserving user-data monetization potential. Conversely, iOS integration promises unified privacy guarantees aligned with rising consumer expectations. The outcome will reshape revenue splits and dictate long-term bargaining leverage over infotainment roadmaps.
Geography Analysis
North America generated the largest 39.92% revenue share in 2024, aided by high 4G/5G penetration, well-established card-on-file behavior, and regulatory consistency that supports rapid commercial rollouts. The automotive OEM app store market size in the region is forecast to progress at 11.91% CAGR to 2030 as subscription attach rates climb and bundled insurance-software packages mature. Early adoption of edge-accelerated services, such as real-time hazard alerts, further entrenches user engagement. Federal safety agencies maintain open channels for technology pilots, providing a permissive sandbox for advanced features.
Asia-Pacific records the fastest 12.34% CAGR, propelled by surging electric-vehicle sales and pro-digital policies that foster app-centric ecosystems. National industrial roadmaps bundle smart-city, charging, and autonomous-driving incentives, creating fertile ground for cockpit commerce. Domestic tech giants forge joint ventures with OEMs to own distribution, a trend particularly visible in China’s premium brands, where integrated super-apps synchronize mobility and lifestyle services. Rapid urbanization multiplies use cases for congestion-aware routing and micro-mobility linkages.
Europe contributes steady 10.31% CAGR, anchored by landmark regulations that institutionalize open data while mandating rigorous cybersecurity baselines. Regional OEM alliances, illustrated by cross-brand app marketplaces, preempt regulatory fragmentation and accelerate content scaling. Incentivized retrofits extend platform reach into existing fleets, boosting total addressable units. South America and Africa trail on infrastructure readiness but demonstrate potential via niche deployments in ride-hailing and agricultural logistics, respectively, signaling long-term runway once connectivity gaps close.

Competitive Landscape
Market share dispersion remains moderate: Google leads, followed by HARMAN Ignite Store, and Faurecia Aptoide Automotive. No single provider exerts gatekeeper control, and OEMs deliberately foster multivendor sourcing to retain negotiating power. Consolidation dynamics surface as suppliers acquire specialized storefronts to bundle hardware, middleware, and distribution channels; HARMAN illustrates the strategy by coupling its Ready CQuence DevOps suite with a turnkey marketplace.
Platform wars extend to developer-experience tooling. Winners standardize SDKs, monetize via predictable fee schedules, and streamline security vetting. Revenue models migrate from flat licensing toward transaction and data analytics tiers, aligning incentives with app success. Partnerships with fintechs broaden payment coverage, while collaborations with content studios fill premium infotainment catalogs.
Emerging disruptors leverage AI-accelerated edge chips that enable voice-first navigation, adaptive UIs, and gaming when parked. Automotive-native start-ups court underserved verticals, fleet fuel payment, insurance telematics, or vehicle-to-grid orchestration, unattractive to large consumer app houses. Regulatory shifts mandating data openness erode incumbents’ moat, allowing these niche specialists to scale quickly once compliance APIs open.
Automotive OEM App Store Industry Leaders
-
Google
-
Harman Ignite Store
-
Faurecia Aptoide Automotive
-
Visteon AllGo Store
-
Apple
- *Disclaimer: Major Players sorted in no particular order

Recent Industry Developments
- June 2025: NXP Semiconductors closed a USD 625 million purchase of TTTech Auto to deepen safety-critical software stacks that support evolving app-store monetization.
- April 2025: SoundHound AI aligned with Tencent to deliver multilingual voice assistants for forthcoming cockpit experiences.
- April 2025: ECARX and FAW Group launched the Hongqi Tiangong 06 SUV featuring an Antora 1000 Pro compute unit designed for high-bandwidth app delivery.
- January 2025: Sony Honda Mobility selected HERE’s cloud-native navigation SDK to underpin immersive guidance in the AFEELA electric sedan, integrating over-the-air map updates.


Global Automotive OEM App Store Market Report Scope
| Map and Navigation |
| In-vehicle Entertainment (podcast, music, audio) |
| News and Magazines |
| Payment and Purchase |
| Business / Productivity |
| Other Service Types (games, dealer locator, etc.) |
| In-house |
| Third-party / Outsourced |
| Passenger Cars |
| Light Commercial Vehicles |
| Medium and Heavy Commercial Vehicles |
| Android |
| iOS |
| North America | United States |
| Canada | |
| Rest of North America | |
| South America | Brazil |
| Argentina | |
| Rest of South America | |
| Europe | Germany |
| United Kingdom | |
| France | |
| Spain | |
| Italy | |
| Netherlands | |
| Russia | |
| Rest of Europe | |
| Asia-Pacific | China |
| India | |
| Japan | |
| South Korea | |
| ASEAN | |
| Australia | |
| New Zealand | |
| Rest of Asia-Pacific | |
| Middle East and Africa | United Arab Emirates |
| Saudi Arabia | |
| Turkey | |
| South Africa | |
| Nigeria | |
| Rest of Middle East and Africa |
| By Service Type | Map and Navigation | |
| In-vehicle Entertainment (podcast, music, audio) | ||
| News and Magazines | ||
| Payment and Purchase | ||
| Business / Productivity | ||
| Other Service Types (games, dealer locator, etc.) | ||
| By Development Type | In-house | |
| Third-party / Outsourced | ||
| By Vehicle Type | Passenger Cars | |
| Light Commercial Vehicles | ||
| Medium and Heavy Commercial Vehicles | ||
| By Operating System Type | Android | |
| iOS | ||
| By Geography | North America | United States |
| Canada | ||
| Rest of North America | ||
| South America | Brazil | |
| Argentina | ||
| Rest of South America | ||
| Europe | Germany | |
| United Kingdom | ||
| France | ||
| Spain | ||
| Italy | ||
| Netherlands | ||
| Russia | ||
| Rest of Europe | ||
| Asia-Pacific | China | |
| India | ||
| Japan | ||
| South Korea | ||
| ASEAN | ||
| Australia | ||
| New Zealand | ||
| Rest of Asia-Pacific | ||
| Middle East and Africa | United Arab Emirates | |
| Saudi Arabia | ||
| Turkey | ||
| South Africa | ||
| Nigeria | ||
| Rest of Middle East and Africa | ||


Key Questions Answered in the Report
How large is the automotive OEM app store market today?
It generated USD 8.86 billion in 2025 and is set to reach USD 13.16 billion by 2030.
Which app category is growing fastest inside connected vehicles?
Payment and purchase services, posting a forecast 12.76% CAGR on rising in-car commerce demand.
Which region is expanding quickest for in-vehicle app platforms?
Asia-Pacific, expected to grow at 12.34% CAGR through 2030 on strong electric-vehicle uptake.
Who holds the largest share of automotive app stores?
Google currently leads with 24%, though the field remains moderately fragmented.
What regulation most affects cockpit app security?
UN Regulation 155, which enforces cybersecurity management for every new vehicle released since July 2024.
How do OEMs monetize post-sale software?
Through subscription tiers, over-the-air feature unlocks and transaction fees inside proprietary marketplaces.
Page last updated on:


