Automotive Light Bars Market Size and Share
Market Overview
| Study Period | 2019 - 2030 |
|---|---|
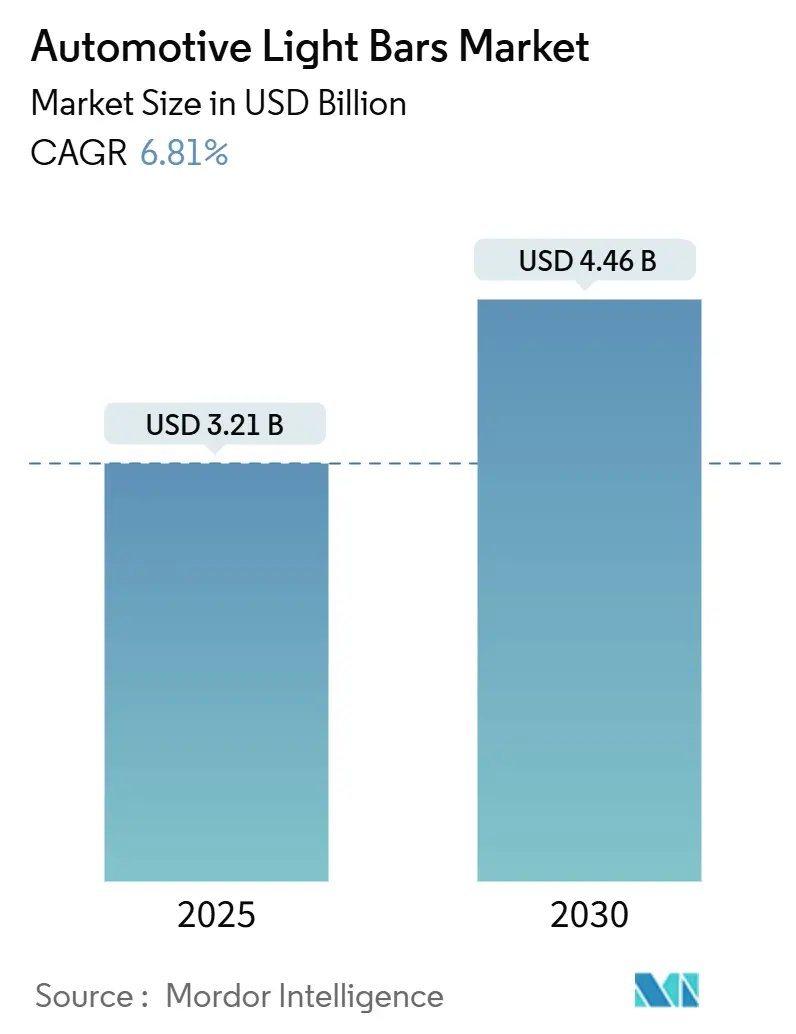
| Market Size (2025) | USD 3.21 Billion |
| Market Size (2030) | USD 4.46 Billion |
| Growth Rate (2025 - 2030) | 6.81% CAGR |
| Fastest Growing Market | Asia Pacific |
| Largest Market | Asia Pacific |
| Market Concentration | Medium |
Major Players *Disclaimer: Major Players sorted in no particular order Image © Mordor Intelligence. Reuse requires attribution under CC BY 4.0. | |
Automotive Light Bars Market Analysis by Mordor Intelligence
The automotive light bars market size stood at USD 3.21 billion in 2025 and is forecast to reach USD 4.46 billion by 2030, advancing at a 6.81% CAGR. Demand scales with regulations for improved daytime visibility, continued leaps in LED efficacy, and rapid electrification of commercial fleets that depend on low-draw auxiliary lighting. LED modules achieve cost-parity with halogen while delivering higher brightness and lower power consumption, prompting OEMs to embed light bars in factory trims. Asia-Pacific sustains leadership on the back of China’s new-energy vehicle boom and India’s record commercial-vehicle output. Aftermarket channels outpace OEM sales as owners retrofit older vehicles with customizable multi-directional bars for off-road recreation and last-mile delivery. Competitive differentiation now centers on microLED arrays, over-the-air personalization, and ADAS-sensor co-packaging that meet strict EMC rules in electric platforms.
Key Report Takeaways
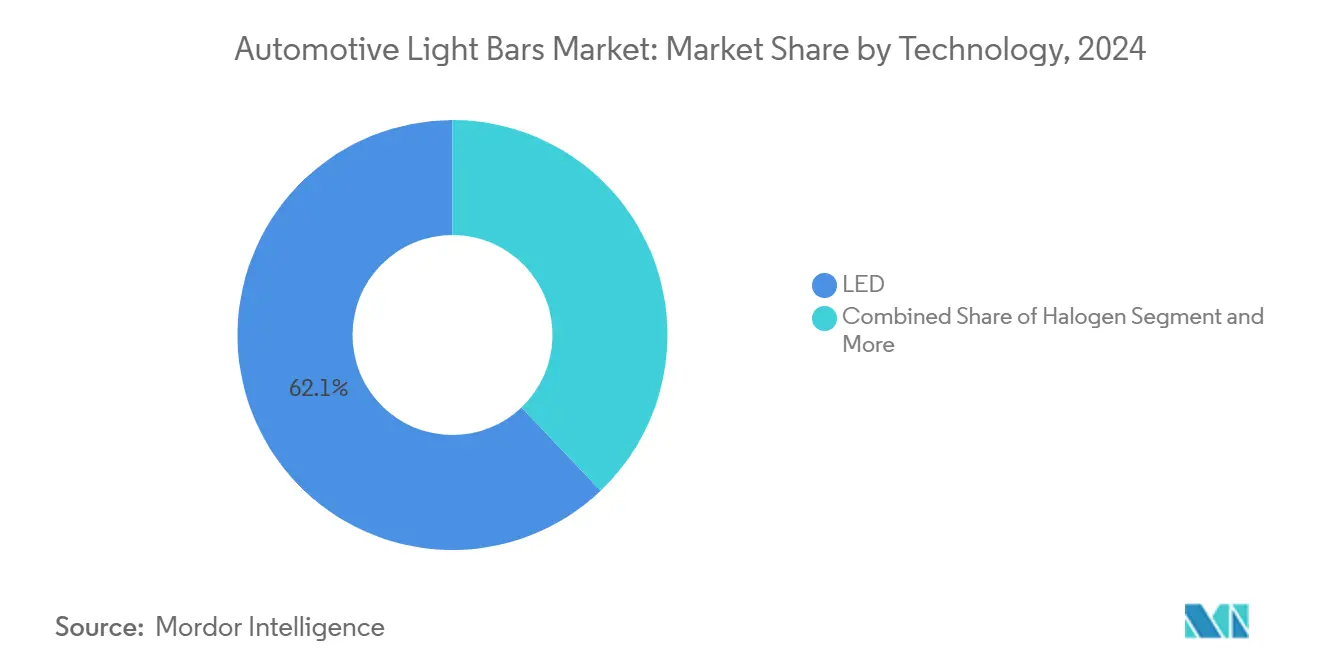
- By technology, LED accounted for 62.11% of the automotive light bars market share in 2024 while expanding at an 8.32% CAGR through 2030.
- By installation, front-mounted units held 52.31% of the automotive light bars market share in 2024; side installations are projected to post the fastest 8.98% CAGR to 2030.
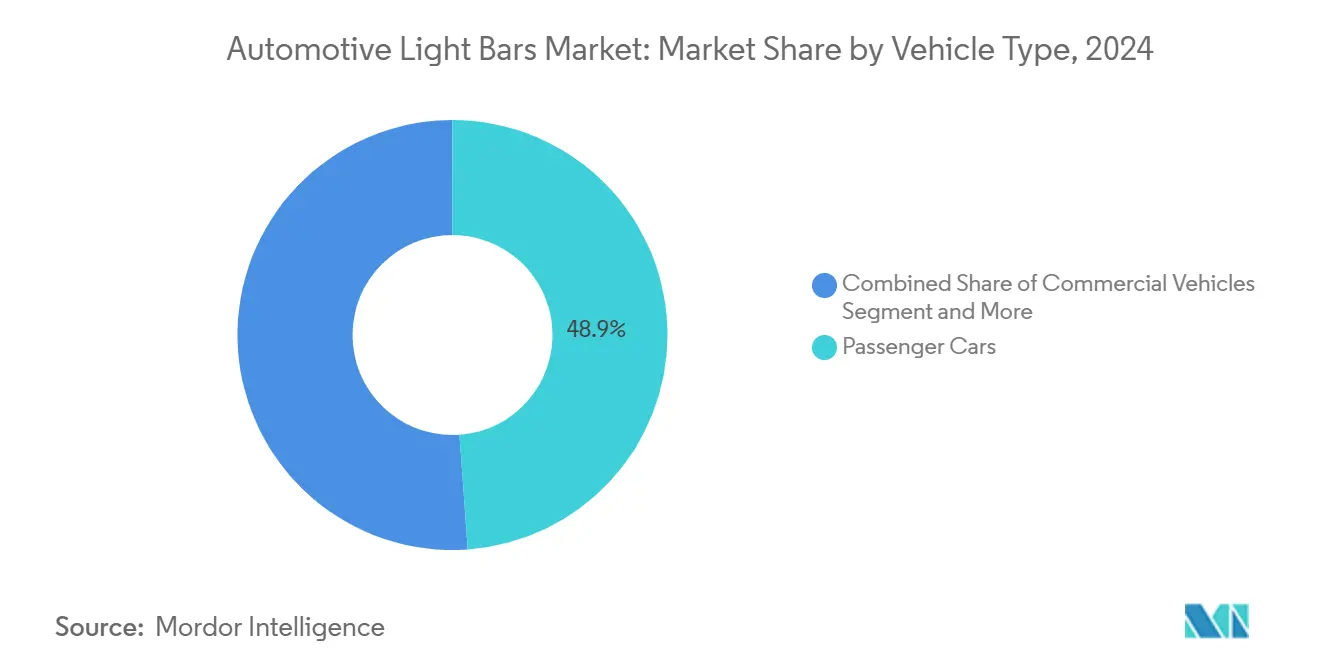
- By vehicle type, passenger cars led 48.87% of the automotive light bars market share in 2024, whereas commercial vehicles recorded the highest 8.13% CAGR during the outlook period.
- By sales channel, OEMs captured 57.61% of the automotive light bars market share in 2024 shipments, but the aftermarket advances at an 8.24% CAGR on retrofit demand.
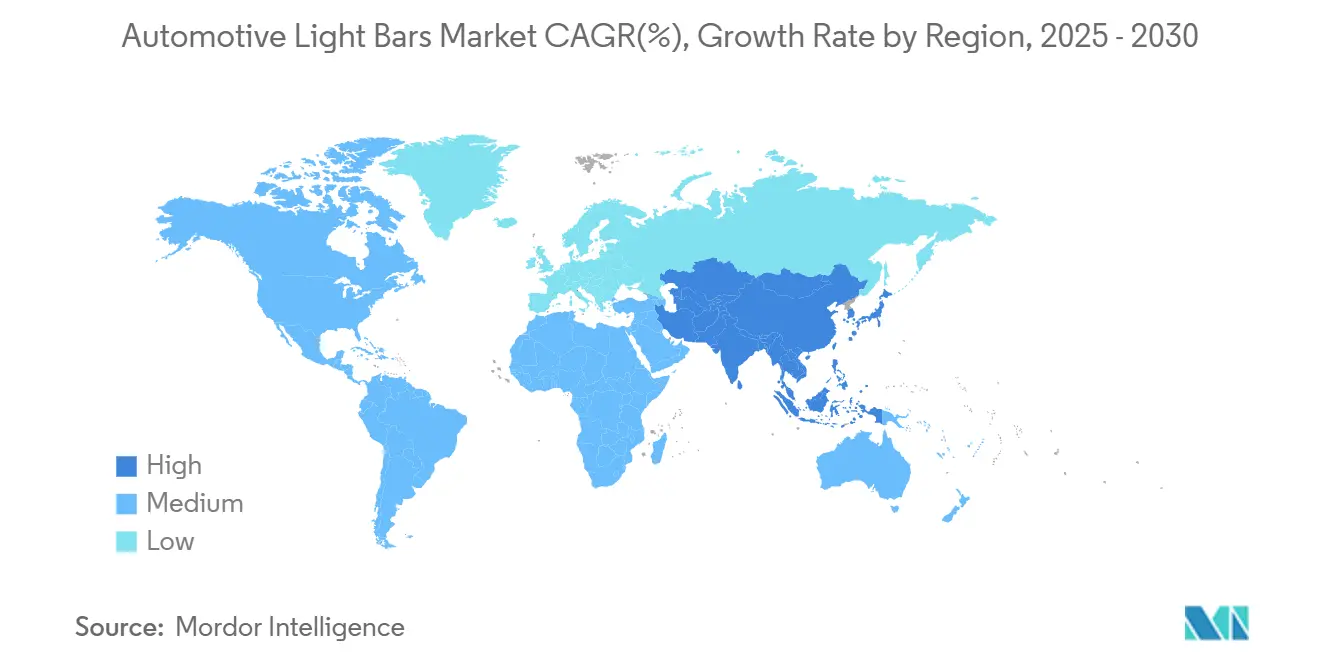
- By geography, Asia-Pacific commanded 35.31% of the automotive light bars market share in 2024 and is poised for a 7.59% CAGR through 2030.
Market Trends and Insights
Drivers Impact Analysis of Automotive Light Bars Market*
| Driver | (~) % Impact on CAGR Forecast | Geographic Relevance | Impact Timeline |
|---|---|---|---|
| LED Cost/Efficacy Driving OEM Adoption | +1.8% | Global | Long term (≥ 4 years) |
| Rising Use in Off-Road Recreational Vehicles | +1.2% | North America and Asia-Pacific, spill-over to Europe | Medium term (2-4 years) |
| Daytime Running Light Regulations Expanding | +1.1% | Europe and Canada, expanding to Asia-Pacific | Short term (≤ 2 years) |
| Up-Fit Demand in Last-Mile Delivery Fleets | +0.9% | Global urban centers, Asia-Pacific and North America | Medium term (2-4 years) |
| Integration with ADAS Sensor Housings | +0.8% | Global, led by developed markets | Medium term (2-4 years) |
| OTA Lighting Personalization Features Emerging | +0.6% | Premium segments in North America, Europe, China | Long term (≥ 4 years) |
| Source: Mordor Intelligence | |||
LED Cost/Efficacy Curve Driving OEM Adoption
High-volume chip output and advanced phosphor coatings push LED efficacy beyond 200 lm/W, giving automakers a direct route to fleet fuel-economy credits while enhancing styling freedom[1]“Off-Road Lighting Solutions 2024,”, HELLA GmbH & Co. KGaA, hella.com. Micro-optics enable pencil-thin bars that tuck inside body lines, lowering drag relative to roof-rack units. OEMs integrate smart drivers that dim during idle‐stop to conserve battery SOC in hybrids, and software updates unlock new beam signatures after purchase. Suppliers equipped with in-house chip-on-board lines secure multi-year platforms, compressing time-to-market.
Growing Penetration of Off-Road Recreational Vehicles
Off-road UTV and ATV sales lift demand as enthusiasts seek rugged LED bars that survive high-vibration terrain while drawing minimal current from compact battery packs[2]“Automotive Lighting Innovation Press Kit 2025,”, ams OSRAM, ams-osram.com. Lightweight aluminum housings and quick-release mounting kits let riders swap beam patterns for trail, mud, or desert events. Manufacturers now bundle IP69K sealing, smart-charging interfaces, and Bluetooth apps that sync brightness to vehicle speed. Enthusiast social media showcases “360-degree light builds,” fueling peer-to-peer adoption and anchoring future aftermarket growth.
Rapid Up-Fit Demand in Last-Mile Delivery Fleets
E-commerce players re-equip vans with narrow-profile bars illuminating curbs and loading bays without draining 400 V traction batteries[3]“Upfitting Guidance for Electric Delivery Fleets,”, U.S. FMCSA, fmcsa.dot.gov. Modular harness kits snap into existing up-fitter junction blocks, cutting install time below two hours. Fleet telematics now polls light-bar diagnostics, flagging failed pixels before regulatory inspections. Suppliers packaging bar, mount, harness, and CAN bus gateway in one SKU win preferred-vendor status in global RFPs.
Over-The-Air Lighting Personalization Features
Premium brands launch cloud stores that sell seasonal “light signatures,” letting owners swap bar animations during holidays. Digital OLED-on-foil sheets shrink to 0.2 mm, curving along fenders and disappearing when off. Secure OTA protocols certify updates under UNECE 155 cyber rules, pulling lightning into the software revenue stack. This converts light bars from static hardware to a living UX canvas.
Restraints Impact Analysis of Automotive Light Bars Market*
| Restraint | (~) % Impact on CAGR Forecast | Geographic Relevance | Impact Timeline |
|---|---|---|---|
| Counterfeit Imports Eroding ASPs | -1.1% | Produced in Southeast Asia, sold worldwide | Medium term (2-4 years) |
| Rare-Earth Phosphor Price Volatility | -0.8% | Global, supply risk centered in China | Short term (≤ 2 years) |
| EMI/EMC Compliance Issues in EVs | -0.7% | Global EV markets, stricter in Europe & North America | Medium term (2-4 years) |
| Glare Regulations Limiting Lumen Output | -0.5% | North America and Europe, expanding worldwide | Long term (≥ 4 years) |
| Source: Mordor Intelligence | |||
Counterfeit Low-Cost Imports Eroding ASPs
Uncertified bars flood online marketplaces, mimicking ETL logos but failing CISPR 25 noise limits, causing dash-camera interference and customer complaints[4]“LED Headlamp Compliance Interpretation,”, National Highway Traffic Safety Administration, nhtsa.gov. Legitimate brands embed NFC tags that link to authenticity apps, yet port inspections remain porous. Falling street prices undermine channel profits and raise warranty claims when fake units short-circuit. Collective industry action pushes for stronger customs testing, but rollout proves slow.
EMI/EMC Compliance Challenges in EV Platforms
High-voltage traction inverters generate broadband noise; meanwhile, LED switch-mode drivers radiate harmonics that can trip ADAS fault codes. Suppliers add ferrite beads, multilayer shields, and spread-spectrum PWM, adding USD 5 per unit. Validation cycles lengthen as OEMs retest complete vehicle EMC matrices across temperature sweeps. Certification labs see backlogs, which are delaying SOP for new electric trucks.
*Our forecasts treat driver/restraint impacts as directional, not additive. The impact forecasts reflect baseline growth, mix effects, and variable interactions.
Automotive Light Bars Market Segment Analysis
By Technology:
LED Strengthens CommandLED devices controlled 62.11% of 2024 revenue, and that slice widens as unit shipments post an 8.32% CAGR through 2030. Manufacturing scale cuts die cost, allowing pixel-grade microLED arrays that join adaptive driving-beam applications without adding ballast weight. Halogen sees shrinking replacement pockets mainly in emerging economies, whereas HID remains a niche for emergency fleets needing extreme lux. Energy-efficiency rules in Europe and California further tilt fleet buyers to LED. Suppliers that vertically integrate phosphor deposition and driver ICs capture better gross margins and faster design cycles.
The technology lens also highlights evolving optical control. Digital micro-shutters enable road-projection icons that warn cyclists, and software unlocks functions remotely, blending hardware with service revenue. As OEMs synchronize lighting with autonomous perception stacks, technology-qualified vendors gain design-win dominance across multiple vehicle platforms in the automotive light bars market.


By Installation:
Side Mounting Rises FastestFront bars still counted for 52.31% of 2024 deployments, reflecting decades-long safety emphasis, but side installations now chart the quickest 8.98% CAGR. New urban-delivery van rules demand lateral conspicuity within 5 m, steering fleets to fit slim bars under drip rails.
Growth also rides on recreational truck culture, where side bars complement rock lights for night trail runs. Manufacturers engineer low-profile housings with breakaway clips that preserve aerodynamics and crash performance. The trend forces lighting suppliers to broaden accessory brackets and capture additional revenue per vehicle in the automotive light bars market.
By Vehicle Type:
Commercial Vehicles AcceleratePassenger cars delivered 48.87% of 2024 revenue, yet commercial vehicles sprint ahead at an 8.13% CAGR as e-commerce fleets double yearly stops. Electric CV platforms provide stable 12 V DC-DC rails that accommodate multi-row bars without excessive draw. Fleet buyers bundle bars with telematics, enabling predictive maintenance and uptime gains.
Meanwhile, municipal buses prefer high-lumen roof-edge bars for depot safety. Suppliers adapt corrosion-resistant coatings for salt-spray climates, broadening geographic addressability. Commercial-vehicle regulation weights easily justify investment, positioning this segment as the prime growth lever within the automotive light bars market.
By Sales Channel:
Aftermarket Momentum BuildsOEM fitments owned 57.61% of 2024 shipments, yet aftermarket sales grow at an 8.24% CAGR, mirroring consumer appetite for personalized looks and functional upgrades. Lift-kit culture, overlanding expeditions, and DIY electrification projects drive the automotive light bars market size boost from the aftermarket. Retailers bundle wiring looms with relay boxes, lowering the install hurdle for weekend mechanics.
OEMs still dominate in-cabin integration and warranty coverage, but standard 30-pin auxiliary ports emerging on 2025 pickups simplify dealer-approved accessory sales. Thus, the competitive landscape shifts toward brands that can straddle factory and retail, offering tuned optics for each channel without cannibalization inside the automotive light bars market.
Geography Analysis
APAC Automotive Light Bars Market
Asia-Pacific held 35.31% of global revenue in 2024 and is predicted to compound at 7.59% through 2030. China’s 50% NEV sales mix heightens demand for low-wattage bars compatible with high-voltage architectures, while India’s commercial-vehicle build eclipsed 1 million units in 2024, opening large retrofit pockets. Japan spearheads miniaturized optics that influence global homologation trends, anchoring technology exports.
North America Automotive Light Bars Market
North America ranks second. Recreational off-road culture, plus FMCSA visibility mandates for Class 8 trucks, push unit volumes as OEMs standardize roof-integrated light bars on special-edition pickups. Canadian daylight-running requirements close cross-border spec gaps, letting suppliers ship uniform SKUs across NAFTA. Robust e-commerce networks convert courier depots into bulk installers, fueling aftermarket acceleration.
Europe and Middle East Automotive Light Bars Market
Europe sustains steady volume under UNECE glare and EMC rules that favor adaptive dimming and tight optical beam shaping. Automotive majors embed bars within connected-car suites, and the EU Green Deal policy rewards components that trim energy loss. Eastern European contract manufacturers scale cost-effective assemblies, feeding Western OEMs and exporting to the Middle East, deepening regional supply-chain interlocks in the automotive light bars market.

Competitive Landscape
Competition in the automotive light bars market pivots on integrated solutions delivering lighting, sensing, and software. Tier-1 majors like Ams OSRAM invest in microLED wafer fabs, enabling pixel-control ADB bars while offering turnkey EMC consulting, securing platform contracts with German automakers. Specialist brands court overlanders with mil-spec aluminum housings and lifetime warranties, cultivating community loyalty.
Vertical integration evolves: LED die suppliers acquire optics molders; harness makers partner with cloud-software firms to roll out OTA beam-pattern libraries. Supply-chain resilience gains weight after 2024 phosphor shocks, prompting multiyear deals directly with rare-earth refiners. Manufacturers boasting closed-loop recycling for aluminum extrusions score ESG points with fleet tenders.
M&A heats: First Brands Group’s 2024 buyout of Lumileds expands chip-to-fixture breadth, while Hankook’s Hanon Systems acquisition augments electronic-thermal management synergy. Competitive gaps now center on certifying bars across UNECE, FMVSS, and upcoming ASEAN standards simultaneously, favoring multiregional labs and shortening customer launch calendars inside the automotive light bars market.
Automotive Light Bars Industry Leaders
OSRAM GmbH.
Valeo SA
Koito Manufacturing Co., Ltd.
Stanley Electric Co., Ltd.
FORVIA SE
- *Disclaimer: Major Players sorted in no particular order
Automotive Light Bars Market Companies Covered in this Report
- Osram Continental GmbH
- Hella GmbH & Co. KGaA
- Valeo SA
- Koito Manufacturing Co., Ltd.
- Stanley Electric Co., Ltd.
- Marelli S.p.A.
- Truck-Lite Co. LLC
- Grote Industries LLC
- Rigid Industries
- Baja Designs
- KC HiLiTES Inc.
- JW Speaker Corporation
- Vision X Lighting
- Lazer Lamps Ltd.
- Whelen Engineering Company Inc.
- Diode Dynamics LLC

Recent Industry Developments in Automotive Light Bars Market
- September 2024: ams OSRAM (SIX: AMS), a global leader in intelligent emitters and sensors, announces the next step in the development of its ALIYOS™ LED-on-foil technology: the introduction of an innovative approach to integrate LED foils into automotive applications.
- August 2024: ams OSRAM has introduced the OSRAM NIGHT BREAKER™ LED SMART, an upgraded LED retrofit lamp. With enhanced power and a compact design, it enables cost-effective conversion from halogen to road-approved OSRAM LED technology. It replaces H4 and H7 lamps, fitting cars, motorhomes, and motorcycles.


Global Automotive Light Bars Market Report Scope
Segmentation Overview
| Halogen |
| HID |
| LED |
| Front |
| Rear |
| Side |
| Others |
| Passenger Cars |
| Commercial Vehicles |
| Buses and Coaches |
| OEMs |
| Aftermarket |
| North America | United States |
| Canada | |
| Rest of North America | |
| South America | Brazil |
| Argentina | |
| Rest of South America | |
| Europe | United Kingdom |
| Germany | |
| Spain | |
| Italy | |
| France | |
| Russia | |
| Rest of Europe | |
| Asia-Pacific | India |
| China | |
| Japan | |
| South Korea | |
| Rest of Asia-Pacific | |
| Middle East and Africa | United Arab Emirates |
| Saudi Arabia | |
| Turkey | |
| Egypt | |
| South Africa | |
| Rest of Middle East and Africa |
| By Technology | Halogen | |
| HID | ||
| LED | ||
| By Installation | Front | |
| Rear | ||
| Side | ||
| Others | ||
| By Vehicle Type | Passenger Cars | |
| Commercial Vehicles | ||
| Buses and Coaches | ||
| By Sales Channel | OEMs | |
| Aftermarket | ||
| By Geography | North America | United States |
| Canada | ||
| Rest of North America | ||
| South America | Brazil | |
| Argentina | ||
| Rest of South America | ||
| Europe | United Kingdom | |
| Germany | ||
| Spain | ||
| Italy | ||
| France | ||
| Russia | ||
| Rest of Europe | ||
| Asia-Pacific | India | |
| China | ||
| Japan | ||
| South Korea | ||
| Rest of Asia-Pacific | ||
| Middle East and Africa | United Arab Emirates | |
| Saudi Arabia | ||
| Turkey | ||
| Egypt | ||
| South Africa | ||
| Rest of Middle East and Africa | ||


Key Questions Answered in the Report
What is the 2025 value of the automotive light bars market?
It reached USD 3.21 billion in 2025.
Which technology holds the largest share?
LED accounted for 62.11% of 2024 revenue and continues to grow fastest.
Which region leads demand?
Asia-Pacific commanded 35.31% of 2024 global revenue and is set for the highest 7.59% CAGR.
Why are side-mounted light bars gaining popularity?
New visibility regulations and off-road enthusiasts drive an 8.98% CAGR for side installations by 2030.
How fast is the aftermarket segment expanding?
Aftermarket sales are rising at an 8.24% CAGR as owners retrofit vehicles with customizable lighting.
Page last updated on:


