Automatic Checkweigher Market Size and Share
Market Overview
| Study Period | 2019 - 2030 |
|---|---|
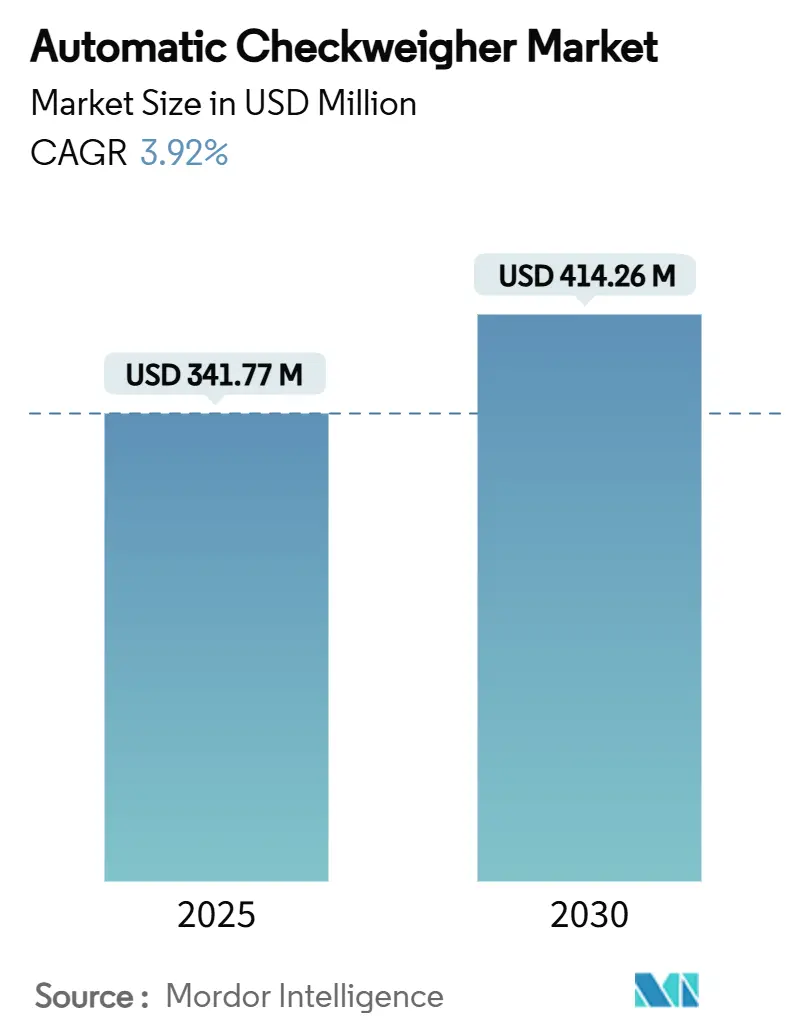
| Market Size (2025) | USD 341.77 Million |
| Market Size (2030) | USD 414.26 Million |
| Growth Rate (2025 - 2030) | 3.92% CAGR |
| Fastest Growing Market | Asia Pacific |
| Largest Market | Asia Pacific |
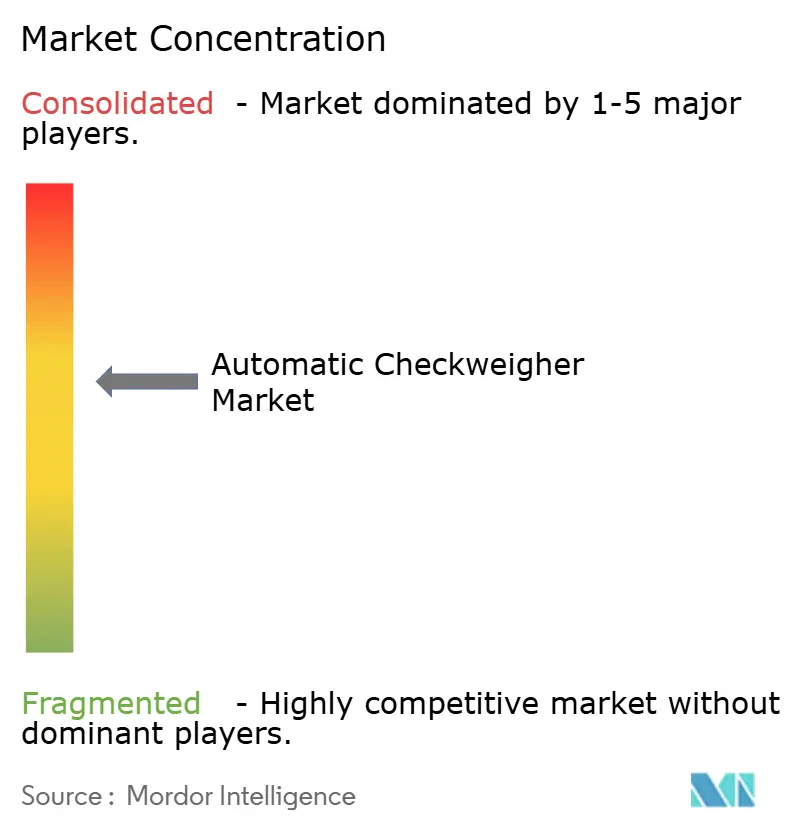
| Market Concentration | Medium |
Major Players
*Disclaimer: Major Players sorted in no particular order Image © Mordor Intelligence. Reuse requires attribution under CC BY 4.0. |
|
Automatic Checkweigher Market Analysis by Mordor Intelligence
The global automatic checkweigher market size reached USD 341.77 million in 2025 and is forecast to expand to USD 414.26 million by 2030, reflecting a 3.92% CAGR through the period. The measured growth trajectory masks sweeping structural shifts as manufacturers embed precision weighing deeper into fully automated, data-rich production ecosystems. Tightening global regulations, rapid packaging-line automation and rising e-commerce parcel volumes collectively raise demand for high-speed, high-accuracy inline inspection. Combination inspection platforms that pair checkweighing with metal detection or X-ray increasingly displace standalone units, enabling one-pass compliance while lowering total footprint. Asia Pacific leads adoption through synchronized gains in food processing and electronics manufacturing capacity, whereas North American and European operators prioritize connectivity features that integrate with MES and ERP environments. Across regions, suppliers differentiate less on base hardware and more on software, remote diagnostics and predictive maintenance services that protect uptime and improve overall equipment effectiveness, reinforcing a gradual, technology-led consolidation of the vendor landscape.
Key Report Takeaways
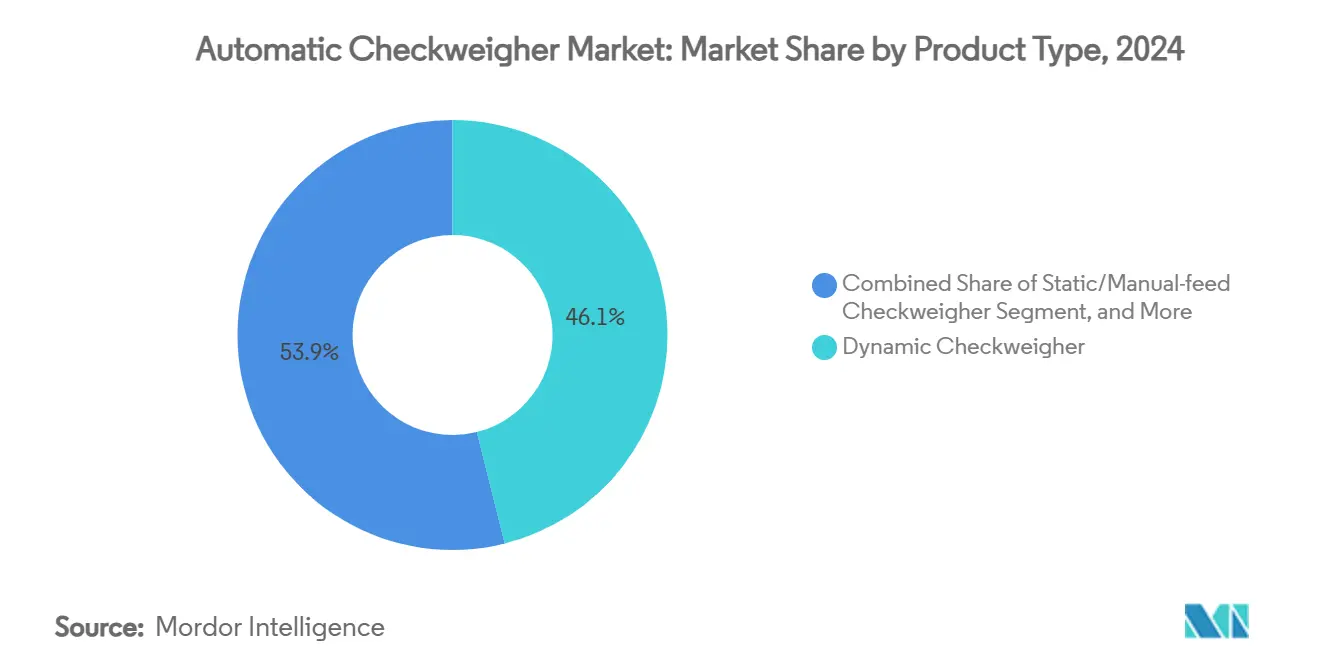
- By product type, dynamic units held 46.1% of automatic checkweigher market share in 2024, while combination systems are projected to rise at a 4.4% CAGR to 2030.
- By throughput speed, the 201–400 ppm tier accounted for 49.5% of the automatic checkweigher market size in 2024 and the >400 ppm tier is advancing at a 4.5% CAGR through 2030.
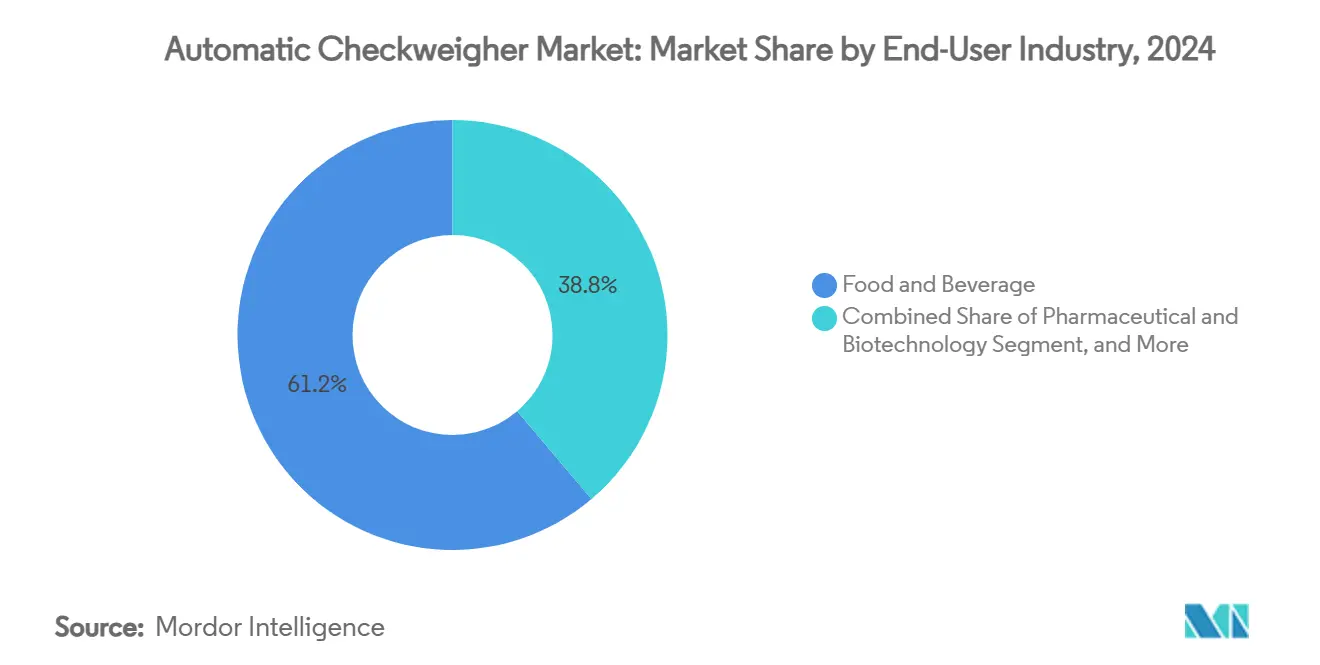
- By end-user industry, food and beverage retained 61.2% automatic checkweigher market share in 2024, whereas logistics and parcel applications are set to grow at a 4.2% CAGR over the forecast window.
- By system integration, stand-alone installations represented 55.3% of the automatic checkweigher market size in 2024, yet fully integrated systems are forecast to post a 4.1% CAGR.
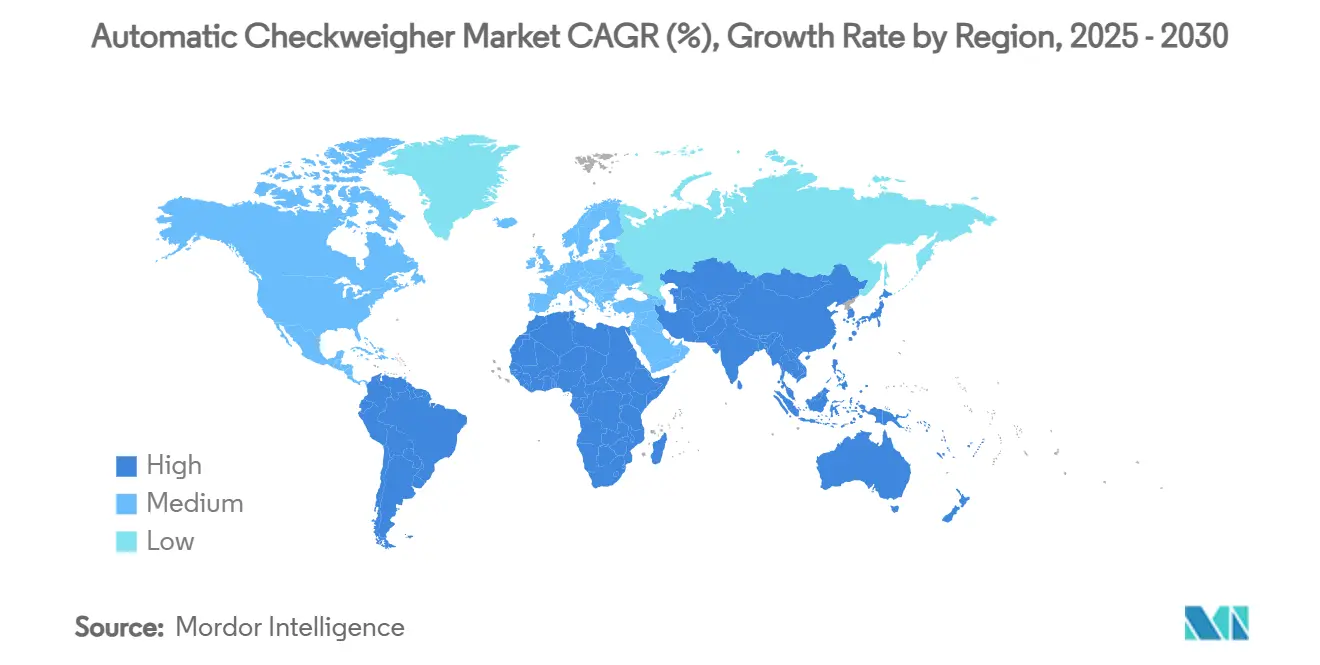
- By geography, Asia Pacific commanded 38.4% of global revenue in 2024 and is poised to expand at a 3.9% CAGR, outpacing all other regions to 2030.
Global Automatic Checkweigher Market Trends and Insights
Drivers Impact Analysis*
| Driver | (~) % Impact on CAGR Forecast | Geographic Relevance | Impact Timeline |
|---|---|---|---|
| Stringent food and pharma weight-legislation compliance | +1.2% | Global with EU and FDA leadership | Long term (≥ 4 years) |
| Rapid packaging-line automation to curb labor costs | +0.8% | North America & APAC core | Medium term (2-4 years) |
| Rising packaged-food and beverage throughput worldwide | +0.6% | Global, concentrated in emerging markets | Medium term (2-4 years) |
| Industry-4.0 enabled remote OEE monitoring | +0.4% | APAC core, spill-over to EU | Short term (≤ 2 years) |
| Micro-fulfilment centers demanding <1 kg accuracy | +0.3% | North America & EU urban centers | Short term (≤ 2 years) |
| Hygienic wash-down designs after allergen lawsuits | +0.2% | Global food processing regions | Long term (≥ 4 years) |
| Source: Mordor Intelligence | |||
Stringent Food and Pharma Weight-Legislation Compliance
Regulatory agencies have tightened permissible error bands, turning compliance into a primary purchase trigger rather than a secondary benefit of modernization. The FDA’s Current Good Manufacturing Practice rules stipulate that weighing devices must be installable, cleanable and maintainable without compromising drug quality, nudging pharmaceutical plants toward higher-accuracy checkweighers that consistently achieve ±0.2 g precision at 280 ppm line speeds.[1]Center for Drug Evaluation and Research, “Questions and Answers on Current Good Manufacturing Practice Requirements | Equipment,” fda.gov In parallel, EU Directive 2014/32/EU harmonizes accuracy classes across member states, encouraging standardized procurement of premium instruments.[2]European Commission, “Directive 2014/32/EU on Measuring Instruments,” eur-lex.europa.eu As a result, buyers gravitate to combination systems that deliver weight verification, metal detection and X-ray inspection in a single frame, simplifying validation and documentation. Heightened scrutiny of allergen cross-contact further fuels demand for IP69-rated, stainless-steel constructions suited for aggressive wash-down regimens.
Rapid Packaging-Line Automation to Curb Labor Costs
Rising wages and persistent labor shortages push manufacturers to automate quality checks once handled manually. North American food producers doubled robot orders for primary and secondary packaging between 2023 and 2024, a trend mirrored in APAC where manufacturers seek to stabilize output amid demographic shifts. Inline checkweighers linked to vision systems and robotic reject stations eliminate human intervention, reducing ergonomic risk and delivering payback within two to three years at mid-volume facilities. Suppliers promote single-SKU changeovers completed in under three minutes, cutting idle time and supporting shorter production runs.
Rising Packaged-Food and Beverage Throughput Worldwide
Demand for ready-to-eat meals and single-serve beverages lifts average fill-and-seal speeds, pressuring checkweighers to match conveyor velocities while preserving sub-gram sensitivity. Modular weighing cells mounted on vibration-isolated conveyor decks now process up to 3,000 items per hour without sacrificing measurement fidelity. At the same time, beverage brands adopt lightweight PET, increasing sensitivity to under-fills and therefore widening the role of in-line verification. Universal mounting kits enable fast changeovers among pouches, cans and bottles, ensuring 100% inspection rather than statistical sampling. Emerging markets in Southeast Asia and Latin America replicate this pattern as urban consumers shift to packaged foods, broadening the global installation base for high-speed units.
Industry-4.0 Enabled Remote OEE Monitoring
Modern checkweighers ship with Ethernet, OPC-UA and MQTT protocols, streaming production data directly to MES dashboards. A 2024 retrofit at a multinational packaging plant connected 75 machines—including electronic scales—to a single OEE platform, driving a 9% reduction in unplanned stops within six months. Edge processors analyze vibration signatures to predict load-cell drift, prompting service only when tolerance thresholds near non-conformance. Such predictive routines slash maintenance budgets and lengthen calibration intervals, creating a virtuous cycle of uptime and cost savings. Vendors capitalize by bundling subscription analytics and remote support, shifting revenue toward recurring software lines that cushion cyclical equipment spending.
Restraints Impact Analysis*
| Restraint | (~) % Impact on CAGR Forecast | Geographic Relevance | Impact Timeline |
|---|---|---|---|
| High upfront CAPEX and long ROI for SMEs | -0.7% | Global, concentrated in emerging markets | Medium term (2-4 years) |
| Skilled-operator shortage for calibration / maintenance | -0.5% | North America & EU industrial regions | Long term (≥ 4 years) |
| Growing use of in-process dosing algorithms cuts need | -0.3% | APAC manufacturing hubs | Short term (≤ 2 years) |
| Precision load-cell supply bottlenecks lengthen lead-times | -0.4% | Global supply chain dependencies | Medium term (2-4 years) |
| Source: Mordor Intelligence | |||
High Upfront CAPEX and Long ROI for SMEs
Price tags above USD 100,000 for advanced combination models deter smaller processors who operate on thin margins. Lenders classify used checkweighers as specialized collateral with limited resale value, tightening credit terms for first-time buyers. Robots-as-a-Service contracts mitigate lump-sum payments by spreading costs over two to five years, yet many emerging-market SMEs remain cautious. Subscription plans bundle hardware, software and maintenance at per-case fees, lowering barriers but not eliminating them. Consequently, basic bench scales and manual sampling persist in micro-plants, constraining full addressability of the automatic checkweigher market.
Skilled-Operator Shortage for Calibration / Maintenance
Modern systems rely on electromagnetic force restoration sensors and high-speed servos that demand specialized alignment procedures. A 2025 industry survey found 38% of US food plants lacked certified technicians able to fine-tune load-cell linearity, stretching service intervals and risking drift outside tolerance. OEMs respond with remote login support and augmented-reality job aids, yet on-site expertise remains essential for belt alignment and mechanical adjustments. The talent gap slows adoption at plants without robust engineering functions and raises lifecycle costs where external contractors must be flown in.
*Our forecasts treat driver/restraint impacts as directional, not additive. The impact forecasts reflect baseline growth, mix effects, and variable interactions.
Segment Analysis
By Product Type: Combination Systems Drive Integration
Dynamic systems retained the largest share at 46.1% in 2024, underscoring their adaptability across high-volume food, beverage and pharmaceutical lines. Within this category, electro-magnetic force restoration technology lifted speed ceilings to 650 ppm while preserving ±0.5 g precision, reinforcing the segment’s dominance. Combination units occupy a 4.4% CAGR trajectory, illustrating buyers’ shift toward consolidated inspection footprints that deliver layered compliance through one HMI. The automatic checkweigher market size for combination systems is projected to exceed USD 155 million by 2030 as X-ray and metal-detection modules integrate natively with weighing frames. Static and manual-feed models persist in fine-chemical and specialty pharmaceutical plants where batch complexity outweighs speed, though they represent a shrinking slice of revenue.
Manufacturers structure portfolios to cover the spectrum from cost-sensitive entry units to premium hygienic constructs. Standout launches pair modular conveyors with field-swappable sensors, letting owners upgrade capacity without chassis replacement. This platform logic enables lifecycle extensions that temper replacement demand yet deepen service revenues. Competitive pressure therefore tilts toward firmware innovation, automated calibration wizards and cybersecurity safeguards rather than raw mechanical design. The resulting arms race sustains price stability in the automatic checkweigher market even as component costs rise.


By Throughput Speed: High-Speed Applications Accelerate
Lines operating between 201 ppm and 400 ppm contributed 49.5% of automatic checkweigher market share in 2024, balancing speed with the accuracy thresholds mandated by global food codes. Midsized snack and dairy plants favor this band, citing ease of integration with existing conveyors. Simultaneously, >400 ppm systems log the fastest growth at 4.5% CAGR as e-commerce, beverage canning and confectionery lines chase incremental seconds that compound into millions of units annually. Mettler Toledo’s FlashCell demonstrates the frontier, weighing 800 under-100 g packs per minute at ±0.25 g repeatability, translating to material savings and billing accuracy.
Below-200 ppm platforms remain vital where individual product value justifies slower speeds, such as specialty cosmetics, nutraceutical capsules and electronic sub-assemblies. Vendors protect this niche with high-resolution force compensation cells achieving ±0.05 g linearity. Across all bands, vibration filtering algorithms offset plant floor resonance, while auto-zero recalibration routines maintain measurement integrity between service intervals. As operators weigh capital outlays against takt-time objectives, throughput segments converge on total cost of ownership rather than headline speed.
By End-User Industry: Logistics Segment Transforms Market Dynamics
Food and beverage manufacturers accounted for 61.2% of revenue in 2024, anchored by global safety mandates and continuous processing modes that reward 100% inline inspection. Nevertheless, logistics and parcel operators are expanding at a 4.2% CAGR, leveraging checkweighers to verify postage brackets, detect mis-picks and feed real-time dimensioning systems. New Zealand Post’s Auckland hub illustrates scale effects, routing 30,000 parcels per hour through high-speed weighing and sorting arrays. Pharmaceuticals and biotechnology maintain steady adoption, where serialization and anti-counterfeit protocols pair naturally with precise weight checks. Cosmetics firms favor units capable of handling fragile glass jars and wide-body tubes while meeting cleanroom adjacency standards.
The automatic checkweigher market size within logistics is projected to nearly double by 2030, propelled by micro-fulfilment rollouts inside dense urban centers. E-tailers integrate weigh-verify stations after automated bagging, capturing last-second anomalies before shipping labels print. As a result, suppliers develop software APIs that link weighing events to warehouse management systems, enhancing inventory accuracy. This cross-sector fertilization reinforces checkweighers as a universal tool, equally at home in process industries and distribution networks.
By System Integration: Standalone Dominance Faces Combination Challenge
Stand-alone frames held 55.3% of global sales in 2024, favored by plants requiring frequent relocations or retrofits on legacy conveyors. Quick-release belt changeovers and compact footprints deliver operational agility, especially for copackers juggling short production runs. Conversely, fully integrated and combination solutions will outpace at a 4.1% CAGR as greenfield projects bake quality checks into single-line layouts. Loma Systems’ CW3 exemplifies this pivot, embedding touchscreen recipe libraries and auto-tune features that cut changeover time by 80%.
Integration choice correlates with plant digital maturity. Facilities deploying end-to-end traceability tools lean toward all-in-one packages that reduce validation nodes. Meanwhile, retrofit projects in legacy plants keep stand-alone demand buoyant. Regardless of format, buyers increasingly insist on common firmware across fleets to simplify cybersecurity patching and operator training. Suppliers who align mechanical flexibility with unified software stacks capture disproportionate share of the automatic checkweigher market as procurement migrates from equipment focus to lifecycle cost calculus.
Geography Analysis
Asia Pacific retained 38.4% of global revenue in 2024 and is on track for a 3.9% CAGR through 2030, buoyed by China’s capacity expansions in snacks, beverages and consumer electronics, alongside Japan’s precision engineering exports. Government incentives that subsidize Industry 4.0 upgrades reduce acquisition costs, fostering wider mid-tier adoption. Southeast Asian nations add incremental demand as multinational food brands localize production, embedding high-speed weighing from project inception. Australia and South Korea contribute niche growth in export-oriented meat and semiconductor segments, where traceability and yield optimization drive premium purchases.
North America ranks second by value thanks to stringent FDA oversight and entrenched automation expertise. Parcel hubs pivoting to same-day fulfilment deploy high-speed belts exceeding 18,000 pph, pushing suppliers to advance reject timing accuracy amid dense conveyor traffic. The automatic checkweigher market size for North American logistics operators is forecast to expand steadily as warehouse robotics proliferate. Canadian food processors mirror US safety culture, while Mexican maquiladoras adopt mid-tier systems to satisfy US customer audits, generating cross-border after-sales opportunities.
Europe presents a mature yet technology-intensive arena governed by harmonized EU measurement directives. German bakery and dairy processors specify IP69 designs with antimicrobial seals, reinforcing the hygienic premium segment. France and Italy modernize wine and confectionery plants, valuing low-g vibration isolation for glass packaging lines. The United Kingdom maintains regulatory alignment with CE norms, ensuring supplier continuity post-Brexit. Eastern Europe adds incremental volume through greenfield snack facilities targeting intra-EU exports. Sustainability legislation around energy efficiency prompts R&D into low-wattage servos, nudging European buyers toward next-generation models.

Competitive Landscape
Market concentration remains moderate as the top five suppliers jointly command roughly 60% of 2024 revenue, leveraging scale to fund continuous firmware and sensor innovation. METTLER TOLEDO derives nearly 39% of group turnover from industrial instruments, enabling bundled service contracts that lock in multi-year customer relationships.[3]US Securities and Exchange Commission, “Mettler-Toledo Form 10-K 2024,” sec.govAnritsu, Wipotec and Ishida compete on hygienic design and ultrafast electromagnetic force restoration cells, while MinebeaMitsumi channels precision motion expertise into compact multilane architectures.
Software differentiation grows sharper as vendors launch IIoT dashboards, anomaly-detection algorithms and RESTful APIs. Patent filings covering load-cell temperature compensation and automated SKU mapping suggest a pivot toward embedded intelligence as a moat. Regional specialists survive by tailoring frames to local safety codes, offering in-language HMIs and providing 24-hour field engineering coverage. Consolidation through acquisition continues: Antares Vision’s 2025 purchase of FT System expanded installed base past 5,000 bottling-control machines, plugging a technology gap in in-line inspection.
Vendors also nurture subscription revenue by bundling condition-monitoring analytics, remote calibrations and cybersecurity patch management. These sticky services lift customer lifetime value and blunt raw-material cost volatility. As buyers evaluate total economic impact rather than sticker price, suppliers boasting global parts depots and augmented-reality maintenance portals tip the scales in competitive tenders. Consequently, rivalry migrates from price to holistic performance, fortifying margins in the automatic checkweigher market.
Automatic Checkweigher Industry Leaders
-
Ishida Co., Ltd.
-
WIPOTEC-OCS GmbH
-
Anritsu Corporation
-
Loma Systems
-
Mettler-Toledo International Inc.
- *Disclaimer: Major Players sorted in no particular order

Recent Industry Developments
- July 2025: Kaminashi partnered with Ishida Aites to digitize food and logistics plants in Kyoto and Shiga, integrating advanced weighing platforms for productivity gains.
- July 2025: AIIS finalized the acquisition of ISM Co., strengthening distribution of medical checkweighers and boosting nationwide after-sales coverage in Japan.
- May 2025: New Zealand Post opened its Auckland Processing Centre, featuring automation that weighs and sorts 30,000 parcels per hour for same-day dispatch capability.
- February 2025: Mettler-Toledo reported Q1 2024 revenue of USD 925.95 million, underscoring sustained demand for precision instruments, including automatic checkweighers, amid mixed macro conditions.


Global Automatic Checkweigher Market Report Scope
| Dynamic Checkweigher |
| Static/Manual-feed Checkweigher |
| Combination (Checkweigher + Metal Detector/X-ray) |
| Modular Multilane Systems |
| Others |
| ≤200 ppm |
| 201–400 ppm |
| >400 ppm |
| Food and Beverage |
| Pharmaceutical and Biotechnology |
| Cosmetics and Personal Care |
| Logistics and Parcel |
| Others (Chemicals, Industrial) |
| Stand-alone Systems |
| Fully Integrated/Combination Systems |
| North America | United States | |
| Canada | ||
| Mexico | ||
| South America | Brazil | |
| Argentina | ||
| Rest of South America | ||
| Europe | Germany | |
| France | ||
| United Kingdom | ||
| Italy | ||
| Spain | ||
| Russia | ||
| Rest of Europe | ||
| Asia-Pacific | China | |
| Japan | ||
| India | ||
| South Korea | ||
| Australia | ||
| ASEAN | ||
| Rest of Asia-Pacific | ||
| Middle East and Africa | Middle East | Saudi Arabia |
| United Arab Emirates | ||
| Turkey | ||
| Rest of Middle East | ||
| Africa | South Africa | |
| Nigeria | ||
| Rest of Africa | ||
| By Product Type | Dynamic Checkweigher | ||
| Static/Manual-feed Checkweigher | |||
| Combination (Checkweigher + Metal Detector/X-ray) | |||
| Modular Multilane Systems | |||
| Others | |||
| By Throughput Speed | ≤200 ppm | ||
| 201–400 ppm | |||
| >400 ppm | |||
| By End-user Industry | Food and Beverage | ||
| Pharmaceutical and Biotechnology | |||
| Cosmetics and Personal Care | |||
| Logistics and Parcel | |||
| Others (Chemicals, Industrial) | |||
| By System Integration | Stand-alone Systems | ||
| Fully Integrated/Combination Systems | |||
| By Geography | North America | United States | |
| Canada | |||
| Mexico | |||
| South America | Brazil | ||
| Argentina | |||
| Rest of South America | |||
| Europe | Germany | ||
| France | |||
| United Kingdom | |||
| Italy | |||
| Spain | |||
| Russia | |||
| Rest of Europe | |||
| Asia-Pacific | China | ||
| Japan | |||
| India | |||
| South Korea | |||
| Australia | |||
| ASEAN | |||
| Rest of Asia-Pacific | |||
| Middle East and Africa | Middle East | Saudi Arabia | |
| United Arab Emirates | |||
| Turkey | |||
| Rest of Middle East | |||
| Africa | South Africa | ||
| Nigeria | |||
| Rest of Africa | |||


Key Questions Answered in the Report
What is the projected value of the automatic checkweigher market in 2030?
It is forecast to reach USD 414.26 million, growing at a 3.92% CAGR from 2025.
Which product category is expanding fastest?
Combination systems that integrate metal detection or X-ray are growing at a 4.4% CAGR to 2030.
Why are logistics firms investing in checkweighers?
High-speed parcel hubs rely on sub-kilogram accuracy to verify postage and reduce mis-ship penalties, fueling a 4.2% CAGR in the segment.
How does Industry 4.0 influence adoption?
Connected checkweighers stream real-time data to MES platforms, enabling predictive maintenance that cuts unplanned downtime and total cost of ownership.
Which region leads the market?
Asia Pacific holds 38.4% of global revenue and is set for the fastest regional growth at 3.9% CAGR.
What hampers adoption among SMEs?
High upfront capital expenditure and extended payback periods deter smaller processors, despite emerging leasing and subscription models.
Page last updated on:


