Automated Fare Collection Market Size and Share
Market Overview
| Study Period | 2019 - 2030 |
|---|---|
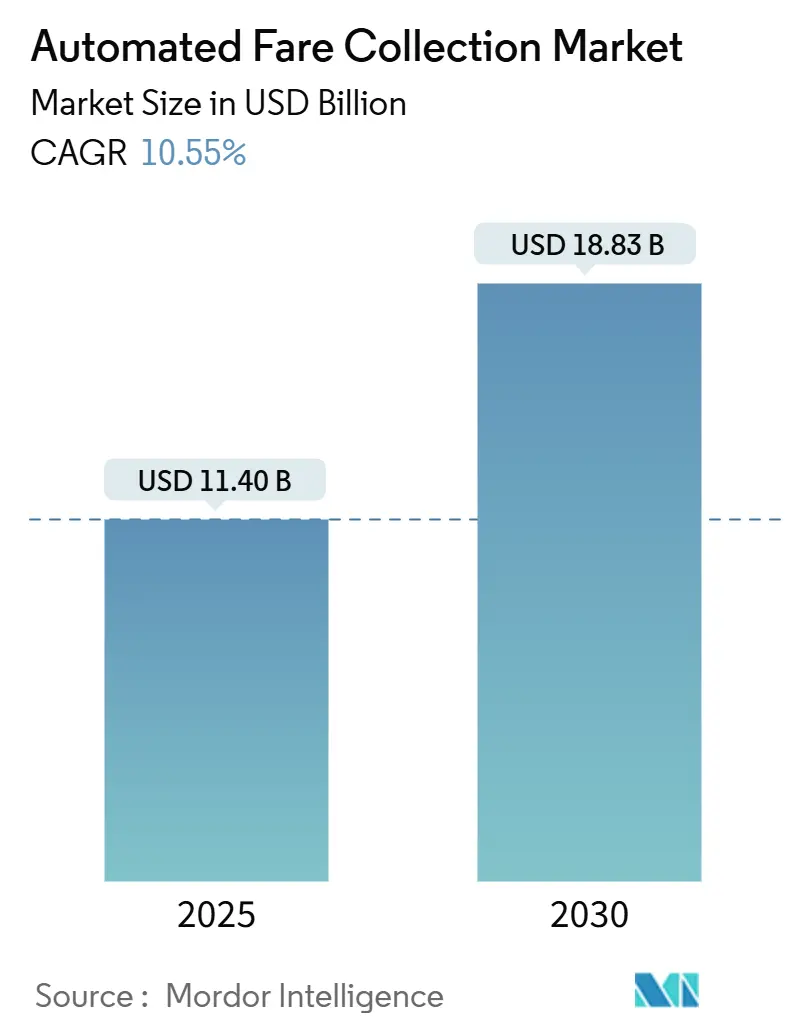
| Market Size (2025) | USD 11.40 Billion |
| Market Size (2030) | USD 18.83 Billion |
| Growth Rate (2025 - 2030) | 10.55% CAGR |
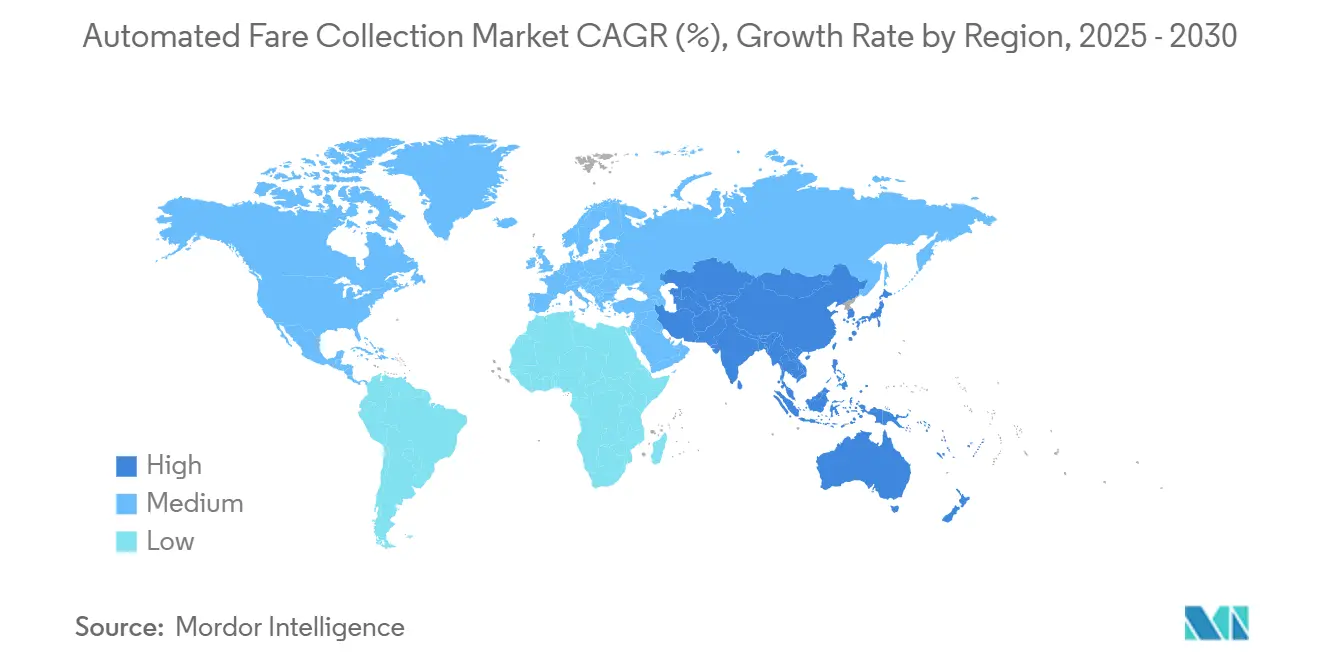
| Fastest Growing Market | Asia Pacific |
| Largest Market | North America |
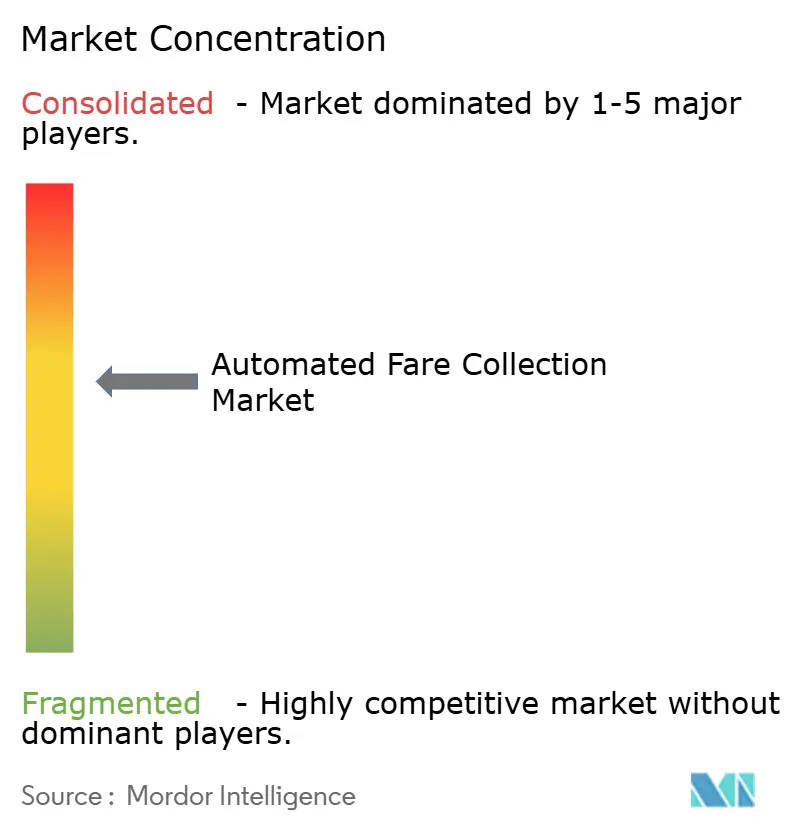
| Market Concentration | Medium |
Major Players *Disclaimer: Major Players sorted in no particular order Image © Mordor Intelligence. Reuse requires attribution under CC BY 4.0. | |
Automated Fare Collection Market Analysis by Mordor Intelligence
The automated fare collection market size stood at USD 11.40 billion in 2025 and is forecast to reach USD 18.83 billion by 2030, reflecting a 10.55% CAGR during the period. Growing preference for touch-free payments, national mandates for open-loop EMV standards, and the operational efficiencies unlocked by account-based ticketing are accelerating deployment cycles across every continent. Multimodal integration projects now bundle rail, bus, tolling, and parking into single back-office platforms, allowing transit agencies to monetize passenger data analytics while capping fares in real time. Vendors are broadening from hardware sales to “as-a-service” models that wrap software, predictive maintenance, and customer-care into recurring contracts, tightening long-term relationships with city authorities. Meanwhile, greenfield megacity projects in Asia and Latin America are bypassing closed-loop smart cards altogether, specifying mobile-first or cloud-first architectures from day one. Intensifying merger activity, typified by Hitachi Rail’s purchase of Thales Ground Transportation Systems, illustrates how scale and integrated portfolios are becoming decisive competitive advantages.
Key Report Takeaways
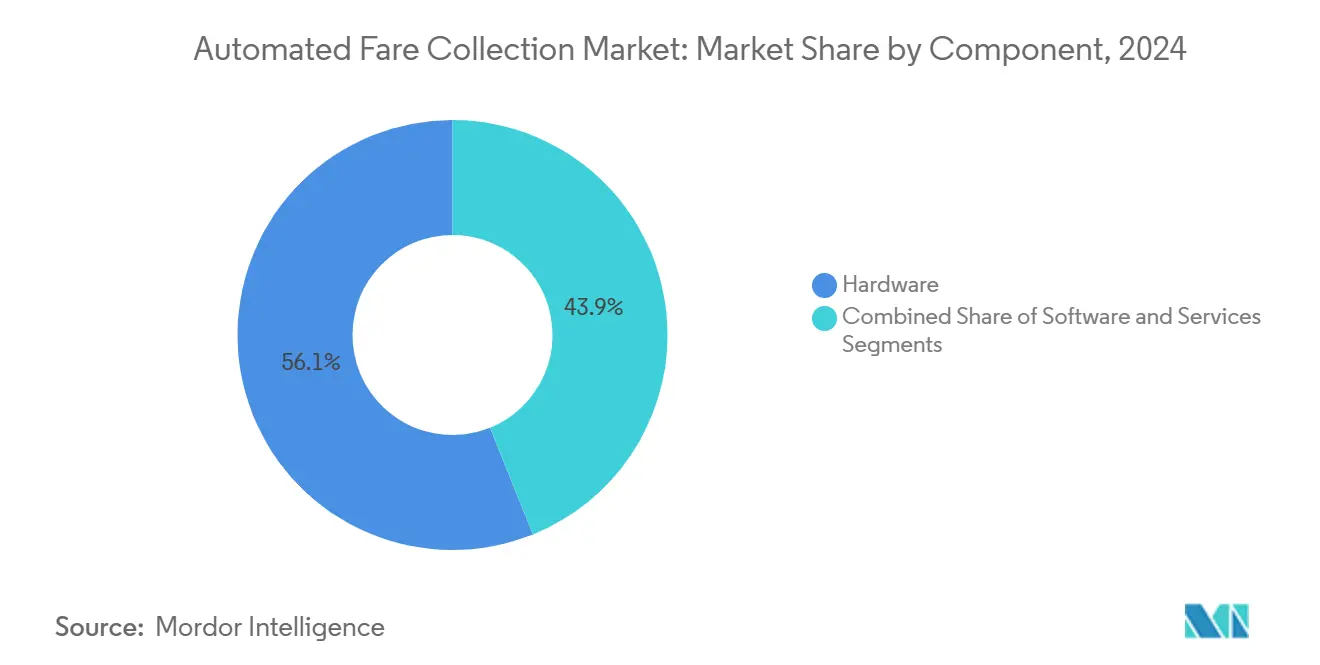
- By component, hardware commanded 56.1% of the automated fare collection market share in 2024, while services are advancing at a 12.1% CAGR through 2030.
- By technology, QR/barcode solutions led with 65.4% revenue in 2024; NFC is projected to expand at an 11.4% CAGR to 2030.
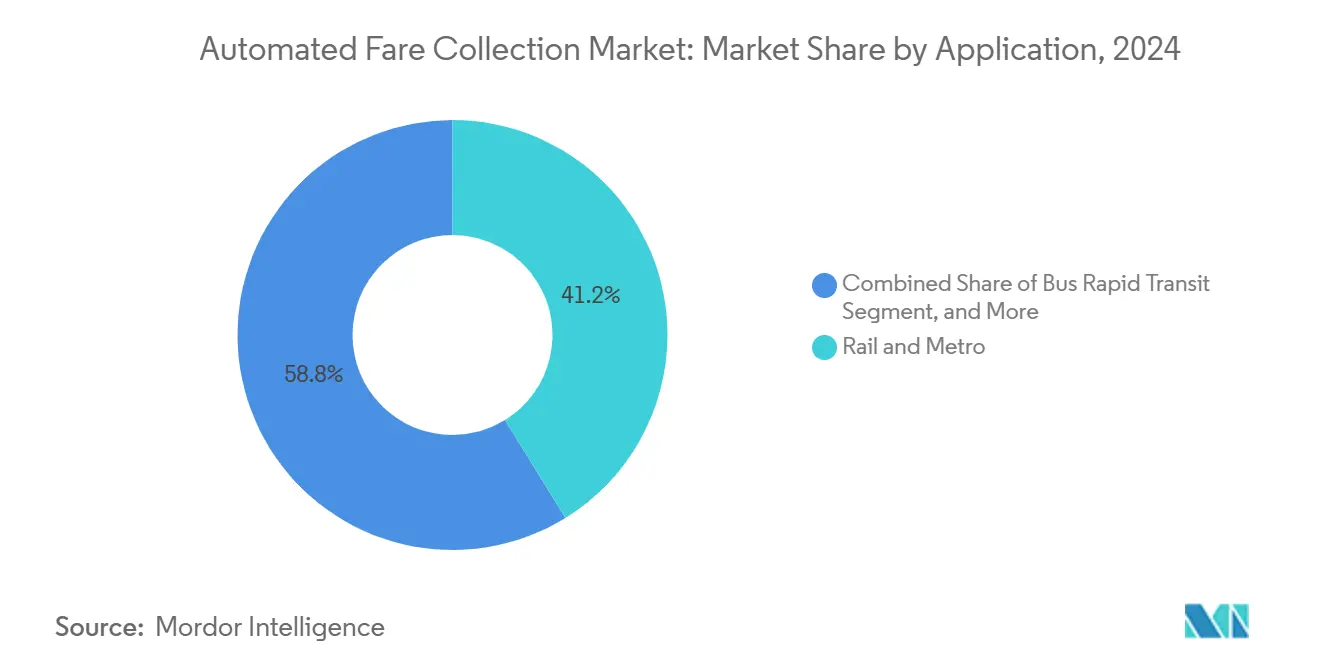
- By application, rail and metro systems accounted for a 41.2% share of the automated fare collection market size in 2024, and bus rapid transit is tracking an 11.0% CAGR through 2030.
- By media, smart cards accounted for a 68.5% share of the automated fare collection market size in 2024, and mobile tickets is tracking an 11.7% CAGR through 2030.
- By geography, North America held 37.6% of 2024 revenue, whereas Asia-Pacific is set to register a 10.8% CAGR over the forecast horizon.
Global Automated Fare Collection Market Trends and Insights
Drivers Impact Analysis*
| Driver | (~) % Impact on CAGR Forecast | Geographic Relevance | Impact Timeline |
|---|---|---|---|
| Growing deployment of multimodal transport smart-card schemes | +2.1% | Global, with early gains in Europe, Asia-Pacific | Medium term (2-4 years) |
| Rapid urban rail expansion in emerging megacities | +1.8% | APAC core, spill-over to MEA, Latin America | Long term (≥ 4 years) |
| National mandates for open-loop EMV payments | +1.5% | North America & EU, expanding to APAC | Short term (≤ 2 years) |
| Shift to account-based ticketing (ABT) architectures | +1.3% | Global, led by developed markets | Medium term (2-4 years) |
| Transit-linked loyalty and retail partnerships | +0.9% | North America, Europe, select APAC cities | Medium term (2-4 years) |
| AI-driven predictive maintenance lowering OPEX | +1.2% | Global, concentrated in high-density networks | Short term (≤ 2 years) |
| Source: Mordor Intelligence | |||
Growing Deployment of Multimodal Smart-Card Schemes
Cities are converging rail, bus, ferry, toll, and parking payments inside single wallets, eliminating mode-switch friction and motivating higher ridership. Bangkok’s 2025 roll-out of a uniform 20-baht fare across electric trains shows the behavioral upside of “one-city, one-card” propositions, with operators reporting 25-40% rises in cross-modal transfers after launch. Unified systems capture full-journey data that powers dynamic fare capping and demand-shift nudges during peak periods. Transit authorities also gain bargaining leverage with retail partners by linking ride history to loyalty offers, creating ancillary revenue streams that partially offset public-funding gaps. Vendors capable of blending hardware, back-office clearing, and customer-analytics APIs stand to secure decade-long service contracts as authorities pivot from capital purchases to outcome-based outsourcing.
Rapid Urban Rail Expansion in Emerging Megacities
Mass-transit construction is accelerating in Asia, where India alone added 1,000 kilometers of metro track and targets a further 980 kilometers under build by 2030. Each new line specifies validators, gates, and back-office platforms from day one, creating clean-slate opportunities for the automated fare collection market. Systems must accommodate multilingual interfaces, integrate with national digital ID programs, and support hybrid payment models for unbanked riders. Suppliers delivering modular, cloud-native fare engines gain cost and speed advantages over legacy on-premise stacks that struggle to scale.
National Mandates for Open-Loop EMV Payments
Governments are short-circuiting the voluntary adoption curve by legislating contactless EMV acceptance in public transport. The Philippine Department of Transportation finished a nationwide roll-out across MRT-3, LRT-1, and LRT-2 during 2025, enabling instant tap-to-ride with GCash wallets, debit cards, and credit cards.[1]Mastercard, “Traversing Cities Seamlessly,” mastercardservices.com National mandates standardize security, back-office settlement, and acquirer relationships, compressing project timelines and catalyzing 70-80% contactless penetration inside 18 months.
Shift to Account-Based Ticketing Architectures
ABT moves fare logic to the cloud, letting riders use any secure token, card, phone, or wearables, while back-office engines apply fare capping or concessions automatically. Pittsburgh Regional Transit’s Ready2Ride platform, powered by Masabi, illustrates how ABT removes the need to pre-decide fare zones and still guarantees the best daily price. Cities running ABT report 15-25% revenue uplifts from reduced fare evasion and data-driven pricing tweaks.
Restraints Impact Analysis*
| Restraint | (~) % Impact on CAGR Forecast | Geographic Relevance | Impact Timeline |
|---|---|---|---|
| Cyber-security and privacy breaches | -1.4% | Global, concentrated in developed markets | Short term (≤ 2 years) |
| Fragmented legacy standards in bus networks | -1.1% | Global, particularly acute in North America | Medium term (2-4 years) |
| Cap-ex pressure amid post-COVID budget cuts | -1.8% | Global, most severe in developed markets | Short term (≤ 2 years) |
| Low digital-payment penetration in parts of Africa and S. Asia | -0.7% | Sub-Saharan Africa, South Asia rural areas | Long term (≥ 4 years) |
| Source: Mordor Intelligence | |||
Cyber-Security and Privacy Breaches
Integrated payment systems aggregate personal identifiers, ride histories, and card credentials, making them prime targets for sophisticated attacks. High-profile breaches have forced agencies to dedicate 8–12% of total project budgets to cyber-defense, including PCI-DSS compliance, end-to-end encryption, and penetration testing. Privacy advocates have challenged agencies that allow ride histories to be reconstructed with minimal data, prompting regulators to tighten data-retention rules. Failure to address these risks can stall new deployments, elongate procurement cycles, and inflate insurance premiums. Vendors with ISO 27001 certification and real-time threat-detection dashboards are increasingly shortlisted during tenders.
Cap-Ex Pressure Amid Post-Pandemic Budget Cuts
While ridership rebounded to roughly 74% of 2019 levels across many U.S. and European systems, farebox revenues still lag pre-pandemic peaks, squeezing capital budgets. Operators now favor phased upgrades, software subscriptions, and revenue-sharing models over large upfront purchases. Suppliers able to propose outcome-based financing, such as validator “hardware as a service” or OPEX-linked maintenance contracts, are better positioned to close deals than rivals demanding lump-sum payments.
*Our forecasts treat driver/restraint impacts as directional, not additive. The impact forecasts reflect baseline growth, mix effects, and variable interactions.
Segment Analysis
By Component: Services Expand Recurring Revenue Models
Hardware retained 56.1% of 2024 revenue thanks to validators, gates, and ticket vending machines that anchor physical networks, yet services are advancing at a 12.1% CAGR through 2030. Many transit authorities now outsource back-office clearing, device monitoring, and data analytics, shifting risk and technology refresh cycles to suppliers. INIT’s Ticketing-as-a-Service platform combines cloud hosting, passenger-flow dashboards, and contact-center support within a single fee. As these offerings mature, the automated fare collection market size for services is projected to overtake hardware by the early 2030s.
Recurring contracts provide vendors with predictable revenue while giving agencies evergreen upgrades without disruptive capital tenders. Cloud-native firmware pushes extend gate life spans, and AI-driven diagnostics trim unplanned maintenance by up to 30%, creating a virtuous circle of savings that get reinvested in passenger-facing innovation. This pivot signals a long-term shift in the automated fare collection market, where value migrates from metal to managed outcomes.


By Technology: NFC Gains Despite QR Dominance
QR and barcode formats owned 65.4% of 2024 revenue because they run on any smartphone camera and can be deployed without replacing gate readers. Nevertheless, NFC transactions are rising at an 11.4% CAGR as Apple Pay, Google Wallet, and Samsung Pay achieve near-ubiquity. NXP’s MIFARE 2GO program digitized Seattle’s ORCA and San Francisco’s Clipper cards, allowing tap-and-ride without compromising on AES-grade security. With 40+ transport applications certified, the technology future-proofs agencies while preserving backward compatibility.
Declining magnetic-stripe volumes and emerging biometric pilots underscore the overarching modernization wave. Moscow’s student-focused facial-recognition pilot processed over 550,000 rides within months, hinting at niche growth for camera-based validation where privacy regulations permit. Vendors that offer multi-format readers capable of flexing between QR and NFC within the same chassis enjoy lower total cost of ownership advantages.
By Application: Bus Rapid Transit Accelerates
Heavy rail and metro captured 41.2% of 2024 expenditure due to their high throughput and complex distance-based fares, yet bus rapid transit corridors are growing at 11.0% CAGR. Flowbird installed 185 Strada StreetSmart vending machines for Minneapolis’ latest BRT expansion, validating how urban planners worldwide favor busways for speed and cost efficiency. Road-tolling and parking segments continue to migrate toward all-electronic free-flow systems, with camera-only toll roads such as the Netherlands’ A24 eliminating booths entirely.
For vendors, BRT offers repeat business through validator retrofits each time new corridors are added, whereas rail contracts are lumpy and mega-scale. Cross-mode convergence also means a single back-office can reconcile rail, BRT, and bike-share, enabling operators to roll out fare capping across the entire automated fare collection market without duplicating infrastructure.
By Media: Mobile Ticketing Erodes Smart-Card Supremacy
Smart cards delivered 68.5% of 2024 transactions, but mobile tickets are outpacing at 11.7% CAGR. Thales’ Trusted Service Hub lets agencies tokenize existing cards into secure elements on smartphones, driving a 200% rise in mobile transaction value between 2022 and 2027.[2]Thales Group, “Mobile Ticketing & Payment for Public Transportation,” thalesgroup.com Wearables occupy a niche yet are popular among younger commuters, reinforced by contactless transit incentives bundled with fitness devices.
Mobile tokens dovetail with account-based architectures, allowing dynamic discounting and immediate card hot-listing without recalling plastic. As smartphone penetration surpasses 80% in most regions, agencies now weigh whether to reduce card issuance altogether, cutting plastic waste and logistics costs.
Geography Analysis
North America held 37.6% of 2024 revenue owing to large-scale replacements like SEPTA’s USD 211 million Key 2.0 project, which bundles virtual cards, fare capping, and equity pricing. Despite fiscal pressure from ridership at 74% of 2019 levels, the Infrastructure Investment and Jobs Act provides multi-year capital streams, ensuring steady procurement pipelines. State-level mandates for open-loop EMV acceptance in Chicago, Miami, and Dallas are expected to widen the automated fare collection market size further.
Asia-Pacific represents the fastest-growing cluster, advancing at a 10.8% CAGR thanks to rapid metro build-out and smartphone-first payment cultures. India’s network already moves 10.2 million daily passengers across 1,010 kilometers and embeds QR, NFC, and UPI real-time payments inside the same validators. Vietnam’s Hanoi and Ho Chi Minh City launched fully open-loop systems that auto-switch between bankcards and e-wallets, illustrating how emerging markets skip legacy stages. These leapfrogs create fertile ground for suppliers that can deliver modular, cloud-hosted back offices with ISO 20022 payment gateways.
Europe pursues harmonization via national schemes such as the Netherlands’ OVpay, where contactless bankcards already account for 15.2% of rides. Transport Scotland’s 2024 strategy sets out an integrated ticketing roadmap that coordinates rail, bus, and ferry across one smart-payment spine.[3]Transport Scotland, “Smart, Digital, Integrated Ticketing and Payments Strategy,” transport.gov.scotMeanwhile, Middle East and Africa cities deploy turnkey metro-plus-BRT packages funded by sovereign wealth and multilateral banks. Collectively, these dynamics assure the automated fare collection market of diversified growth sources rather than single-region dependence.

Competitive Landscape
The vendor field is moderately fragmented yet tilting toward consolidation. Hitachi Rail’s absorption of Thales GTS created a EUR 7.3 billion multimodal powerhouse spanning 51 countries and furnished it with end-to-end signaling, fare, and cyber-security competencies. Cubic Transportation Systems pivoted to an open-loop business unit to defend share in mature markets where bank-card acceptance is non-negotiable, while Masabi leverages cloud subscriptions to penetrate mid-sized cities at sub-USD 2 million ticket-to-launch cost.
Differentiation now hinges on cyber-resilience, API openness, and the ability to bundle mobility-as-a-service orchestration on top of core fare engines. Cloud-native players advertise 99.99% uptime SLAs and rolling feature drops every six weeks, contrasting with legacy integrators’ multi-year release cycles. Hardware specialists are either reinventing as device-plus-platform providers or divesting to focus on niche validators. Start-ups targeting fare-linked advertisement and carbon-credit monetization remain acquisition candidates as incumbents hunt for ancillary revenue levers.
Vendor selection criteria by agencies increasingly weight sustainability, requiring recyclability statements for gates and POS as well as net-zero roadmaps, alongside traditional cost and performance metrics. Collectively, these trends suggest the automated fare collection market will reward agile, well-capitalized suppliers capable of owning the full lifecycle from deployment to data analytics.
Automated Fare Collection Industry Leaders
Thales Group
NXP Semiconductors
Omron Corporation
NEC Corporation
Infineon Technologies AG
- *Disclaimer: Major Players sorted in no particular order

Recent Industry Developments
- July 2025: Land Bank of the Philippines launched a pilot automated fare collection system for MRT-3, enabling EMV payments and serving as payment-gateway integrator for nationwide settlements.
- July 2025: Philippine Department of Transportation completed nationwide open-loop EMV roll-out across rail lines with road-vehicle extension planned.
- June 2025: Madison’s Metro Transit activated open payments with Masabi, letting riders tap any contactless card or wallet.
- May 2025: Ho Chi Minh City’s Bến Thành–Suối Tiên metro introduced an automated fare collection platform offering single-ride and multi-day passes.


Global Automated Fare Collection Market Report Scope
| Hardware |
| Software |
| Services |
| Magnetic Stripe |
| Near Field Communication (NFC) |
| QR / Barcode |
| Other Technologies |
| Rail and Metro |
| Bus Rapid Transit |
| Road Toll |
| Parking |
| Other Applications |
| Smart Cards |
| Mobile Ticketing |
| Wearables |
| North America | United States | |
| Canada | ||
| Mexico | ||
| South America | Brazil | |
| Argentina | ||
| Rest of South America | ||
| Europe | United Kingdom | |
| Germany | ||
| France | ||
| Italy | ||
| Spain | ||
| Rest of Europe | ||
| Asia-Pacific | China | |
| Japan | ||
| India | ||
| South Korea | ||
| Australia | ||
| Rest of Asia-Pacific | ||
| Middle East and Africa | Middle East | Saudi Arabia |
| United Arab Emirates | ||
| Turkey | ||
| Rest of Middle East | ||
| Africa | South Africa | |
| Nigeria | ||
| Rest of Africa | ||
| By Component | Hardware | ||
| Software | |||
| Services | |||
| By Technology | Magnetic Stripe | ||
| Near Field Communication (NFC) | |||
| QR / Barcode | |||
| Other Technologies | |||
| By Application | Rail and Metro | ||
| Bus Rapid Transit | |||
| Road Toll | |||
| Parking | |||
| Other Applications | |||
| By Media | Smart Cards | ||
| Mobile Ticketing | |||
| Wearables | |||
| By Geography | North America | United States | |
| Canada | |||
| Mexico | |||
| South America | Brazil | ||
| Argentina | |||
| Rest of South America | |||
| Europe | United Kingdom | ||
| Germany | |||
| France | |||
| Italy | |||
| Spain | |||
| Rest of Europe | |||
| Asia-Pacific | China | ||
| Japan | |||
| India | |||
| South Korea | |||
| Australia | |||
| Rest of Asia-Pacific | |||
| Middle East and Africa | Middle East | Saudi Arabia | |
| United Arab Emirates | |||
| Turkey | |||
| Rest of Middle East | |||
| Africa | South Africa | ||
| Nigeria | |||
| Rest of Africa | |||


Key Questions Answered in the Report
What is the forecast value of the automated fare collection market by 2030?
The automated fare collection market is projected to reach USD 18.83 billion by 2030, expanding at a 10.55% CAGR.
Which component is expanding fastest in automated fare systems?
Services, including software, managed maintenance, and analytics, are growing at 12.1% CAGR as agencies shift to subscription models.
Why are EMV mandates important for transit agencies?
National EMV mandates standardize hardware, shorten deployment times, and drive 70–80% contactless adoption within 18 months.
How quickly is NFC technology growing compared with QR codes?
NFC-based fare payments are projected to rise at 11.4% CAGR to 2030, closing the gap with QR’s current dominance.
Which region is growing fastest in automated fare collection?
Asia-Pacific leads with a 10.8% CAGR, propelled by large-scale metro expansions and mobile-first payment cultures.
What effect does account-based ticketing have on agency revenue?
Agencies adopting ABT report 15–25% higher fare revenue due to optimized pricing and reduced evasion.
Page last updated on:


