
Automated Liquid Handlers Market Size and Share
Market Overview
| Study Period | 2020 - 2031 |
|---|---|
| Market Size (2026) | USD 1.31 Billion |
| Market Size (2031) | USD 1.74 Billion |
| Growth Rate (2026 - 2031) | 5.81 % |
| Fastest Growing Market | Asia Pacific |
| Largest Market | North America |
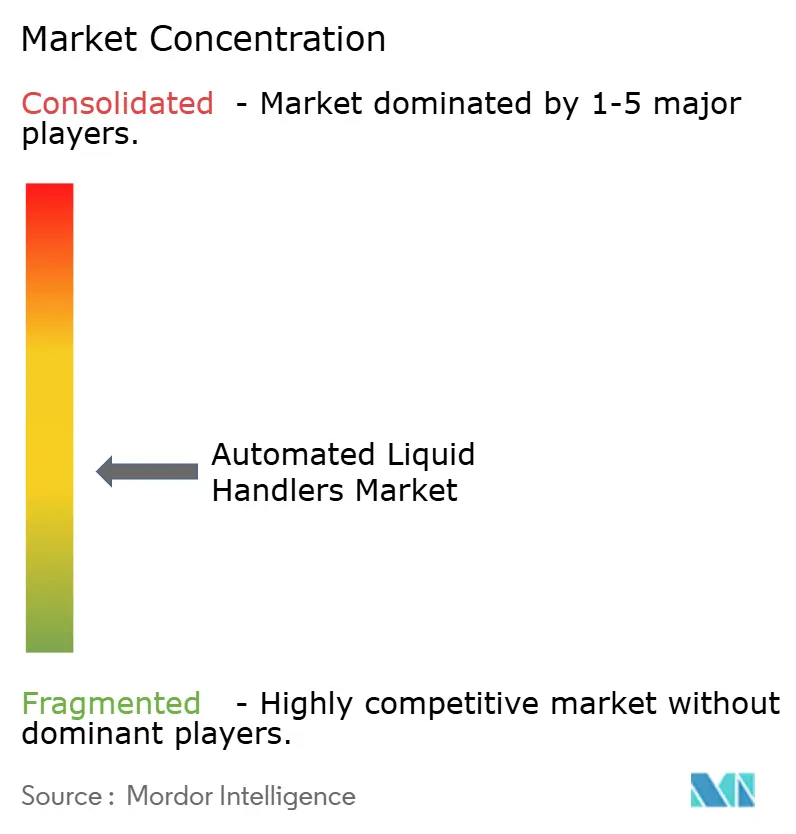
| Market Concentration | Medium |
Major Players *Disclaimer: Major Players sorted in no particular order Image © Mordor Intelligence. Reuse requires attribution under CC BY 4.0. | |
Automated Liquid Handlers Market Analysis by Mordor Intelligence
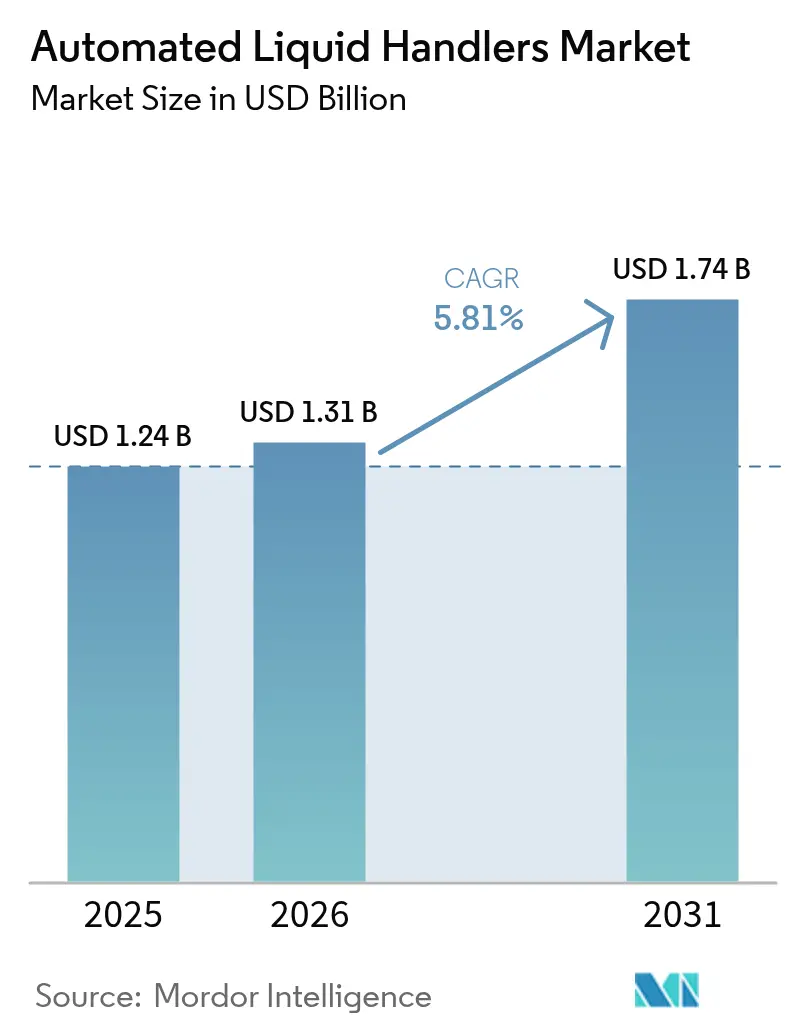
The automated liquid handlers market size is expected to grow from USD 1.24 billion in 2025 to USD 1.31 billion in 2026 and is forecast to reach USD 1.74 billion by 2031 at 5.81% CAGR over 2026-2031. The steady rise reflects the push for large-scale molecular diagnostics capacities, rapid uptake of AI-driven laboratory platforms, and the shift from manual pipetting to robotic precision. Hardware upgrades that shorten library-prep from hours to minutes in high-throughput genomic workflows add further momentum. Demand is also supported by mid-sized throughput systems that fit the daily sample volume of most clinical and research laboratories, giving the automated liquid handlers market a resilient baseline of recurring consumable sales. Emerging government funding in Asia-Pacific and steady replacement cycles in North America keep long-term visibility high.
Key Report Takeaways
- By product type, robotic workstations captured 45.72% of the automated liquid handlers market share in 2025, while software and services are forecast to expand at a 7.59% CAGR through 2031.
- By throughput capability, medium-throughput systems held 53.12% of the automated liquid handlers market size in 2025; high-throughput units are projected to grow at a 6.21% CAGR to 2031.
- By platform configuration, stand-alone benchtop units accounted for 60.65% share in 2025, whereas modular systems are expected to rise at an 8.02% CAGR.
- By application, drug discovery led with a 34.45% share of the automated liquid handlers market size in 2025, and genomics is advancing at a 6.62% CAGR through 2031.
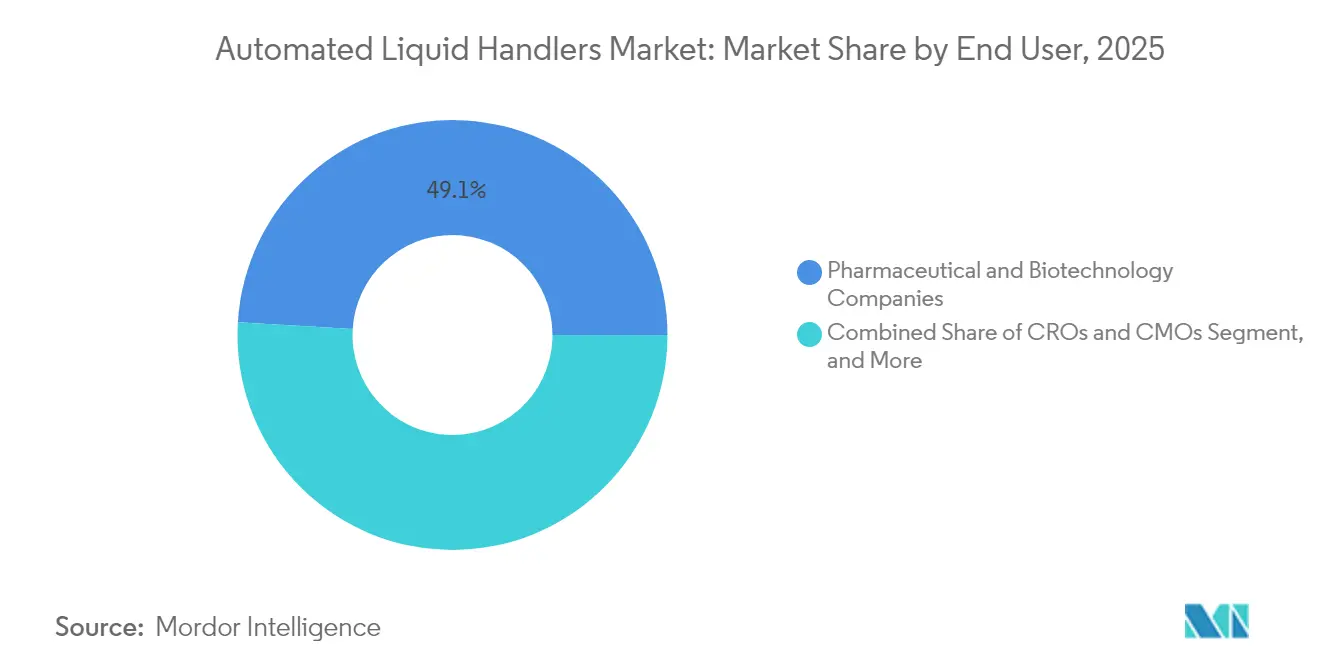
- By end user, pharmaceutical and biotechnology firms held 49.05% share, while CROs and CMOs displayed the highest projected CAGR at 9.08%.
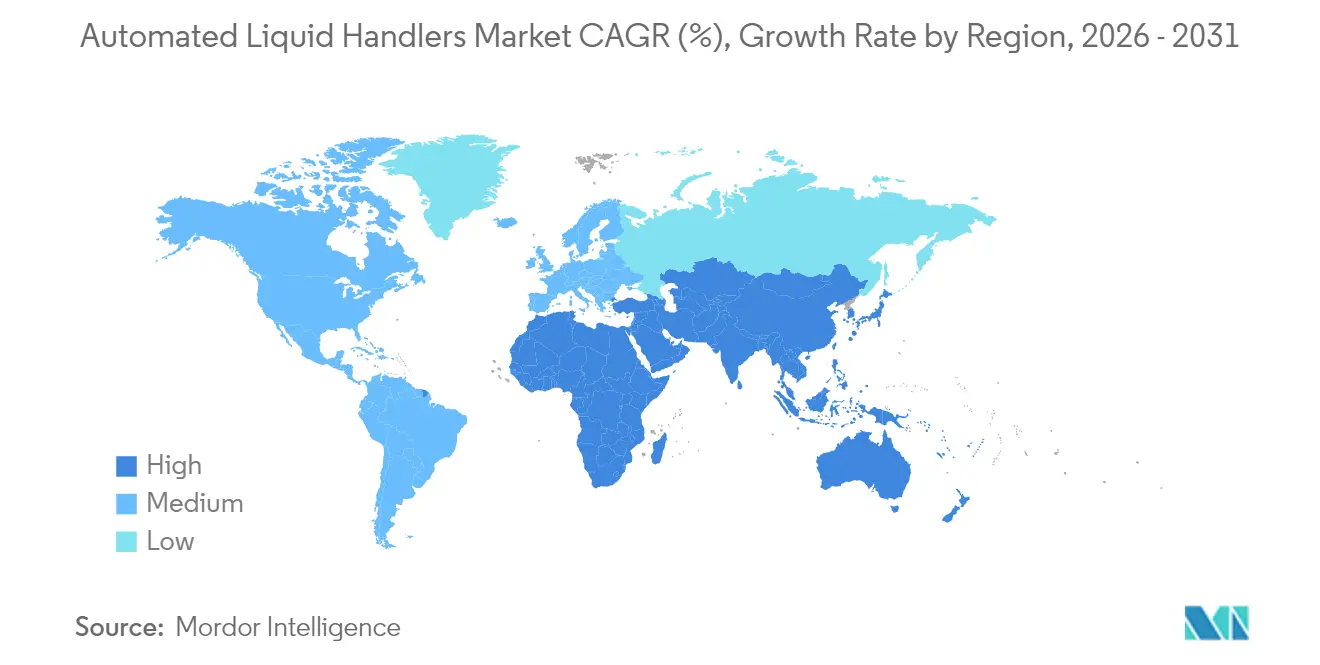
- By geography, North America led with a 38.10% share in 2025; Asia-Pacific records the fastest 6.82% CAGR to 2031.
Note: Market size and forecast figures in this report are generated using Mordor Intelligence’s proprietary estimation framework, updated with the latest available data and insights as of 2026.
Market Trends and Insights
Drivers Impact Analysis of Automated Liquid Handlers Market*
| Driver | (~) % Impact on CAGR Forecast | Geographic Relevance | Impact Timeline |
|---|---|---|---|
| Growing Throughput Requirements in High-Volume Genomic Screening | +1.2% | North America, EU | Medium term (2-4 years) |
| Adoption of Miniaturized Assay Formats Reducing Reagent Costs | +0.8% | Global pharma hubs | Long term (≥ 4 years) |
| Integration with AI-Driven Drug-Discovery Platforms | +1.5% | North America, EU, APAC | Short term (≤ 2 years) |
| Expansion of Personalized Medicine Requiring High-Accuracy Handling | +0.9% | North America, EU | Medium term (2-4 years) |
| Permanent Molecular-Diagnostic Capacity Post-COVID-19 | +0.7% | Global reference labs | Short term (≤ 2 years) |
| Government Funding for Automated Bioprocessing | +1.1% | APAC core | Long term (≥ 4 years) |
| Source: Mordor Intelligence | |||


Integration with AI-Driven Drug-Discovery Platforms Accelerating Hit-to-Lead Timelines
Automated workstations that pair with machine-learning algorithms now run iterative design-execute-analyse loops without human intervention. Robots equipped with 19F NMR sensors can evaluate 21 reactions in parallel, enabling discovery teams to compress hit-to-lead cycles by 75%.[1]Korea Advanced Institute of Science and Technology, “AI Transforms New Drug Development,” phys.org Case studies at AstraZeneca and Weill Cornell show these closed-loop systems improving predictive accuracy for synergistic compounds while capturing granular assay metadata that feeds deep-learning models. The time savings and data richness directly translate into earlier patent filings and a better probability of clinical success, keeping the automated liquid handlers market firmly aligned with pharmaceutical digitalization.
Growing Throughput Requirements in High-Volume Genomic Screening (North America)
US reference labs that scaled up during the pandemic now process thousands of clinical genomes daily. Robotic pipetting solutions like the Biomek Echo One trim sample-prep from two hours to 10 minutes. The underlying economics reward laboratories able to push the cost per sequence below USD 100, which is only feasible when workflows are fully automated. As insurers broaden reimbursement for next-generation sequencing, high-capacity systems become default purchases, reinforcing North American leadership in the automated liquid handlers market.
Adoption of Miniaturized Assay Formats Reducing Reagent Costs
Switching from 96-well to 384-well plates slashes reagent use by up to 80%, allowing thousands of screens per day on moderate budgets.[2]Saurabh Vyawahare et al., “Miniaturization of Biological Assays,” Chemistry & Biology, doi.org Microfluidic droplet platforms go further, delivering million-fold volume reductions that unlock single-cell assays at scale. These savings free capital for software upgrades and predictive maintenance contracts, spurring demand for precision robotic dispensers and keeping the automated liquid handlers market responsive to cost containment pressures.
Expansion of Personalized Medicine Driving High-Accuracy Liquid Handling
Companion diagnostics require precise sub-microliter transfers to maintain assay fidelity. Europe and the US mandate traceable sample workflows, and regulators view robotic platforms as the surest path to repeatability. Hospitals integrating tumor sequencing into standard oncology panels prefer cloud-connected robots that feed results back to electronic medical records. This clinical pull strengthens mid-throughput adoption and embeds automation deeper into routine care.
Restraints Impact Analysis of Automated Liquid Handlers Market*
| Restraint | (~) % Impact on CAGR Forecast | Geographic Relevance | Impact Timeline |
|---|---|---|---|
| High Initial CapEx for Flexible Deck Workstations | –0.9% | APAC emerging, MEA, LatAm | Medium term (2-4 years) |
| Skill Gap in Programming and Maintenance | –1.1% | Global, acute in emerging markets | Long term (≥ 4 years) |
| Sample Cross-Contamination Risks in High-Viscosity Liquids | –0.4% | Global process-intensive labs | Short term (≤ 2 years) |
| Legacy LIMS Integration Challenges in Big Pharma | –0.6% | North America, EU | Medium term (2-4 years) |
| Source: Mordor Intelligence | |||
High Initial CapEx for Flexible Deck Workstations in Emerging Markets
Import duties and multi-layer distribution inflate list prices by up to 116%, pushing a USD 350,000 system above USD 750,000 in parts of Africa. Grants rarely cover training or maintenance, leaving labs with unaffordable service contracts. The result is a widening capability gap that risks excluding emerging markets from global genomics consortia, dampening the automated liquid handlers market in these regions.
Skill Gap in Programming and Maintenance of Robotic Systems
Sixty-nine percent of bioprocessing job ads now stipulate automation expertise, yet university programs lag behind industry needs. Without Python scripting or protocol-builder proficiency, technicians underutilize advanced features, cutting expected ROI. Vendors respond with low-code interfaces and remote-support subscriptions, but a structural talent shortage persists, muting the automated liquid handlers market’s potential until vocational curricula catch up.
*Our forecasts treat driver/restraint impacts as directional, not additive. The impact forecasts reflect baseline growth, mix effects, and variable interactions.
Automated Liquid Handlers Market Segment Analysis
By Product Type:
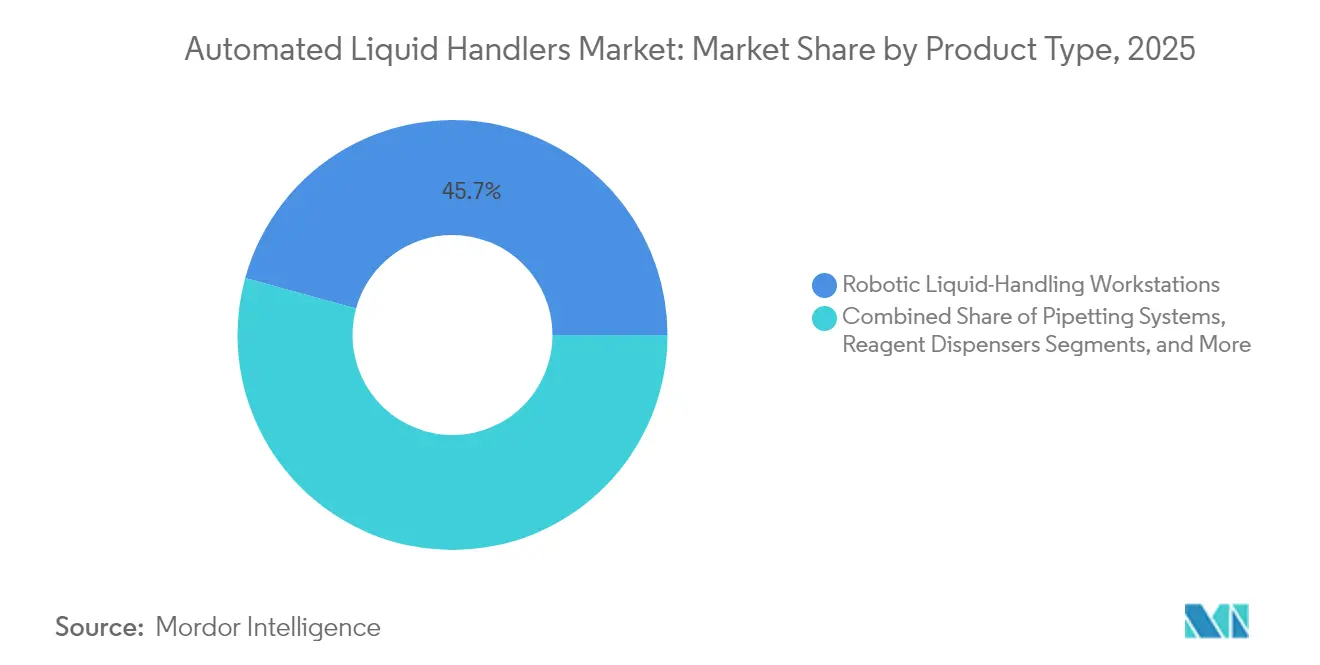
Software Integration Drives Future GrowthRobotic workstations represent the largest slice of the automated liquid handlers market, holding 45.72% market share in 2025, because laboratories still prioritize mechanical precision for repeatable pipetting. Software and services, however, are forecast to grow at 7.59% CAGR as AI modules that schedule runs and predict tip usage deliver immediate cost savings. A growing installed base of robots ensures a recurring stream of consumables, and lubricant-infused tips reduce carry-over in viscous samples.
The product mix is shifting toward platform licences that unlock workflow libraries and cloud analytics. Vendors now bundle subscription dashboards that monitor uptime and flag anomalies, which further elevate software revenue. This pivot transforms competitive dynamics, encouraging ecosystem partnerships and making code libraries a core differentiator in the automated liquid handlers market.


By Throughput Capability:
High-Volume Processing AcceleratesMedium-throughput systems processing 100–1,000 samples per run accounted for 53.12% of the automated liquid handlers market size in 2025. They match typical batch volumes at clinical labs and mid-sized biotechs, offering balanced speed and price. High-throughput units that exceed 1,000 samples log the fastest 6.21% CAGR, thanks to large screening campaigns in drug discovery that surpass 100,000 assays a day.
Unit economics improve sharply once workflows cross 5,000 daily plates, prompting CROs to upgrade ahead of capacity bottlenecks. This trend anchors price premiums for robotic decks with multi-arm configurations and expanded tip racks. It also widens service opportunities in predictive maintenance, adding stability to revenue streams within the automated liquid handlers market.
By Platform Configuration:
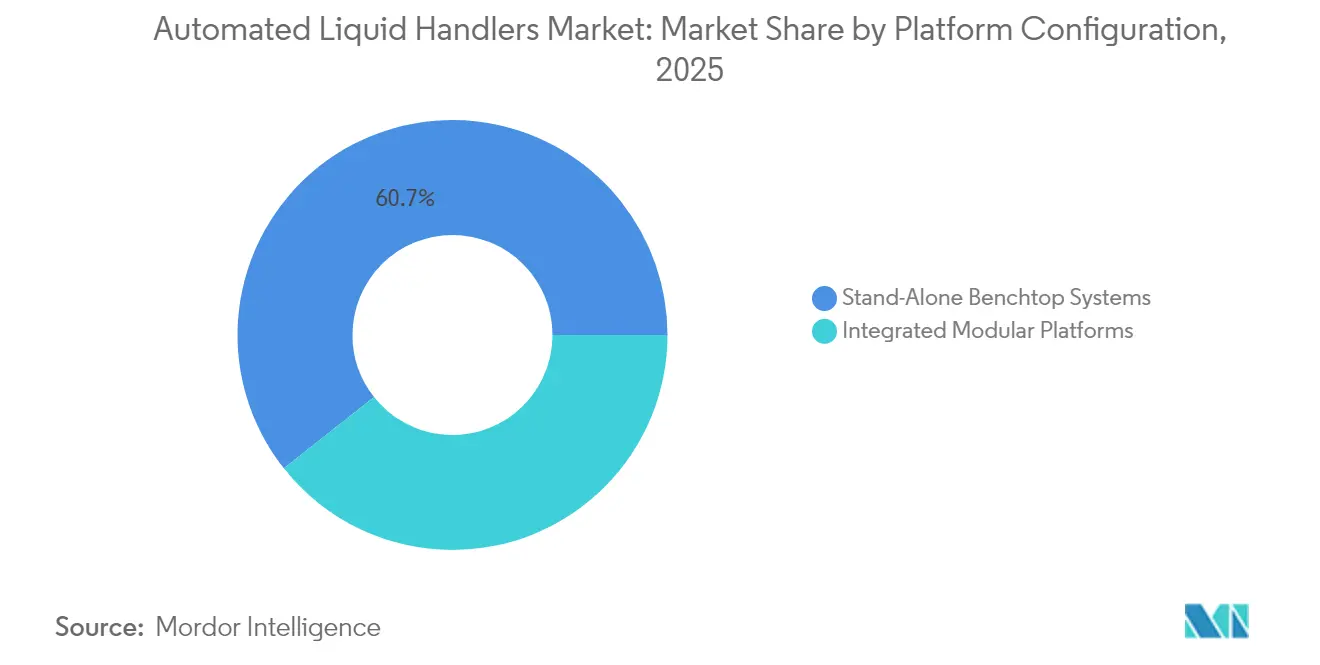
Modular Systems Gain TractionStand-alone benchtop robots held a 60.65% share in 2025 because they suit labs with limited space and capex. Yet modular architectures record an 8.02% CAGR as facilities pursue flexible layouts that link liquid handlers, incubators, and analytical instruments on a single rail.
Modular systems lengthen asset life by allowing incremental capacity upgrades, which lowers the total cost of ownership. Standard interfaces simplify third-party instrument docking, expanding the vendor’s addressable market. As a result, integrated modules form the strategic battleground in the automated liquid handlers market, especially where labs anticipate rapid pipeline shifts.
By Application:
Genomics Drives InnovationDrug discovery retained 34.45% share of automated liquid handlers market size in 2025, anchored by high-content screening pipelines at big pharma. Genomics and proteomics show the quickest 6.62% CAGR through 2031, propelled by permanent sequencing labs established post-pandemic.
Single-cell multiomics protocols that compress library prep into 10 hours highlight the pace of change. Success in this arena pushes vendors to refine dead-volume tolerances and contamination safeguards, upgrades that also benefit adjacent fields such as synthetic biology. Continuous feedback from omics pioneers accelerates product cycles across the automated liquid handlers market.
By End User:
CROs Lead Growth TrajectoryPharmaceutical and biotech firms controlled 49.05% of the automated liquid handlers market share in 2025 because in-house R&D budgets remain large. CROs and CMOs, however, are expanding at a 9.08% CAGR as outsourcing climbs. Contract researchers must finish screens faster and cheaper, so they buy cutting-edge robots early in the cycle.
Academic institutes still rely on grant funding for upgrades, so they favor mid-range models with partial automation. Diagnostic laboratories sustain baseline demand by automating routine PCR plate set-up to maintain staffing continuity. Together, these segments diversify revenue flows and insulate the automated liquid handlers market from shocks in any single customer group.
Geography Analysis
North America Automated Liquid Handlers Market
North America commanded 38.10% share of the automated liquid handlers market in 2025 on the back of permanent molecular diagnostic infrastructure and concentrated pharmaceutical clusters. US-based Thermo Fisher invested USD 2 billion in domestic manufacturing, ensuring short supply chains and compliance support. Canada adds strength in genomics research, while Mexico adopts automation for agrigenomics. The region benefits from venture capital that funds AI-driven lab-tech start-ups, though staffing shortages in robot programming still constrain scale.
APAC Automated Liquid Handlers Market
Asia-Pacific is the fastest-growing region with a 6.82% CAGR through 2031, boosted by China’s 1 trillion yuan robotics initiative and Korea’s USD 128 million intelligent-robot program. Japan leverages decades of automation heritage, and Australia uses federal grants to build GMP-grade bioprocessing sites. Localized service centers cut downtime, overcoming historic reliance on imported technicians. Government procurement policies that favor domestic suppliers accelerate installed-base expansion, cementing Asia-Pacific as the primary incremental revenue source for the automated liquid handlers market.
Europe Automated Liquid Handlers Market
Europe maintains a firm foothold in the automated liquid handlers market through stable pharma pipelines in Germany, the United Kingdom, and France. Regulatory alignment across the EU smooths cross-border tech transfer, while sustainability mandates drive preference for robots with validated CO2 footprints. Southern European labs deploy automation in food and environmental testing, enlarging the addressable demand. Skills gaps are mitigated by apprenticeship programs tied to equipment suppliers, enabling consistent uptime and moderating service costs.

Value Chain Analysis
The value chain begins with critical inputs and subsystems that shape precision and uptime, including pumps, ceramic valves, micro-stepper motors, sensors (for level, leak detection, and verification), control electronics, and software stacks for scheduling and protocol execution. Upstream suppliers also provide high-purity fluid-path infrastructure such as electropolished 316L piping, chemical mixing modules, and closed-loop chemical delivery modules and systems where contamination control and traceability are mandatory.
From there, component flows into OEM assembly of stand-alone benchtop units and integrated workcells, followed by application validation across genomics, clinical sample preparation, and drug discovery, plus adjacent electronics and semiconductor dispensing use cases. Downstream, the market depends on field service, calibration, and recurring consumables, which anchor lifecycle revenue. Go-to-market typically runs through direct sales to large pharmaceutical, biotechnology, and reference lab accounts, with integrators and regional distributors supporting mid-sized labs and emerging markets where import costs and service coverage influence total cost of ownership. Integration partners also play an outsized role by connecting robots to LIMS/ELN and adjacent instruments, while end users increasingly buy bundled offerings that include workflow libraries, remote diagnostics, and preventive maintenance. Recent supply-side activity shows that collaboration between equipment OEMs and high-volume manufacturing sites can translate into tighter linkage between hardware performance and software-controlled process repeatability, particularly as dispensing accuracy and chemical supply infrastructure are upgraded.
Competitive Landscape
The automated liquid handlers market shows moderate consolidation. Thermo Fisher’s USD 4.1 billion acquisition of Solventum’s purification and filtration unit signals a strategy to integrate upstream sample processing with robotic liquid handling. Similar vertical plays appear as vendors bolt on analytical detectors and data-science suites to secure end-to-end ownership.
Strategic partnerships are reshaping rivalries. ABB Robotics joined with Mettler-Toledo to embed weight verification directly on robot decks, improving assay accuracy without reallocating plates.[5]Source: ABB, “ABB Robotics and Mettler-Toledo Join Forces,” new.abb.com Agilent pairs its chromatography systems with ABB arms, offering turnkey workflows that shrink training time. These alliances reflect a pivot from hardware differentiation to ecosystem competition in the automated liquid handlers market.
Emerging entrants exploit AI to carve niches. Start-ups offer cloud simulators that auto-generate pipetting protocols, reducing onboarding time for new users. Open-source middleware fosters interoperability, pressuring incumbents to embrace standardized APIs. White-space opportunities persist in emerging markets, where cost-optimized models can undercut premium imports laden with distribution mark-ups.
Automated Liquid Handlers Industry Leaders
Thermo Fisher Scientific Inc.
Perkin Elmer Inc.
Mettler-Toledo International Inc.
Corning Inc.
Danaher Corporation
- *Disclaimer: Major Players sorted in no particular order
Automated Liquid Handlers Market Companies Covered in this Report
- Thermo Fisher Scientific Inc.
- Danaher Corp. (Beckman Coulter Life Sciences)
- Tecan Group Ltd.
- Hamilton Company
- PerkinElmer Inc. (Revvity)
- Agilent Technologies Inc.
- Mettler-Toledo International Inc.
- Becton, Dickinson and Company
- Eppendorf AG
- Formulatrix Inc.
- Aurora Biomed Inc.
- Sartorius AG (Biohit)
- Synchron Lab Automation
- Hudson Robotics Inc.
- Analytik Jena AG (Endress + Hauser)
- Opentrons Labworks Inc.
- Biosero Inc. (BICO Group)
- Gilson Inc.
- Lab Services B.V.
- Andrew Alliance S.A. (Waters)
- Integra Biosciences AG
- Corning Incorporated
- SPT Labtech Ltd.
- Festo AG and Co. KG
- Starlab International GmbH

Market Opportunities and Future Outlook
Whitespace is building around software-orchestrated automation that reduces reliance on specialized operators and standardizes execution across multi-user labs, especially where programming skill gaps constrain ROI. Quality control and analytical sample preparation is an adoption pathway beyond core R&D: in May 2026, ROHTO Pharmaceutical began operational testing of an automated HPLC analytical sample preparation system at its Rohto Group Quality Inspection Center, positioning automation as a response to engineer shortages and routine QC throughput. This supports opportunities for liquid handling platforms that integrate with analytics, enforce protocol governance, and generate audit-ready data trails.
Cell and gene therapy manufacturing is also a higher-value area where automation needs extend beyond pipetting into sterile, robot-friendly consumables and connectors. In May 2026, CPC Biotech and Multiply Labs collaborated to develop a robot-optimized aseptic connector (MicroCNX Nano Series) aimed at improving robotic manipulation of soft materials such as bags and tubing, pointing to demand for end-to-end, automation-compatible fluid transfer interfaces. Separately, pharma interest in self-driving lab concepts is reinforced by Telescope Innovations securing its third SDL deployment contract of its 2026 fiscal year for crystallization workflows, which supports opportunities for vendors packaging liquid handling with closed-loop experimentation, data management, and validated integrations rather than selling standalone hardware.
Recent Industry Developments in Automated Liquid Handlers Market
- March 2026: Thermo Fisher Scientific launched the Fluid Ease Pro ClipTip electronic pipette with a 2.0-inch color IPS LCD capacitive touchscreen aimed at improving protocol execution and multi-user profile management. The product direction emphasizes software-guided operation and standardized run control, supporting broader efforts to reduce operator variability in routine liquid handling.
- July 2025: PerkinElmer (Covaris) entered a strategic partnership with Hamilton Company to co-market the truXTRAC FFPE SMART Solution, built around the Hamilton Sonication STAR liquid handler for automated nucleic acid extraction from FFPE samples. Pairing specialized sonication with a widely deployed liquid handling platform broadens turnkey genomics sample-prep offerings for labs seeking repeatability and higher throughput.
- June 2024: Thermo Fisher Scientific introduced the KingFisher PlasmidPro Maxi Processor, positioned as a fully automated maxi-scale plasmid DNA purification system that uses pre-filled cartridges to remove multiple manual steps. The cartridge-based approach tightens process consistency and reduces hands-on time, aligning with demand for press-and-go sample preparation workflows.


Automated Liquid Handlers Market Report Scope and Research Methodology
Market Definition and Coverage
For this study, the automated liquid handlers market covers instruments and integrated systems that automatically aspirate, dispense, mix, and transfer liquids for lab workflows, and it is measured in revenue terms across major end-use laboratories and geographies.
Scope exclusions: Handheld manual pipettes, general-purpose lab plasticware sold without automation, and non-lab industrial fluid dosing equipment are excluded.
Segments Covered in This Report
- By Product Type
- Robotic Liquid-Handling Workstations
- Pipetting Systems
- Reagent Dispensers
- Consumables (Tips, Plates, Reagents)
- Software and Services
- By Throughput Capability
- Low Throughput (Less than 100 samples/run)
- Medium Throughput (100-1000 samples/run)
- High Throughput (Above 1 000 samples/run)
- By Platform Configuration
- Stand-Alone Benchtop Systems
- Integrated Modular Platforms
- By Application
- Drug Discovery and Lead Optimization
- Genomics and Proteomics
- Clinical Diagnostics
- Cell Biology and Stem-Cell Research
- Synthetic Biology and Bioprocess Development
- Other Applications
- By End User
- Pharmaceutical and Biotechnology Companies
- CROs and CMOs
- Academic and Research Institutes
- Clinical and Diagnostic Laboratories
- Forensic and Environmental Testing Labs
- By Geography
- North America
- United States
- Canada
- Mexico
- Europe
- Germany
- United Kingdom
- France
- Italy
- Spain
- Rest of Europe
- Asia-Pacific
- China
- Japan
- South Korea
- India
- South East Asia
- Rest of Asia-Pacific
- South America
- Brazil
- Rest of South America
- Middle East and Africa
- Middle East
- United Arab Emirates
- Saudi Arabia
- Rest of Middle East
- Africa
- South Africa
- Rest of Africa
- Middle East
- North America
Data Sources, Market Sizing, and Validation
Desk Research
Desk research was used to set a starting point on where demand comes from and how purchasing typically happens. We reviewed public sources such as the US FDA databases (for diagnostics and lab system context), US National Institutes of Health funding data (for research activity), OECD health and R&D indicators, and the World Bank macro series (to normalize spending across regions).
To cross-check adoption signals, we also referenced peer-reviewed journals on lab automation and high-throughput screening, select patent databases (to gauge filing intensity), and customs or trade statistics (to indicate instrument import flows in key hubs). Company annual reports, investor presentations, and reputable press releases were then used to validate product positioning and pricing ranges. Some paid subscriptions for company financials and patent intelligence were used selectively where public disclosure was limited. These examples are not exhaustive, and other public sources were also used for data collection, validation, and clarification.
Primary Interviews and Surveys
Primary work focused on validating what is counted as an automated liquid handler sale, what portion is recurring, and how pricing changes by throughput and end user. We spoke with manufacturers, distributors, lab managers, procurement leads, and service partners across APAC, EMEA, and the Americas, so assumptions from desk research could be challenged and refined before final sizing.
Distribution of primary research fieldwork respondents
| Company type | Respondent position | Region |
|---|---|---|
| Top tier: 29% | CXOs: 18% | APAC: 49% |
| Mid tier: 53% | Functional/Unit leaders: 35% | EMEA: 30% |
| Smaller Players: 18% | Managers: 47% | Americas: 21% |
Market-Sizing & Forecasting
Sizing starts with a top-down build that links automated liquid handler demand to the lab workflow demand pool, then reconstructs spend using instrument procurement cycles and typical system configurations by lab type. Key inputs include research and clinical testing activity levels, lab automation penetration by workflow (sample prep, assay setup, plate handling), average selling prices by throughput class, install base replacement timing, and the split between new systems and add-on modules.
Results are corroborated with selective bottom-up approximations, including rolling up a sampled set of supplier revenues where disclosure is available and checking implied unit volumes against trade flows and interview-based channel checks. Where data is patchy for smaller geographies, we use proxy indicators such as R&D spend and hospital or reference lab density, followed by a sanity check on affordability ranges.
For forecasting, scenario analysis is used because adoption is sensitive to funding cycles, biologics and genomics workload, and capital spending constraints. Assumptions on price progression and mix shifts toward higher-throughput platforms are reviewed with interviewees, and the final trajectory is adjusted only when leading indicators move in the same direction.
Data Validation & Update Cycle
Validation is done through multiple checks so the totals do not rely on any single data series. We compare outputs against independent signals such as research funding direction, import trends for lab instruments, and implied install base growth, then investigate any variance that appears inconsistent with what interviewees described.
Before sign-off, the model goes through multi-step analyst review where definitions, math logic, and key assumptions are re-checked, followed by re-contact triggers when a gap is material or a datapoint looks inconsistent. Reports are refreshed annually, and interim updates are made when major events occur, such as regulatory shifts, pricing shocks, or sudden changes in lab funding. Right before delivery, an analyst performs a fresh pass so clients receive the latest updated view.
Mordor Intelligence's Automated Liquid Handlers Market Size Versus Other Published Estimates
Published market sizes for automated liquid handlers can look far apart, even when the topic name sounds identical, because each publisher makes different choices on what products are included, which year is treated as the base, and how pricing and replacement cycles are modeled. Differences also come from how quickly assumptions are updated when funding, procurement timing, or mix shifts change.
The main gap comes from whether adjacent categories like broader liquid handling systems, consumables-heavy bundles, or lab automation platforms are folded into the same number. Mordor Intelligence counts automated liquid handlers as automation equipment revenue aligned to lab workflow use and separates out items that are not sold as part of the automated handling system value. Other spreads usually trace back to how ASP changes are treated, whether forecasts reflect a conservative or aggressive adoption case, and whether currency conversion uses an average-year rate or a point-in-time rate.
Benchmark comparison
| Source | Market Size | Gaps in Research Methodology |
|---|---|---|
| Mordor Intelligence | USD 1.31 B (2026) | |
| Healthcare Publisher A | USD 1.44 B (2025) | Uses a different base year and a longer forecast window, and the scope appears to blend broader automated liquid handling spend with adjacent workflow solutions, which can lift the starting value. |
| Industry Data Portal B | USD 0.95 B (2024) | Relies on a narrower revenue definition that can undercount service and configuration upgrades, and it may anchor pricing and volumes to a limited set of reported shipments and older ASP points. |
The comparison shows that year selection and scope boundaries drive most of the spread, and pricing and refresh cadence explain the rest. By keeping the model tied to observable demand signals like workflow adoption, install base replacement, and throughput-linked ASP bands, the final number stays traceable and repeatable for planning.


Key Questions Answered in the Report
What is the current value of the automated liquid handlers market?
The market stands at USD 1.31 billion in 2026 and is projected to reach USD 1.74 billion by 2031.
Which region grows the fastest in automated liquid handlers adoption?
Asia-Pacific records the highest 6.82% CAGR through 2031, driven by large-scale government robotics funding.
Which product segment is expected to grow quickest?
Software and services lead with a 7.59% CAGR because laboratories now prioritize AI-driven workflow optimisation.
How are CROs influencing automated liquid handler demand?
CROs post a 9.08% CAGR as they automate to compete on turnaround time and cost for outsourced R&D projects.
What major challenge slows adoption in emerging markets?
High capital expenditure, sometimes 116% above developed-market pricing, remains the principal barrier to robotic deployment.
How will AI change the automated liquid handlers landscape?
Integration of machine-learning models that design and adjust experiments in real time will cut hit-to-lead timelines by up to 75%, reshaping vendor competition toward software capability.
Page last updated on:





