Automated Smart Locker System Market Size and Share
Market Overview
| Study Period | 2020 - 2031 |
|---|---|
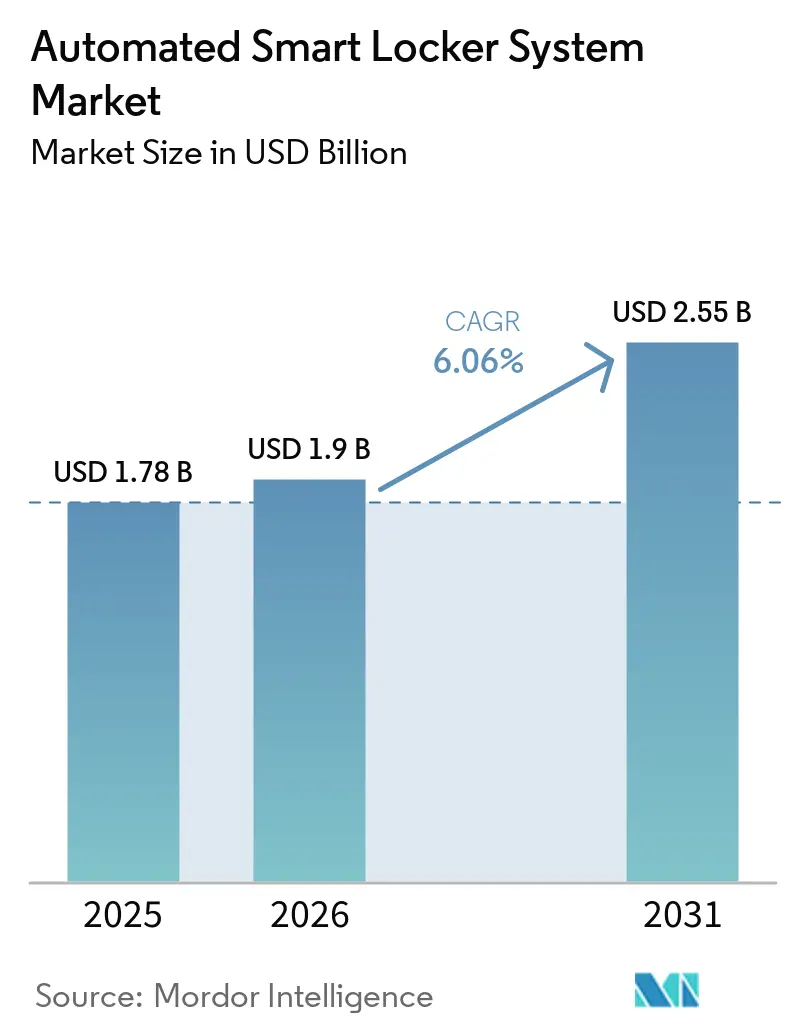
| Market Size (2026) | USD 1.9 Billion |
| Market Size (2031) | USD 2.55 Billion |
| Growth Rate (2026 - 2031) | 6.06% CAGR |
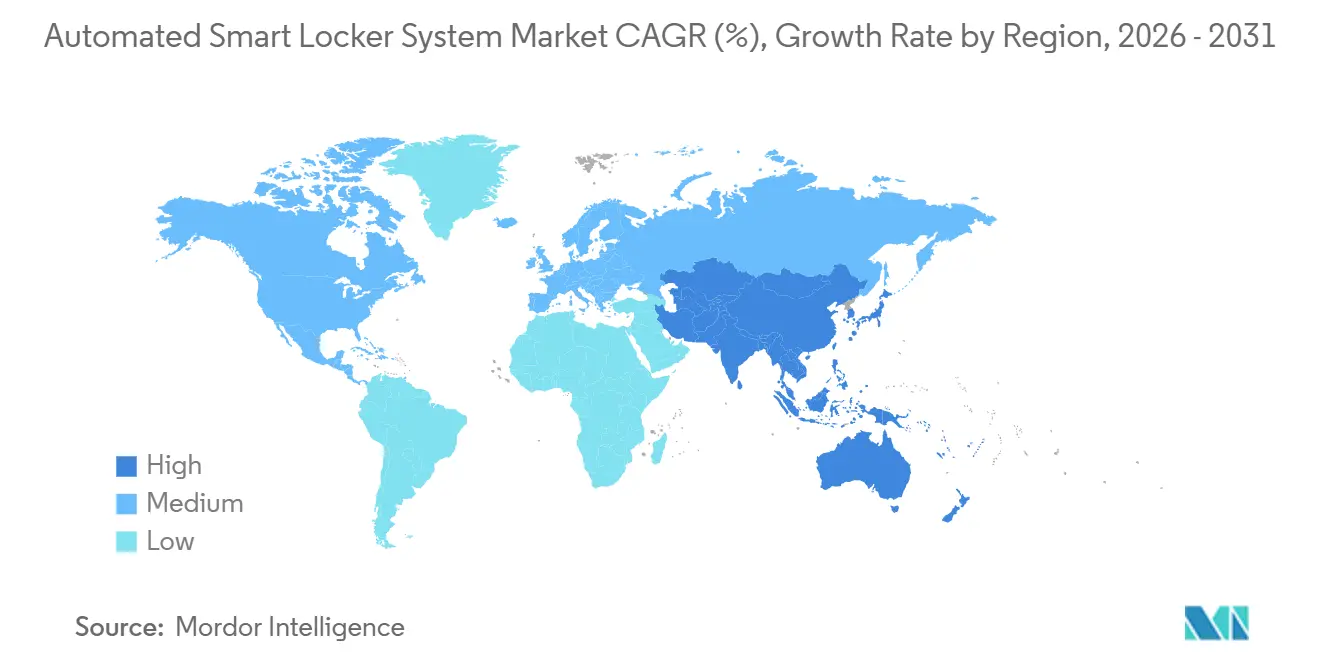
| Fastest Growing Market | Asia Pacific |
| Largest Market | North America |
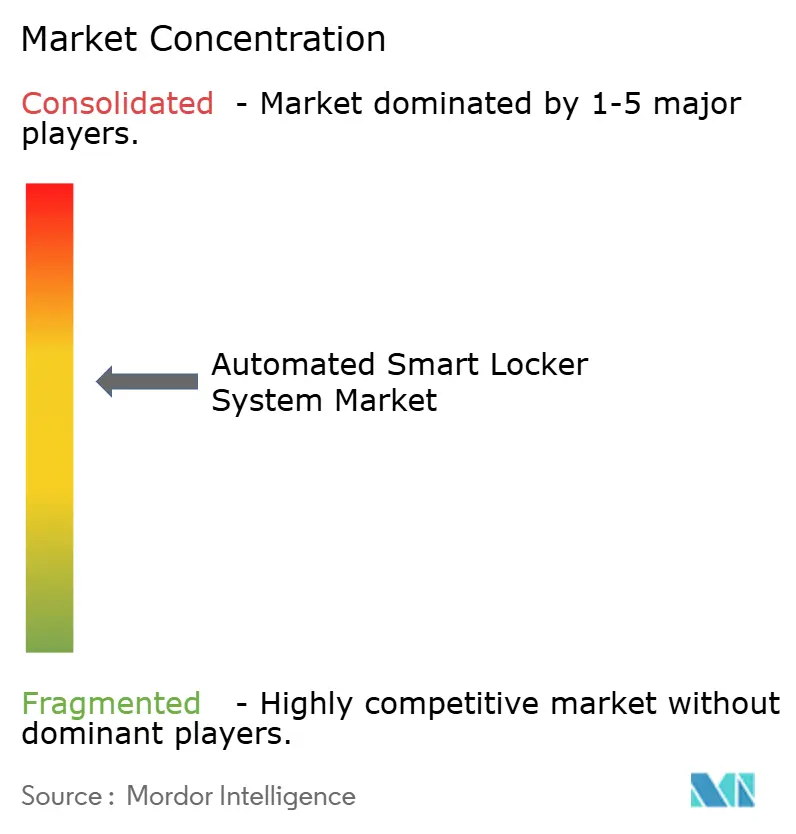
| Market Concentration | Medium |
Major Players *Disclaimer: Major Players sorted in no particular order Image © Mordor Intelligence. Reuse requires attribution under CC BY 4.0. | |
Automated Smart Locker System Market Analysis by Mordor Intelligence
The Automated smart locker system market size is expected to grow from USD 1.78 billion in 2025 to USD 1.90 billion in 2026 and is forecast to reach USD 2.55 billion by 2031 at 6.06% CAGR over 2026-2031. Volume growth in global e-commerce, multifamily housing, and corporate campuses underpins demand, yet infrastructure capex limits and component-cost inflation keep expansion to the mid-single-digit range. Parcel volumes climbed to 121 billion units in 2025, pushing carriers to seek unattended drop-off formats that compress last-mile costs. At the same time, property developers weigh locker hardware prices ranging from USD 2,500 to USD 21,000 per unit against uncertain utilization, which moderates installation velocity. Software-centric business models that wrap lockers with remote diagnostics and open APIs are emerging as a margin-accretive hedge, helping vendors convert one-time equipment sales into recurring revenue. Regional dynamics reinforce this pattern: North America holds the highest value share of premium feature sets, while Asia-Pacific is pacing unit growth amid unparalleled parcel density.
Key Report Takeaways
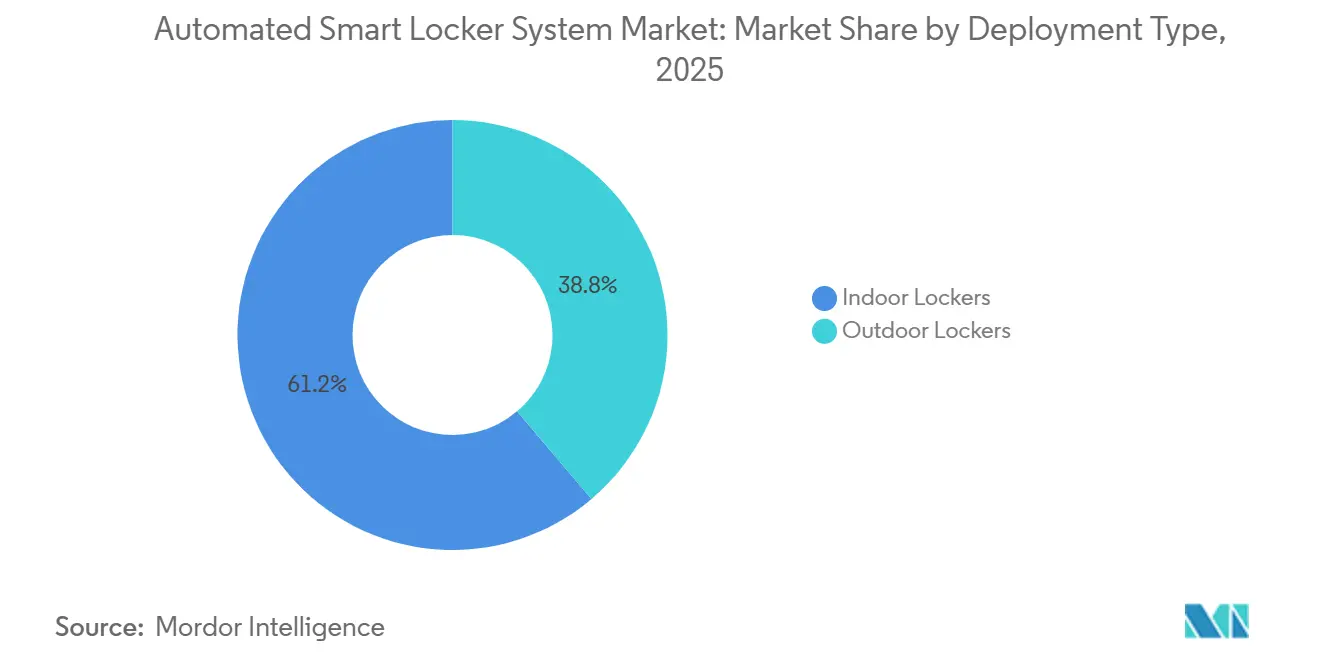
- By deployment type, indoor units led with 61.18% of the automated smart locker system market share in 2025, and outdoor lockers are projected to post the fastest expansion at a 6.58% CAGR through 2031.
- By component, hardware accounted for 67.27% of the automated smart locker system market in 2025, while software and platform services are forecast to grow at 6.94% to 2031.
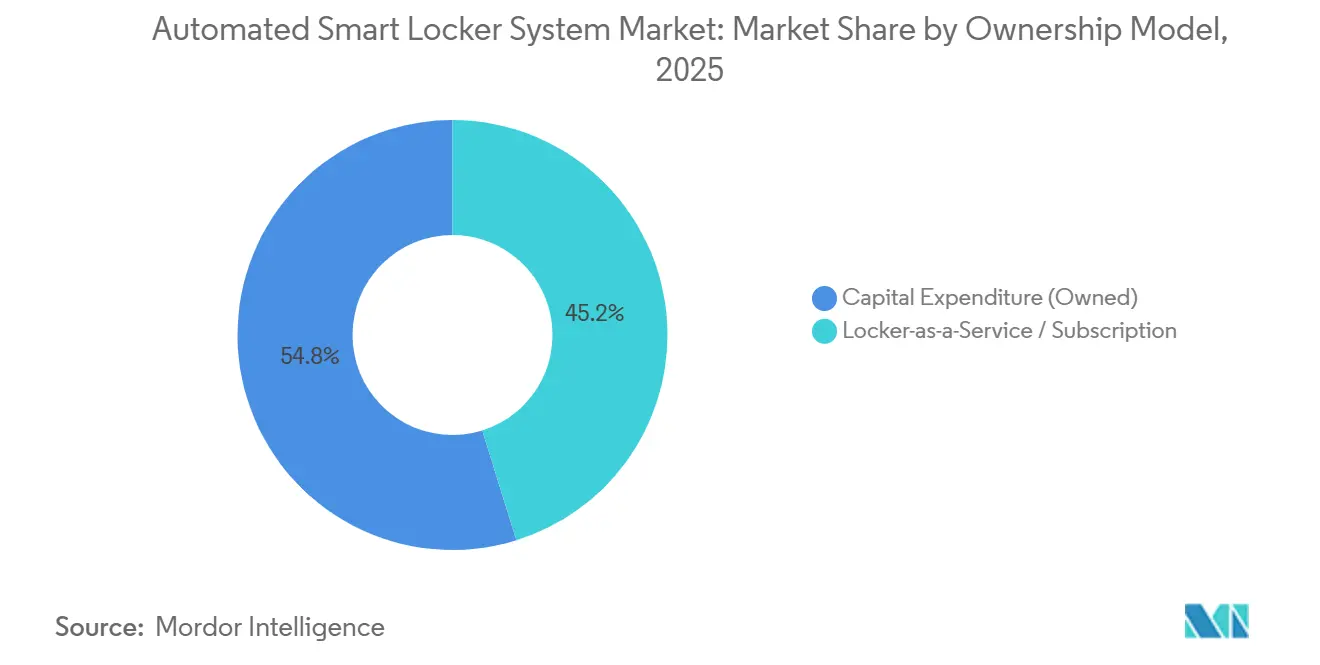
- By ownership model, capital-expenditure purchasing accounted for 54.81% of the automated smart locker system market in 2025; locker-as-a-service subscriptions will grow at 6.83% through 2031.
- By end-user, retail and e-commerce accounted for 38.53% of the automated smart locker system market in 2025, whereas logistics hubs are the fastest movers, with a 6.64% CAGR to 2031.
- By Geography, North America held 36.76% of the automated smart locker system market in 2025, and Asia-Pacific is projected to expand at 6.89% over the forecast period.
Note: Market size and forecast figures in this report are generated using Mordor Intelligence’s proprietary estimation framework, updated with the latest available data and insights as of January 2026.
Global Automated Smart Locker System Market Trends and Insights
Drivers Impact Analysis*
| Driver | (~) % Impact on CAGR Forecast | Geographic Relevance | Impact Timeline |
|---|---|---|---|
| Surge in Global E-Commerce Parcel Volumes | +1.8% | Global, strongest in Asia-Pacific and North America | Long term (≥ 4 years) |
| Urban-Density Last-Mile Congestion Regulation | +1.2% | North America and Europe, rising in Asian megacities | Medium term (2-4 years) |
| Retail Omni-Channel Click-and-Collect | +1.1% | North America and Europe, selective Middle East adoption | Medium term (2-4 years) |
| Accelerated Demand for Contact-Free Pickup | +0.9% | Global, most visible in high-density urban corridors | Short term (≤ 2 years) |
| Enterprise IT-Asset Automation | +0.7% | North America and Europe corporate campuses | Medium term (2-4 years) |
| Smart-City Incentive Credits | +0.5% | Pilot corridors in North America, Europe, and Asia-Pacific | Long term (≥ 4 years) |
| Source: Mordor Intelligence | |||
Surge in Global E-Commerce Parcel Volumes
Annual parcel traffic reached 121 billion units in 2025, a 10% jump that stretched warehouse capacity and raised failed-delivery costs to as high as USD 7 per re-attempt.[1]Pitney Bowes, “Parcel Shipping Index,” pitneybowes.com Automated locker banks pool dozens of handoffs into one stop, trimming fuel and labor outlays and lowering urban congestion. China illustrates the network-effect payoff, as locker penetration of roughly 15-20% in tier-1 cities spreads fixed costs across immense throughput, enabling transaction fees that undercut those of attended delivery. Cross-border flows reinforce this logic: customs-bonded lockers at airports allow travelers to clear duties while bypassing warehouses, a model now piloted at several United States ports of entry.[2]U.S. Customs and Border Protection, “E Commerce Strategy,” cbp.gov
Urban-Density Last-Mile Congestion Regulation
Municipal curb-use rules in New York, San Francisco, and London dedicate micro-fulfillment zones to alleviate double-parking violations that caused 23% of urban traffic delays in 2024.[3]New York City Department of Transportation, “Curb Management Pilot Report,” nyc.gov Carriers without locker access now face fines that climb past USD 115 per infraction in New York, while operators that install compliant outdoor banks secure priority curb real estate. Public co-investment is accelerating roll-outs: Portland’s 2025 call for microhubs and the United States Department of Transportation’s Urban Freight Lab grant exemplify cities subsidizing lockers that promise lower vehicle-miles-traveled.[4]U.S. Department of Transportation, “Urban Freight Lab Grant Awards,” transportation.gov Europe pushes even harder through low-emission zones that exempt e-cargo bikes feeding neighborhood lockers.
Retail Omni-Channel Click-and-Collect Roll-Outs
Retailers report that 18-22% of e-commerce buyers convert to in-store upsells when collecting orders from lockers, boosting basket value by up to USD 18 per trip. InPost’s strategic alliance with fashion retailer Next to install 20,000 lockers across Europe by 2027 positions the technology as a 24/7 brand touchpoint that extends store trading hours. The economics sharpen in categories with double-digit return rates because lockers slash customer-service labor for reverse logistics. Transit-hub deployments in Tokyo’s Shibuya Station lifted utilization to 78% once lockers were linked to fare-card systems, showing how commuter traffic intensifies throughput.
Accelerated Demand for Contact-Free Pickup Post-COVID-19
Even after social-distancing rules ended, 35% of North American online shoppers and 82% of Chinese buyers still selected lockers in 2025, prioritizing convenience and theft prevention. Multifamily housing drove 63% of United States installations that year as property managers aimed to curb lobby package pile-ups. Locker vendors responded with biometric authentication and mobile app unlocking that cuts retrieval time under 30 seconds, while corporate campuses adopted the same infrastructure to distribute IT assets without staffed mailrooms.
Restraints Impact Analysis*
| Restraint | (~) % Impact on CAGR Forecast | Geographic Relevance | Impact Timeline |
|---|---|---|---|
| Escalating Steel and Electronics Tariffs | -0.5% | Global, most acute in North America and Europe | Short term (≤ 2 years) |
| High Upfront Hardware and Installation Capex | -0.4% | Worldwide, especially emerging markets | Medium term (2-4 years) |
| Limited Rural Telecom and Power Infrastructure | -0.3% | Rural zones of North America, South America, Africa, parts of Asia-Pacific | Long term (≥ 4 years) |
| Cyber-Security and Data-Privacy Compliance Risk | -0.2% | Europe, North America, and China | Medium term (2-4 years) |
| Source: Mordor Intelligence | |||
Escalating Steel and Electronics Tariffs Inflating BOM Cost
Section 232 steel duties of 25% and reciprocal Section 122 measures of 15% add roughly 40% to the cost of imported metal enclosures, while electronics levies of up to 100% on microcontrollers have pushed cumulative bill-of-materials increases toward 65% for locker makers sourcing from Asia. Commodity inputs are volatile: copper rose 46.8% and tungsten sevenfold between 2024 and early 2026, swinging gross margins by as much as 12 percentage points. Vendors now redesign cabinets with thinner-gauge steel or ABS panels, yet durability trade-offs may inflate warranty expenses over the 7-10-year lifespan.
High Upfront Hardware and Installation Capex
Complete locker arrays range from USD 2,500 for entry-level indoor units to USD 21,000 for rugged, temperature-controlled outdoor clusters, with labor adding another 15-25% to the project cost. Payback periods stretch three to five years unless utilization tops 50%, a threshold difficult to hit in suburban and exurban postal zones where parcel density falls below 20 units per square kilometer. Subscription contracting at USD 200-800 per locker each month softens balance-sheet strain but transfers residual-value and service-call risk to vendors. Rural installs pay a 30% capital premium for site preparation and often need hybrid solar-battery systems that add USD 3,000-5,000 per site.
*Our forecasts treat driver/restraint impacts as directional, not additive. The impact forecasts reflect baseline growth, mix effects, and variable interactions.
Segment Analysis
By Deployment Type: Outdoor Units Gain Curbside Traction
Indoor lockers accounted for 61.18% of the automated smart locker system market share in 2025 on the strength of deployments in climate-controlled lobbies and back-of-house retail corridors. Outdoor units are set to expand at a 6.58% CAGR, propelled by municipal curb-space policies that encourage carriers to shift failed residential deliveries into self-service kiosks at sidewalks and transit hubs. InPost’s acquisition of Bloq.it inserts 20,000 battery-powered, grid-free banks across Europe, trimming permitting timelines. These rugged cabinets must survive −40 °C to +60 °C swings and meet IP-65 electronics standards, driving per-unit costs about 45% over indoor versions.
Outdoor lockers enable carriers to bypass building access issues entirely. The United States Postal Service placed 3,200 public kiosks across 45 states by late 2025 to extend rural service windows. Refrigerated variants capture premium niches in pharmacy and grocery, where controlled temperature ranges of 2-8 °C are mandatory for vaccine or fresh-food chains of custody.


By Component: Software Subscriptions Outpace Hardware Sales
Hardware still accounted for 67.27% of the automated smart locker system market in 2025, yet recurring platform fees are the faster-growing segment at 6.94% through 2031. Vendors such as KEBA now charge USD 15-40 per unit per month for cloud dashboards that monitor door strikes, predict maintenance, and expose RESTful APIs for warehouse system integration. Attach rates climbed from 38% in 2023 to 52% in 2025, cushioning price pressure as indoor cabinet average selling prices slid to USD 3,600.
Open-standards workstreams under IEEE and ISO aim to curb proprietary lock-in that previously forced retailers to pay USD 50,000 per site for custom interfaces. Security audits also enhance subscription value: SOC 2 Type II-certified vendors achieve 15-20% pricing uplifts in enterprise bids by reducing buyer compliance workload.
By Ownership Model: Subscription Agreements Ease Balance-Sheet Strain
Capital purchases made up 54.81% of 2025 lockers, reflecting logistics majors’ appetite to amortize assets over a decade. Locker-as-a-service contracts are forecast to grow 6.83%, appealing to smaller retailers that prefer operating expenses to capex. Typical deals lock buyers into three- to five-year agreements with renewal clauses that secure cash flow visibility for vendors. However, early terminations tied to tenant bankruptcy can strand hardware, prompting suppliers to demand letters of credit or parental guarantees equal to 12-18 months of fees.
Hybrid structures are gaining favor. Retailers may own the steel boxes but lease software so that quarterly feature pushes, dynamic pricing, and sentiment analytics arrive without fresh capex. Vendors need 55-60% steady occupancy under pure subscription models to break even, tying their profitability to the health of customer order volumes.
By End-User Industry: Transit-Oriented Logistics Leads Growth
Retail and e-commerce accounted for 38.53% of the automated smart locker system market in 2025 through click-and-collect programs that drive online orders to brick-and-mortar stores. Logistics and transportation hubs, however, are the highest-growth vertical at 6.64% CAGR because carriers now anchor banks at train, metro, and airport nodes where commuter footfall guarantees throughput. Shibuya Station’s 78% utilization validates the model and shortens carrier delivery tours.
Multifamily housing dominated North American installations by count, yet corporate campuses drove the greatest subscription revenue by automating IT-asset distribution that previously required staffed mailrooms. Education, healthcare, and public-sector users remain single-digit slices of revenue but command premium pricing on regulatory compliance features.
Geography Analysis
North America led worldwide installations with 36.76% in 2025, reflecting higher feature bundles and average selling prices. The United States alone operated more than 15,000 banks, clustered in coastal and Sun Belt metros with dense multifamily stock. Corporate take-up climbed 39% year over year as employers sought to cut mailroom labor costs. USPS layered 3,200 public outdoor units onto rural post offices to maintain service levels where staffed counters were scaled back.
Asia-Pacific is forecast to grow at 6.89% through 2031, driven by China’s 130 billion annual parcels and emerging smart-city mandates that encourage locker density targets of one bank per 450 urban residents. Hive Box holds roughly a 19% regional share with more than 200,000 installations, while India’s market crossed 43.2 million parcels in 2025, driven by 36% annual e-commerce growth. Japan and South Korea prioritize transit-hub banks that authenticate with national ID cards, pushing usage rates well above global norms.
Europe accounted for just over one-fifth of shipments in 2025, anchored by InPost’s 61,196 machines. The company processed 1.36 billion parcels that year and earmarked GBP 600 million (USD 723 million) to raise United Kingdom density to 20,000 units by 2029. France counts more than 10,000 kiosks, with 68% of urban shoppers expressing preference for parcel machines. Middle East and Africa reached USD 52.88 million in 2025 revenue, paced by the United Arab Emirates at 1,200 units and 22% annual growth in Saudi Arabia. South America remains in pilot stage as Brazil and Argentina run limited urban tests amid payment-system integration hurdles.

Competitive Landscape
The automated smart locker system market exhibits moderate concentration. The leading suppliers hold a significant share of the market, with no single brand dominating entirely. InPost stands out for its extensive network and operational efficiency, showcasing consistent growth. Hive Box maintains a strong presence in the Asia-Pacific region, leveraging its widespread cabinet installations. Quadient, KEBA, and Cleveron strengthen their positions through robust patent portfolios and strategic multi-country contracts.
Vendors cluster along three playbooks. First, network-density strategies pursue market share by blanketing high-traffic sites to spread fixed costs across more sites. Second, platform-subscription pivots seek margin insurance via analytics, predictive maintenance, and enterprise APIs. Third, vertical integration rolls lockers into broader last-mile logistics offerings, positioning suppliers as one-stop delivery partners.
Niche challengers exploit white space. Cleveron fields robotic parcel towers that stack vertically to cut urban real-estate cost by 60% versus horizontal banks, while Luxer One’s integration with property software trims landlord admin labor by 35%. Compliance credentials evolve into a moat: SOC 2 and ISO 27001 certificates command 20% price premiums because they shorten enterprise audit cycles.
Material cost shocks, however, squeeze the field. Smaller incumbents lack bargaining clout with component foundries, making them vulnerable to copper, steel, and chip volatility. The rise of locker-as-a-service intensifies capital burden on vendors, amplifying industry shake-out risk when utilization misses break-even occupancy.
Automated Smart Locker System Industry Leaders
Quadient S.A.
InPost S.A.
KEBA AG
Cleveron AS
Luxer Corporation
- *Disclaimer: Major Players sorted in no particular order

Recent Industry Developments
- March 2026: InPost confirmed a plan to expand its United Kingdom network to 20,000 units by 2029, backed by GBP 600 million (USD 723 million) in fresh capital.
- February 2026: KEBA rolled out its Loxmate cloud upgrade featuring real-time utilization analytics and predictive maintenance APIs priced at USD 20-45 per locker monthly.
- January 2026: Quadient submitted a U.S. patent for AI-based dynamic locker allocation that forecasts demand surges to pre-stage inventory and cuts pickup waits by 40%.
- December 2025: Hive Box raised USD 150 million in Series D funding led by Cainiao Network to bankroll expansion into Southeast Asia and the Middle East.


Global Automated Smart Locker System Market Report Scope
The Automated Smart Locker System Market Report is Segmented by Deployment Type (Indoor Lockers, Outdoor Lockers), End-User Industry (Retail and E-Commerce, Residential/Multi-Family Housing, Corporate and Office Campuses, Logistics and Transportation Hubs, Education Facilities, Other End-User Industry), Component (Hardware, Software and Platform Services), Ownership Model (Capital Expenditure/Owned, Locker-as-a-Service/Subscription), and Geography (North America, Europe, Asia-Pacific, Middle East and Africa, South America). The Market Forecasts are Provided in Terms of Value (USD).
| Indoor Lockers |
| Outdoor Lockers |
| Retail and E-Commerce |
| Residential / Multi-Family Housing |
| Corporate and Office Campuses |
| Logistics and Transportation Hubs |
| Education Facilities |
| Other End-User Industry |
| Hardware |
| Software and Platform Services |
| Capital Expenditure (Owned) |
| Locker-as-a-Service / Subscription |
| North America | United States |
| Canada | |
| Mexico | |
| Europe | Germany |
| United Kingdom | |
| France | |
| Italy | |
| Rest of Europe | |
| Asia-Pacific | China |
| Japan | |
| India | |
| South Korea | |
| Australia | |
| Rest of Asia-Pacific | |
| South America | |
| Middle East and Africa |
| By Deployment Type | Indoor Lockers | |
| Outdoor Lockers | ||
| By End-User Industry | Retail and E-Commerce | |
| Residential / Multi-Family Housing | ||
| Corporate and Office Campuses | ||
| Logistics and Transportation Hubs | ||
| Education Facilities | ||
| Other End-User Industry | ||
| By Component | Hardware | |
| Software and Platform Services | ||
| By Ownership Model | Capital Expenditure (Owned) | |
| Locker-as-a-Service / Subscription | ||
| By Geography | North America | United States |
| Canada | ||
| Mexico | ||
| Europe | Germany | |
| United Kingdom | ||
| France | ||
| Italy | ||
| Rest of Europe | ||
| Asia-Pacific | China | |
| Japan | ||
| India | ||
| South Korea | ||
| Australia | ||
| Rest of Asia-Pacific | ||
| South America | ||
| Middle East and Africa | ||


Key Questions Answered in the Report
What is the projected value of the Automated smart locker system market in 2031?
It is forecast to reach USD 2.55 billion by 2031, rising from USD 1.90 billion in 2026.
Which region is expected to record the fastest growth through 2031?
Asia-Pacific is projected to advance at a 6.89% CAGR on unparalleled parcel density and smart-city incentives.
Why are outdoor lockers gaining traction in cities?
Curb-use regulations and micro-fulfillment zoning favor rugged outdoor banks that lower double-parking fines and streamline last-mile routes.
How are vendors offsetting hardware price pressure?
Suppliers increasingly monetize software subscriptions that deliver predictive maintenance, analytics, and open APIs at USD 15-40 per locker each month.
What ownership model is most attractive to small retailers?
Locker-as-a-service subscriptions priced at USD 200-800 monthly shift capex into operating expense and shorten deployment decision cycles.
How concentrated is vendor competition?
The top five brands command about 58% of global revenue, giving the market a moderate concentration profile.
Page last updated on:


