
Market Overview
| Study Period | 2020 - 2031 |
|---|---|
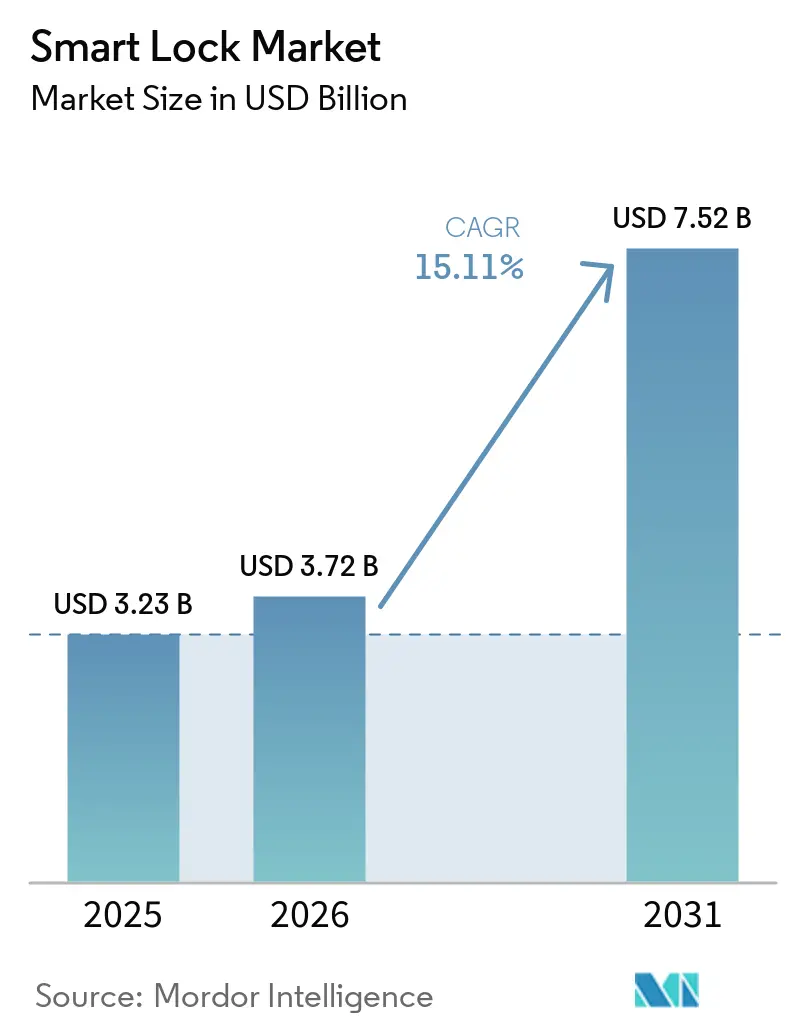
| Market Size (2026) | USD 3.72 Billion |
| Market Size (2031) | USD 7.52 Billion |
| Growth Rate (2026 - 2031) | 15.11 % |
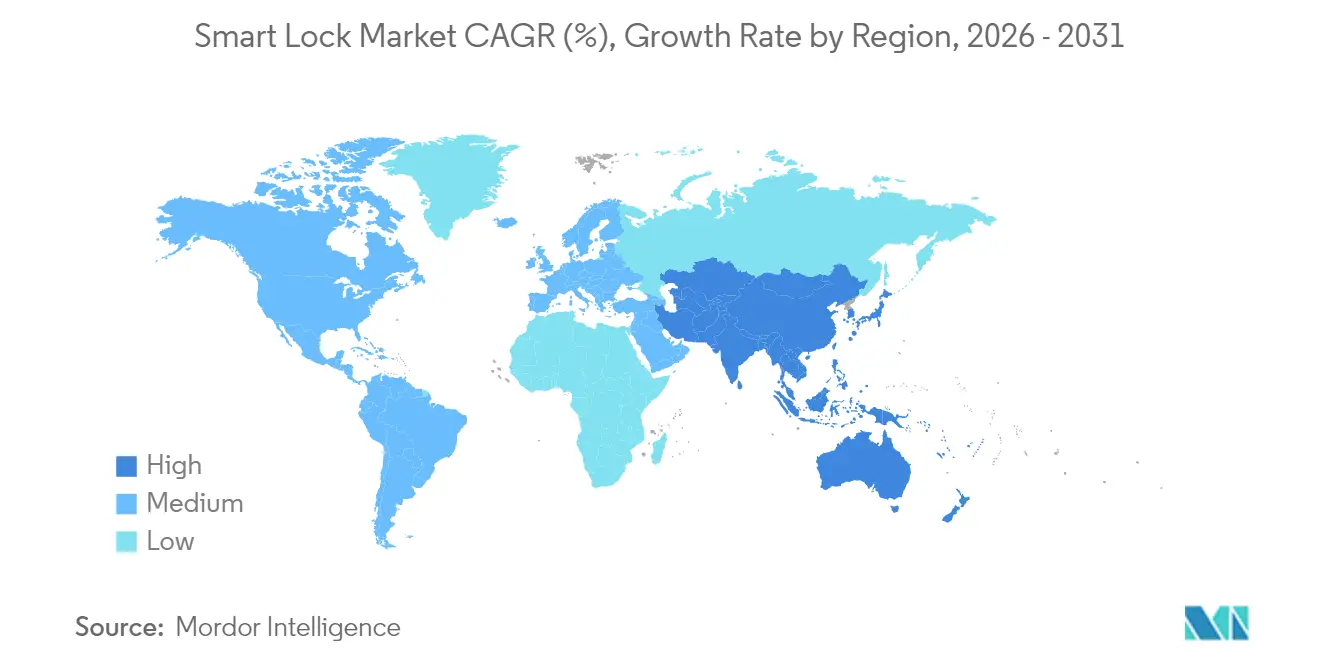
| Fastest Growing Market | Asia Pacific |
| Largest Market | North America |
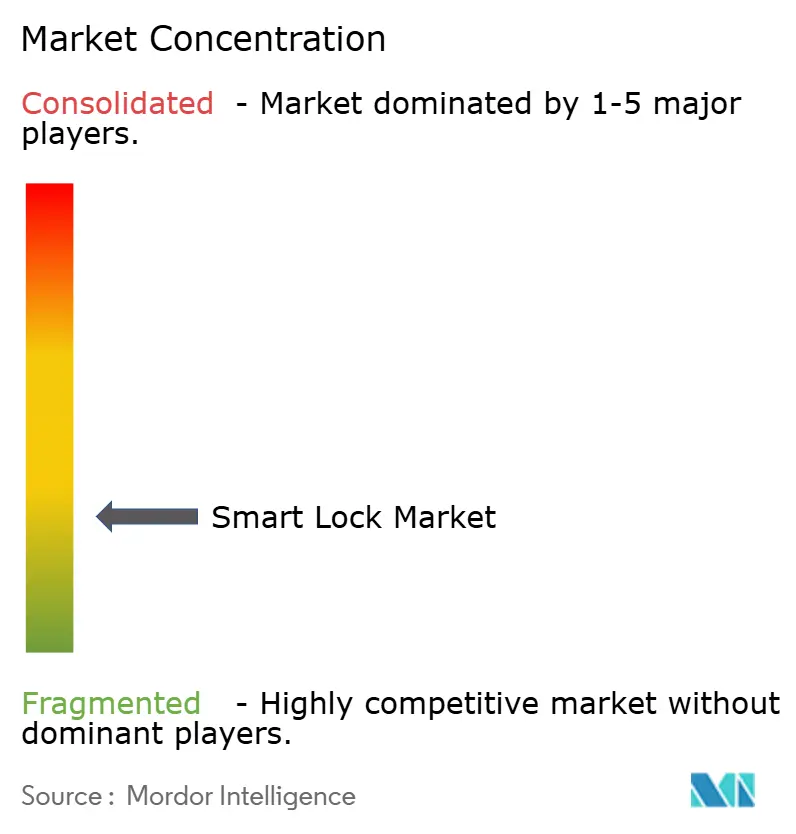
| Market Concentration | Low |
Major Players
*Disclaimer: Major Players sorted in no particular order Image © Mordor Intelligence. Reuse requires attribution under CC BY 4.0. |
|
Smart Lock Market Analysis by Mordor Intelligence
The smart lock market size was valued at USD 3.23 billion in 2025 and estimated to grow from USD 3.72 billion in 2026 to reach USD 7.52 billion by 2031, at a CAGR of 15.11% during the forecast period (2026-2031). The outlook highlights the convergence of maturing smart-home platforms, rising urban security concerns, and expanding IoT connectivity that favors remote door access. Interoperability progress through the Matter and Thread standards now removes many integration barriers, while declining biometric sensor prices are broadening feature sets across both residential and light-commercial models. Price increases linked to semiconductor shortages are a near-term headwind, yet insurance premium discounts and total-cost-of-ownership savings continue to encourage replacement of mechanical locks. Intensifying acquisition activity shows established access-control leaders positioning to secure scale, channel reach, and core technology.
Key Report Takeaways
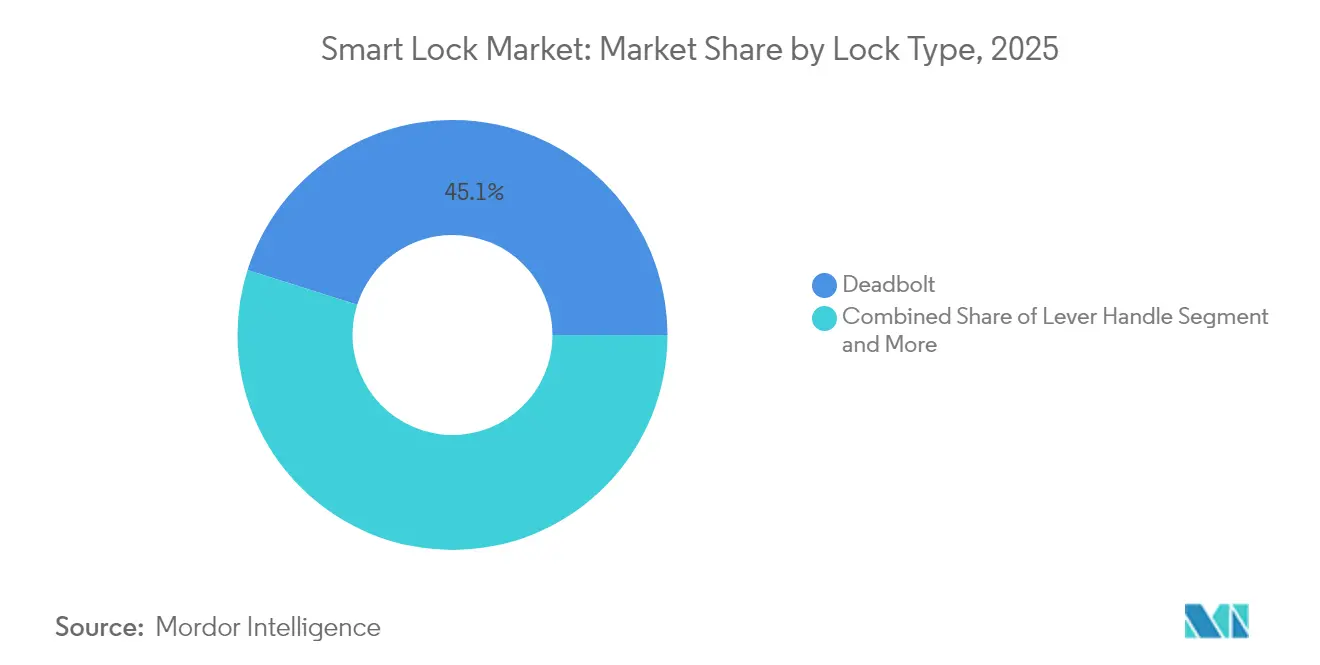
- By lock type, deadbolts led with 45.12% revenue share in 2025; lever handle systems are projected to advance at a 15.18% CAGR to 2031.
- By communication technology, Bluetooth held 61.68% of smart lock market share in 2025, while Zigbee-based solutions are poised to expand at 16.74% CAGR through 2031.
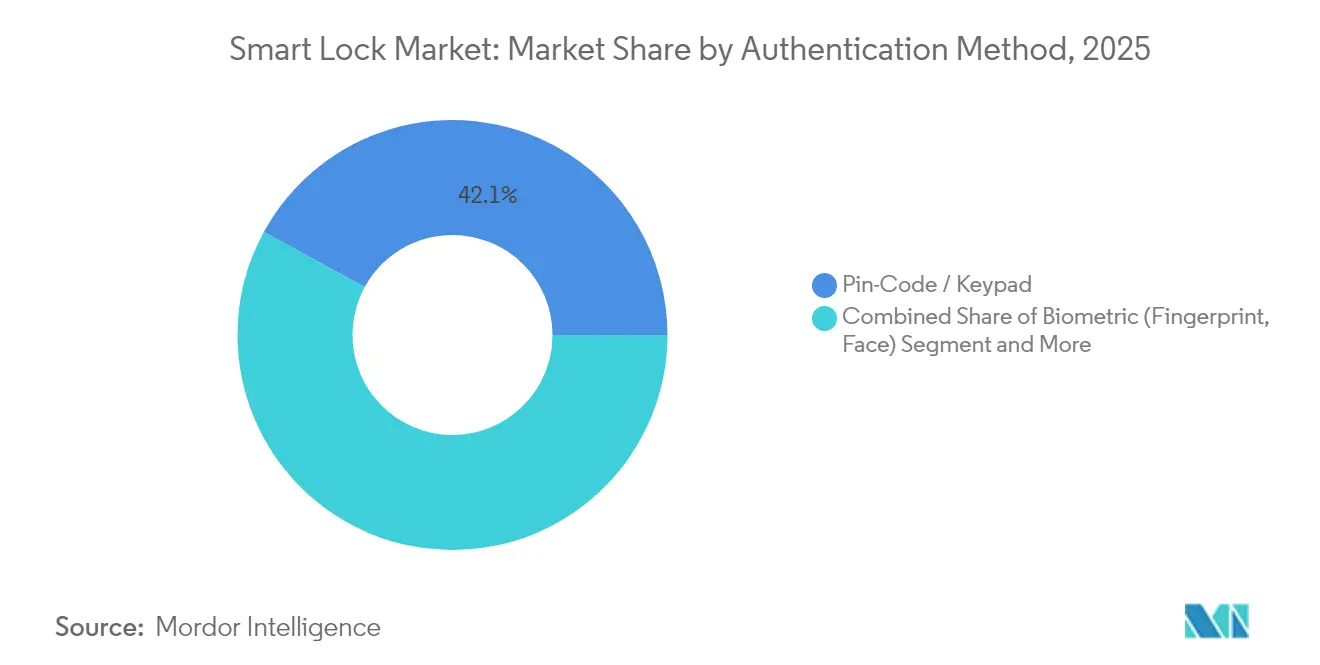
- By authentication method, keypads captured 42.05% of the smart lock market size in 2025; biometrics is set to grow at a 17.11% CAGR between 2026-2031.
- By end-user application, residential installations accounted for 57.20% of revenue in 2025; hospitality and short-term rentals are expected to register the fastest 16.58% CAGR to 2031.
- By geography, North America dominated with 37.05% share in 2025, whereas Asia-Pacific is forecast for a 15.42% CAGR through 2031.
Note: Market size and forecast figures in this report are generated using Mordor Intelligence’s proprietary estimation framework, updated with the latest available data and insights as of 2026.
Market Trends and Insights
Drivers Impact Analysis of Smart Lock Market*
| Driver | (~) % Impact on CAGR Forecast | Geographic Relevance | Impact Timeline |
|---|---|---|---|
| Rapid adoption of smart-home ecosystems | +3.20% | Global, with North America and Europe leading | Medium term (2-4 years) |
| Rising burglary and safety concerns in urban areas | +2.80% | Global, concentrated in urban centers | Short term (≤ 2 years) |
| Smartphone and IoT proliferation enabling remote access | +2.50% | Global, with Asia-Pacific showing highest growth | Long term (≥ 4 years) |
| Building-code push for keyless energy-efficient doors | +1.90% | North America and Europe primarily | Long term (≥ 4 years) |
| Airbnb-style rentals demanding automated guest access | +2.10% | Global, concentrated in tourism hubs | Medium term (2-4 years) |
| Home-insurance premium discounts for connected locks | +1.40% | North America and Europe | Medium term (2-4 years) |
| Source: Mordor Intelligence | |||
Rapid Adoption of Smart-Home Ecosystems
Growing preference for unified device control makes smart lock integration one of the first upgrades in connected homes. Matter-over-Thread launches by Yale, Schlage, and Level are removing vendor lock-in and extending battery life to more than 12 months. Voice assistants already reside in 70% of United States households, which accelerates voice-enabled locking. Scheduled Thread 1.4 adoption by 2026 will let new products join existing networks without additional hubs, further tightening ecosystem stickiness.[1]YaleHome,"Yale Announces New Matter over Thread Deadbolt Lock," yalehome.com
Rising Burglary and Safety Concerns in Urban Areas
Urban crime patterns have raised homeowner vigilance, and data show 83% of burglars survey security setups before entry. Integrating a smart lock with video verification closes the 15-second alarm response gap common in legacy systems. Lockly’s facial recognition engine now flags unauthorized faces in 1.5 seconds, sending real-time alerts that deter opportunistic crime. Multi-factor combinations of biometrics and PINs add layered protection for dense residential high-rises where anonymity often aids break-ins.
Smartphone and IoT Proliferation Enabling Remote Access
Smartphone penetration exceeds 85% in developed markets, delivering the control interface critical to the smart lock market. Rollout of 5G networks minimizes latency for cloud-managed unlocking, while ultra-wideband chips enable proximity-based doors that auto-open for registered users. Digital wallet integration is emerging, letting the same credential verify payments and physical entry. For example, NEC's biometric systems deployed at Expo 2025 in Osaka demonstrate how smart locks can facilitate both access control and cashless payment processing. [2]NEC,"NEC Biometrics: No Cards, No Keys, No Problem," nec.com Matter certification now guarantees interoperability so property owners can mix devices while still using a single mobile app.
Building-Code Push for Keyless Energy-Efficient Doors
Recent building regulations require electronic locks in several large metropolitan projects to track occupancy and automate HVAC and lighting. Studies show smart locks integrated with building systems cut energy use by 15-20%. ADA requirements also favor touch-free entry that assists elderly users, leading to higher adoption in senior housing. LEED scoring has begun awarding credits for connected access control, making smart locks part of sustainability checklists on new builds.
Restraints Impact Analysis of Smart Lock Market*
| Restraint | (~) % Impact on CAGR Forecast | Geographic Relevance | Impact Timeline |
|---|---|---|---|
| Cyber-security and hacking vulnerabilities | -2.10% | Global, with higher impact in security-conscious markets | Short term (≤ 2 years) |
| Up-front device and installation cost premium | -1.80% | Global, with higher impact in price-sensitive markets | Medium term (2-4 years) |
| Battery-life / maintenance anxieties among consumers | -1.20% | Global, particularly in residential applications | Medium term (2-4 years) |
| Inter-protocol interoperability gaps in retrofit projects | -0.90% | North America and Europe primarily | Short term (≤ 2 years) |
| Source: Mordor Intelligence | |||
Cyber-Security and Hacking Vulnerabilities
High-profile breaches have exposed biometric bypasses and cloneable NFC tags in mainstream models. Tests by one consumer association found 85.7% of chip-activated units exhibited at least one critical flaw. Vendors now ship end-to-end encryption and two-factor log-ins, yet fragmented hardware designs make universal patching hard to maintain. Industry groups within the Connectivity Standards Alliance are drafting baseline requirements, but wide variation in implementation keeps cyber-risk elevated.
Up-Front Device and Installation Cost Premium
Smart locks typically retail between USD 200-800, while traditional deadbolts cost USD 50-150. Professional installation of USD 100-200 further raises the barrier. Tariff pass-through and semiconductor shortages have pushed list prices up to 10% higher during 2024-2025. Subscription models such as Centrios’ free tier for five openings hint at new pricing tactics that may soften the impact, yet entry-level households in emerging markets still view the replacement decision as discretionary.[3]Secura, "Security concerns in popular smart home devices," secura.com
*Our forecasts treat driver/restraint impacts as directional, not additive. The impact forecasts reflect baseline growth, mix effects, and variable interactions.
Smart Lock Market Segment Analysis
By Lock Type:
Deadbolts Maintain Familiarity While Lever Handles AccelerateDeadbolts retained 45.12% of 2025 revenue, reflecting widespread homeowner confidence in their physical robustness. This share equates to the largest slice of the smart lock market size for hardware formats. Lever handle systems achieved the leading 15.18% CAGR due to ADA compliance needs in hotels and offices, demonstrating how ease-of-operation appeals to high-traffic settings.
Consumers seeking discreet upgrades have driven interest in retrofit cylinders that hide electronics inside existing housings, exemplified by Level’s invisible mechanism. Padlock-style smart devices service out-door industrial use cases but remain niche because of weather-proofing costs. Continuous miniaturization will likely blur category boundaries, though deadbolts are expected to keep a commanding presence through 2031 in the smart lock market.



By Communication Technology:
Zigbee and Thread Outpace Legacy BluetoothBluetooth held 61.68% share in 2025, translating into the top position within the smart lock market share for connectivity. Its phone-to-lock pairing simplicity favors rental properties where router access is uncertain. Range and mesh limitations, however, make it less suited to multi-unit dwellings.
The Zigbee-Thread stack is projected for a 16.74% CAGR, propelled by Matter certification and Silicon Labs’ ultra-low-power SoCs. Wi-Fi continues in cloud-first deployments that prioritize direct remote control despite battery drain. Emerging ultra-wideband adds hands-free precision but sits within the “Others” bucket until shipping volumes scale. Across protocols, standardization is shrinking fragmentation, a trend that will raise the overall smart lock market adoption curve.
By Authentication Method:
Biometrics Challenge KeypadsKeypads produced the largest 42.05% revenue slice in 2025 and thus dominate the smart lock market size for credentials. Users appreciate code familiarity and backup battery life. Nonetheless, shared codes and manual entry inconvenience check keypad growth.
Biometric units log a 17.11% CAGR as camera, sensor, and AI costs drop. Facial recognition unlocks now complete in under 1.5 seconds at 99.9% accuracy, bringing premium-grade convenience into mid-price models. RFID and NFC cards remain common in offices requiring audit trails, while mobile credential use gains ground where bring-your-own-device policies prevail. Biometric progress is expected to reset user expectations and propel higher-spec differentiation across the smart lock market.
By End-User:
Hospitality Gains MomentumResidential buyers generated 57.20% of 2025 revenue, making homes the anchor of the smart lock market. Builders increasingly bundle connected locks to stand out in competitive housing markets. Parents use temporary codes for service providers, reinforcing convenience value.
Hospitality and short-term rentals will witness the fastest 16.58% CAGR, led by self-check-in mandates that arose during the pandemic. Properties cut staffing costs and improve guest satisfaction by replacing keycards with phone credentials. Commercial offices upgrade to digital door lock systems that integrate visitor logs with desk-booking tools, while industrial facilities prioritize ruggedized enclosures. The broadening scenario expands total addressable demand and sustains double-digit growth in the smart lock market.
Geography Analysis
North America Smart Lock Market
North America secured 37.05% of 2025 revenue due to early smart-home adoption, favorable codes, and insurance discounts of up to 10% for connected security. The United States drives renovation demand as developers view smart locks as standard amenity packages. Canada follows, leveraging similar building norms and broadband penetration.
APAC Smart Lock Market
Asia-Pacific is set for the highest 15.42% CAGR, reflecting rapid urban migration and growing middle-class disposable income. China leads smart-home shipments, while India’s residential automation pipeline shows a 39.79% expansion outlook that positions smart locks near the top of consumer upgrade lists. Japan’s aging demographic attracts contactless door solutions supporting senior independence.
EMEA Smart Lock Market
Europe posts steady progression anchored by energy-efficiency directives and strong privacy oversight. Advanced encryption requirements raise development costs yet promote differentiated offerings that comply with GDPR. The Middle East and Africa, though smaller today, benefit from smart-city investments baked into greenfield real-estate projects, enabling leapfrog adoption paths that raise the future baseline of the smart lock market.

Regulatory Landscape
Smart locks are increasingly covered by regional connected-device security rules that spell out lifecycle obligations, including vulnerability handling and defined software support periods. In the European Union, smart door locks are treated as products with digital elements under the Cyber Resilience Act (Regulation (EU) 2024/2847). Conformity routes are developing through the EN 18031 series, and the CRA becomes fully applicable from 11 December 2027. In the United Kingdom, the Product Security and Telecommunications Infrastructure (Security Requirements for Relevant Connectable Products) Regulations 2023 reinforce baseline security requirements for consumer connectable products, and the Department for Science, Innovation and Technology has an interim review scheduled by 29 October 2026.
Outside Europe, Australia implemented mandatory requirements via the Cyber Security (Security Standards for Smart Devices) Rules 2025 (in force from 4 March 2025), covering areas such as password practices, security issue reporting, and support periods for consumer smart devices. In the United States, the FCC IoT Labeling Program (Cyber Trust Mark) provides a voluntary route aligned to the NIST IR 8425 baseline, with testing via FCC-recognized CyberLABs, and eligibility restricted for products from entities on the FCC Covered List. Alongside regulation, technical standards such as ETSI TS 103 815 (residential smart door locking devices) build on ETSI EN 303 645 by setting more specific requirements around electromechanical functions and credentials, which in turn shapes product design, documentation, and update processes.
Competitive Landscape
The field remains moderately fragmented: the top five suppliers account for roughly one-third of global revenue, leaving room for fast-moving specialists. ASSA ABLOY integrates Yale, August, and HID to address multiple price tiers, while Allegion builds on Schlage’s residential reach and Von Duprin’s commercial roots. Spectrum Brands leverages the Kwikset and Baldwin portfolios, and dormakaba balances hospitality leadership with Swiss engineering credibility.
Acquisition strategies show two patterns. Horizontal moves expand channel breadth, as seen in ASSA ABLOY’s purchase of Level Lock for USD 16 million. Vertical steps secure technology and premium branding: Fortune Brands paid USD 800 million for Yale and August to deepen connected-products scale. Challenger brands Lockly, U-TEC, and Nuki differentiate with fast biometric innovation and early Matter certification. Consumer-electronics giants Samsung and Xiaomi harness existing IoT ecosystems to enter the smart lock market on favorable cost curves, pressuring mid-tier incumbents.
Standards alliances further shape rivalry. Apple, Google, and Samsung introduced the Aliro smartphone credential, which could erode physical key reliance and shift bargaining power toward mobile-OS owners. To stay competitive, legacy firms increasingly bundle cloud platforms and analytics, turning hardware sales into recurring-revenue gateways that stabilize margins in the smart lock market.
Smart Lock Industry Leaders
-
ASSA ABLOY (Yale, August)
-
Allegion plc (Schlage)
-
Spectrum Brands Holdings (Kwikset)
-
dormakaba Group
-
Honeywell International
- *Disclaimer: Major Players sorted in no particular order
Smart Lock Market Companies Covered in this Report
- ASSA ABLOY (Yale, August)
- Allegion plc (Schlage)
- Spectrum Brands Holdings (Kwikset)
- dormakaba Group
- Honeywell International
- SALTO Systems
- U-TEC (ULTRALOQ)
- Lockly
- Master Lock
- Nuki Home Solutions
- Netatmo (Legrand)
- SimpliSafe
- Samsung SDS
- Aqara (Xiaomi)
- Eufy Security (Anker)
- Level Home
- Tedee
- Hanman International
- Panasonic Life Solutions
- Xiaomi Mi Smart Home

Market Opportunities and Future Outlook
Interoperability and mobile-credential standardization create openings for vendors to sell across mixed smart-home ecosystems, moving from app-specific onboarding toward wallet-based credentials. The Connectivity Standards Alliance released Aliro 1.0 in February 2026 as a vendor-agnostic protocol for digital access control using NFC, Bluetooth LE, and UWB, and it aligns with the Matter ecosystem (Matter 1.4 Core Specification published in November 2024). Aliro and Matter Door Lock cluster requirements support vendor-agnostic provisioning and user management, which gives lock makers an incentive to emphasize multi-platform compatibility, while property operators can reduce integration friction when deploying across varied resident devices.
A second opportunity is compliance-led product refresh cycles as cybersecurity expectations become more prescriptive across regions. The EU Cyber Resilience Act adds explicit vulnerability-handling and support-period expectations for products with digital elements, while Australia introduced mandatory smart-device security rules effective 4 March 2025, and the US Cyber Trust Mark program is putting an identifiable security label framework in place. This regulatory and standards pull (ETSI TS 103 815, ETSI EN 303 645, and NIST-aligned baselines) translates into clearer demand for secure update mechanisms, documented support lifecycles, and credential protection approaches, especially for hospitality, multifamily, and light-commercial deployments where remote management and auditability matter.
Recent Industry Developments in Smart Lock Market
- June 2026: Schlage announced the Schlage Sense Pro smart deadbolt using Ultra Wideband and Schlage Converge technology, with availability beginning June 29, 2026. The move brings hands-free, proximity-based access into a mainstream brand portfolio and increases competitive pressure around UWB-enabled unlocking and ecosystem pairing.
- September 2025: Kwikset expanded its connected security lineup with the Kwikset Flex garage door opener and the Halo Select Plus deadbolt. Broadening the portfolio supports cross-sell into adjacent entry points and strengthens bundle positioning for DIY retail and installer channels.
- October 2024: Kwikset revealed two new SmartCode electronic deadbolts, adding options in keypad-led access control. The release reinforces demand for code-based entry in residential retrofits while giving the brand more price and feature coverage within deadbolts, the largest lock-type segment.


Smart Lock Market Report Scope and Research Methodology
Market Definition and Coverage
For this study, the smart lock market covers electronically enabled door and access locks that can be opened, managed, or monitored through digital authentication and connected communication features, and it is measured in value terms in USD across the covered geographies.
Scope exclusions: We exclude broader home security devices and services that are not primarily a lock product (such as cameras, alarms, or monitoring subscriptions).
Segments Covered in This Report
-
By Lock Type
- Deadbolt
- Lever Handle
- Padlock
- Others
-
By Communication Technology
- Bluetooth
- Wi-Fi
- Zigbee
- Others
-
By Authentication Method
- Pin-Code / Keypad
- Biometric (Fingerprint, Face)
- RFID / NFC Card
- Others
-
By End-user
- Residential
- Commercial Offices
- Hospitality and Short-term Rentals
- Industrial and Infrastructure
-
By Geography
-
North America
- United States
- Canada
- Mexico
-
South America
- Brazil
- Argentina
- Rest of South America
-
Europe
- Germany
- United Kingdom
- France
- Italy
- Spain
- Rest of Europe
-
Asia-Pacific
- China
- Japan
- India
- South Korea
- Southeast Asia
- Rest of Asia-Pacific
-
Middle East and Africa
-
Middle East
- Saudi Arabia
- United Arab Emirates
- Turkey
- Rest of Middle East
-
Africa
- South Africa
- Nigeria
- Egypt
- Rest of Africa
-
Middle East
-
North America
Data Sources, Market Sizing, and Validation
Desk Research
Desk research was used to set the market boundary, establish consistent unit economics, and understand where demand is coming from across homes and commercial buildings. We referred to public sources such as U.S. Census housing and construction indicators, Eurostat construction statistics, UN Comtrade trade flows for relevant lock and access control categories, and standards guidance from bodies such as NIST. Where useful, peer reviewed papers and patent databases were reviewed to understand feature shifts such as biometric adoption and protocol choices.
In addition, we used company filings, investor presentations, product specification sheets, and trusted press coverage to track product launches, channel moves, and pricing direction. A paid subscription focused on company financials and news was used selectively to cross-check reported revenue exposure and major regional moves. This list is not exhaustive, and many other public and subscription sources were also used for data collection, validation, and research clarification.
Primary Interviews and Surveys
Primary work focused on validating adoption rates, typical selling prices by lock format, and how mix is shifting across residential and commercial use cases. We spoke with a balanced set of stakeholders, including lock and access hardware participants, channel partners, and institutional buyers, and then used follow-up checks to reconcile gaps seen in secondary numbers across regions and end users.
Distribution of primary research fieldwork respondents
| Company type | Respondent position | Region |
|---|---|---|
| Top tier: 36% | CXOs: 12% | APAC: 41% |
| Mid tier: 44% | Functional/Unit leaders: 39% | EMEA: 35% |
| Smaller Players: 20% | Managers: 49% | Americas: 24% |
Market-Sizing & Forecasting
Sizing starts with a top-down build where housing activity, commercial building additions, and replacement cycles are translated into an addressable demand pool for connected locking solutions, and then refined by penetration assumptions for smart access. To keep it grounded, we corroborated totals using selective bottom-up approximations, such as sampled price points times estimated shipment volumes from channel checks, followed by adjustments where the two views diverged.
Key inputs used in the model include new residential completions and remodel indicators, commercial building activity, smart home device adoption signals that influence attach rates, the split of communication protocols (Wi-Fi, Bluetooth, Zigbee, and related options) that impacts product mix, and the share of biometric versus keypad and card based authentication that typically carries different price levels. Average selling price progression was handled through a mix-based approach, where feature mix and channel mix are updated before price is applied, rather than assuming a flat inflation uplift.
For forecasting, scenario analysis was used because adoption is sensitive to new construction cycles and retrofit appetite, and primary inputs helped anchor realistic penetration curves by region. Where bottom-up inputs were sparse for smaller countries, gaps were handled through proxy ratios tied to construction indicators and smart home adoption, and then rechecked for reasonableness against regional totals.
Data Validation & Update Cycle
Validation is done through multiple checks so the final output does not depend on one data stream. We compare the model outcome against independent signals such as construction activity direction, regional smart home adoption momentum, and observed pricing bands by lock type, and then investigate any large variance before sign-off.
Anomalies trigger a second review pass, and targeted re-contacts are done when an assumption looks unstable, for example when protocol mix or biometric share changes faster than expected. Reports are refreshed annually, and interim updates are made when material events occur that can move pricing or adoption, followed by a final pre-delivery review so clients receive the latest updated view.
Mordor Intelligence's Smart Lock Market Size Measured Against Other Published Estimates
Published smart lock market numbers often do not line up because the timing and mechanics behind the numbers are not always consistent, even when the topic name looks identical. In practice, differences show up from how each study treats price movement, what currency conversion point is used, and whether the market model is refreshed after major product or channel shifts.
For example, some estimates lean heavily on a single base year and then apply a broad growth curve, while others blend smart locks with adjacent digital door hardware categories, which changes the total quickly. By refreshing ASP assumptions using observed mix shifts and aligning locking currency timing to a consistent conversion window, and then rechecking results through follow-up validation calls, the spread narrows in a way that keeps the 2026 total traceable. This is the refresh-led discipline applied by Mordor Intelligence.
Benchmark comparison
| Source | Market Size | Gaps in Research Methodology |
|---|---|---|
| Mordor Intelligence | USD 3.72 B (2026) | |
| Global Consultancy A | USD 3.31 B (2025) | Uses a 2024 base with a 2025 point estimate, and the scope and pricing logic may lean more on a single-year snapshot, which can understate mix-driven ASP lift when biometrics and Wi-Fi models gain share. |
| Industry Publisher B | USD 3.38 B (2025) | Extends forecasts to 2034 with a high-growth curve, and the definition can be broader across lock and channel groupings, which can shift the starting-year value depending on what is counted as a smart lock versus adjacent access hardware. |
The table shows that year choice, scope boundaries, and ASP handling are the main drivers behind the visible spread. When the scope is kept to smart lock products and the price path is updated based on feature and channel mix, the market value becomes easier to reproduce and to track over time, which is what most buyers need for planning.


Key Questions Answered in the Report
What is the current size of the smart lock market?
The smart lock market is valued at USD 3.72 billion in 2026.
How fast will the smart lock market grow through 2031?
Revenue is forecast to expand at a 15.11% CAGR, reaching USD 7.52 billion by 2031.
Why is Asia-Pacific the fastest-growing region?
Rapid urbanization, rising disposable income, and extensive smart-city programs drive a 15.42% CAGR across Asia-Pacific through 2031.
What factor most constrains adoption?
Up-front costs remain the main barrier, as smart locks and installation can be four times the price of mechanical alternatives.
Page last updated on:


 Your data is secure and never sold or shared.



