Automated Cell Counters Market Size and Share
Market Overview
| Study Period | 2019 - 2030 |
|---|---|
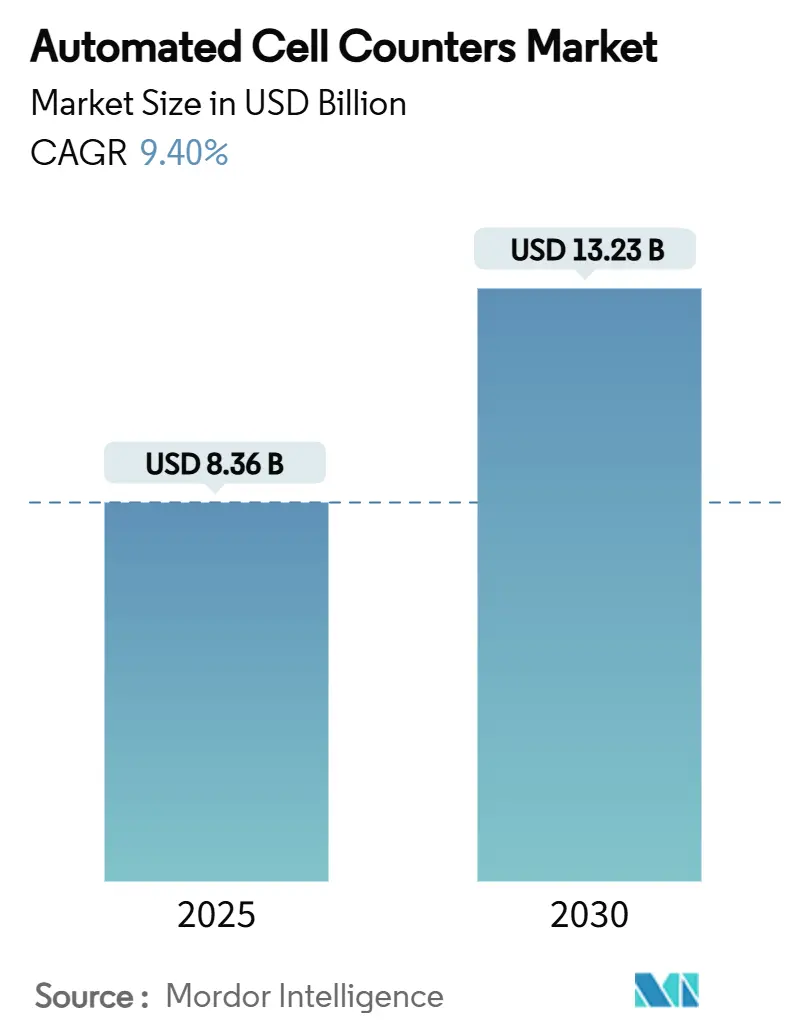
| Market Size (2025) | USD 8.36 Billion |
| Market Size (2030) | USD 13.23 Billion |
| Growth Rate (2025 - 2030) | 9.40% CAGR |
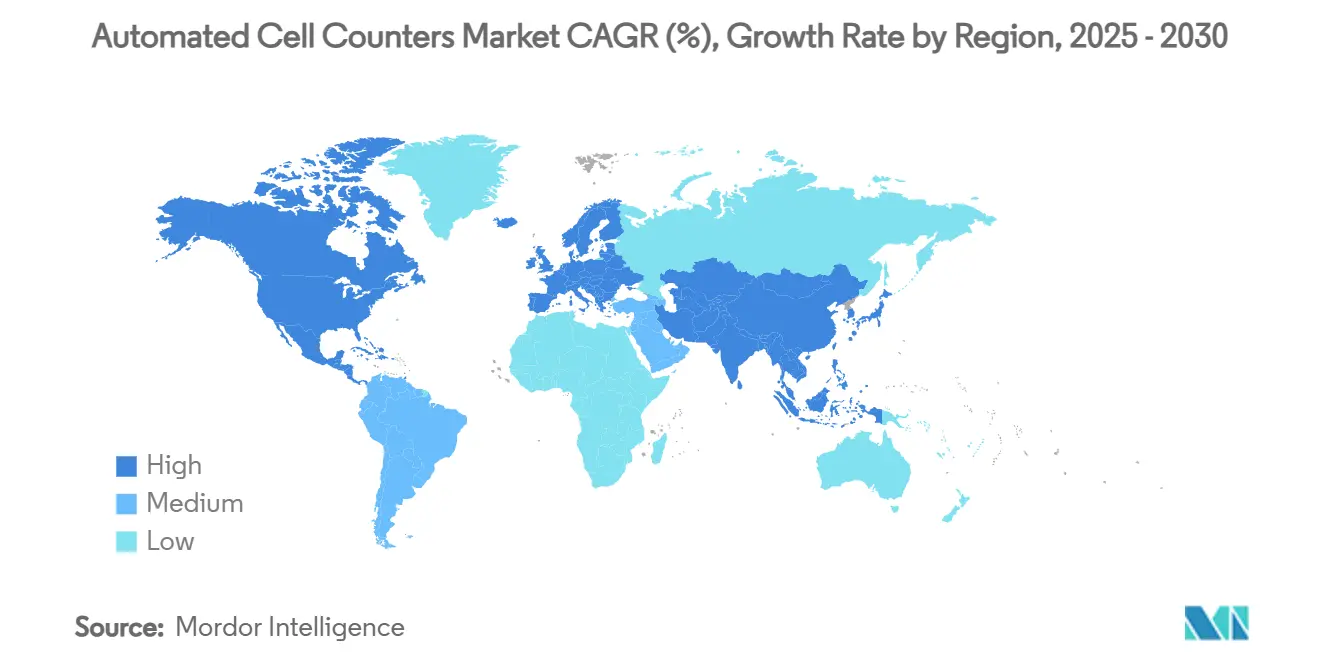
| Fastest Growing Market | Asia Pacific |
| Largest Market | North America |
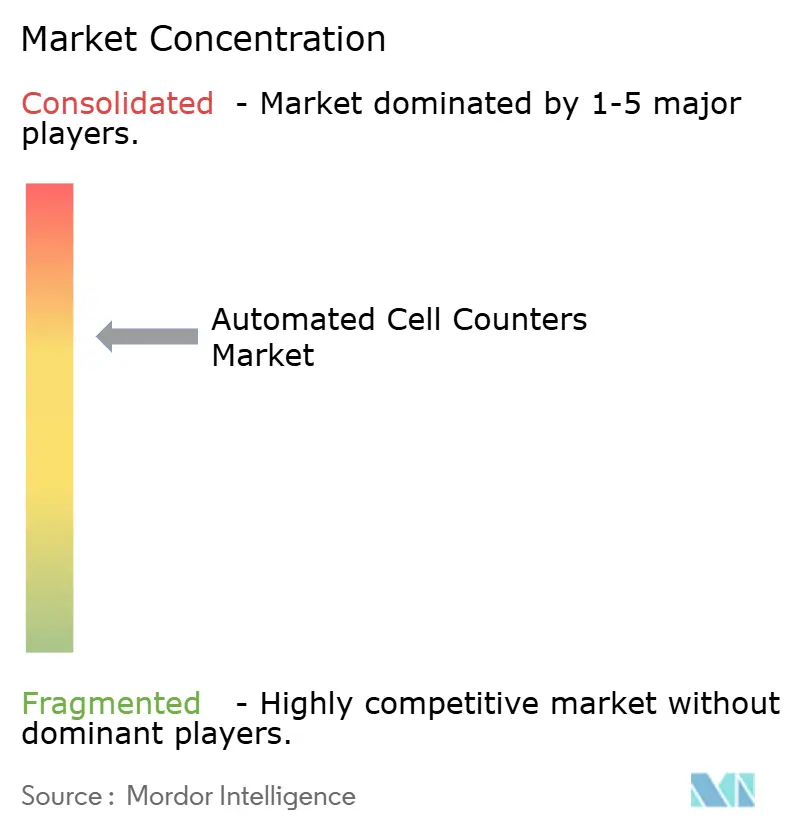
| Market Concentration | Medium |
Major Players *Disclaimer: Major Players sorted in no particular order Image © Mordor Intelligence. Reuse requires attribution under CC BY 4.0. | |
Automated Cell Counters Market Analysis by Mordor Intelligence
The automated cell counters market size reached USD 8.36 billion in 2025 and is forecast to attain USD 13.13 billion by 2030, advancing at a 9.4% CAGR. Demand accelerates as laboratories replace manual methods with AI-enabled, cloud-linked systems that supply real-time analytics and support closed-loop bioprocess control. Growth momentum is strongest in cell therapy and biologics manufacturing, where accurate enumeration safeguards product efficacy and satisfies tightening regulatory scrutiny. Wider uptake also stems from oncology research, expanded research funding, and the shift to subscription service models that lower entry barriers for advanced instruments.
Key Report Takeaways
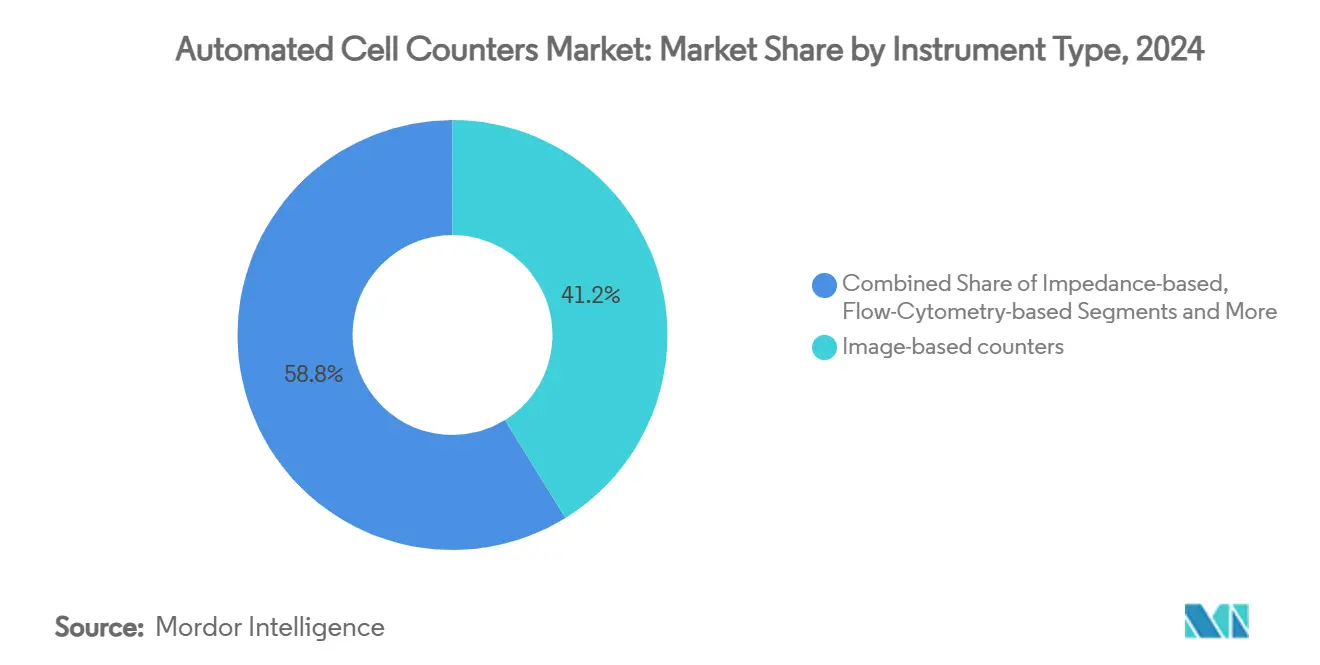
- By instrument type, image-based systems led with 41.2% automated cell counters market share in 2024, whereas fluorescence-based platforms are set to log the fastest 11.8% CAGR to 2030.
- By sample throughput, single-sample benchtop units accounted for 46.5% of the automated cell counters market size in 2024, while on-line bioreactor-integrated counters are projected to expand at a 13.9% CAGR through 2030.
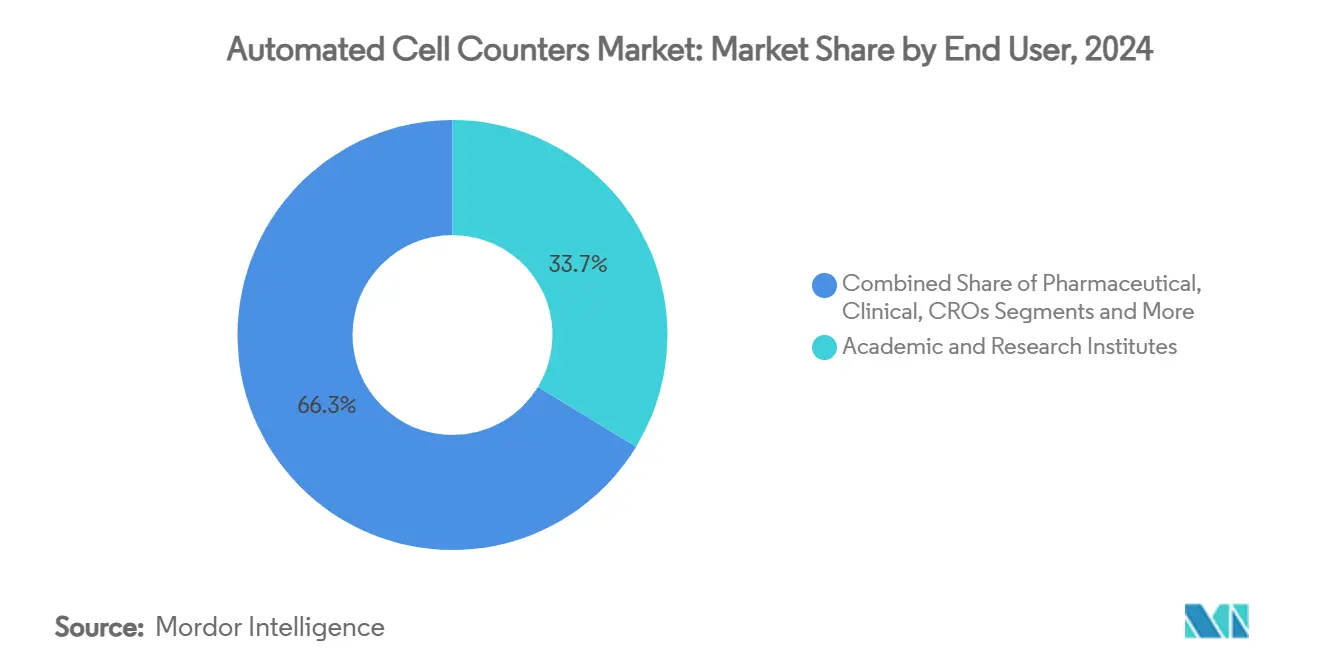
- By end user, academic and research institutes captured 33.7% revenue in 2024, but contract development and manufacturing organizations are poised for the fastest 12.4% CAGR.
- By application, cell viability analysis commanded 28.4% share of the automated cell counters market size in 2024; the stem-cell and regenerative-medicine segment is forecast to accelerate at 14.6% CAGR to 2030.
- By region, North America retained leadership with 40.3% share in 2024, whereas Asia-Pacific is projected to post the highest 9.2% CAGR.
Market Trends and Insights
Drivers Impact Analysis of Automated Cell Counters Market*
| Driver | (~) % Impact on CAGR Forecast | Geographic Relevance | Impact Timeline |
|---|---|---|---|
| Rapid Adoption Of Cell Therapy & Biologics Manufacturing | +2.10% | Global, with concentration in North America & EU | Medium term (2-4 years) |
| Rising Prevalence Of Cancer & Chronic Diseases | +1.80% | Global, strongest impact in APAC and MEA | Long term (≥ 4 years) |
| Expanded Funding For Life-Science Research Facilities | +1.40% | North America & EU core, spillover to APAC | Short term (≤ 2 years) |
| AI-Powered Image Analytics Enabling Real-Time Dashboards | +1.20% | Global, early adoption in developed markets | Medium term (2-4 years) |
| Pay-Per-Use Cloud-Connected Business Models | +0.90% | North America & EU, expanding to APAC | Short term (≤ 2 years) |
| Single-Use Microfluidic Cartridges For Closed-Loop Monitoring | +0.80% | Global, manufacturing hubs in APAC | Medium term (2-4 years) |
| Source: Mordor Intelligence | |||
Rapid Adoption of Cell Therapy & Biologics Manufacturing
Manufacturers scaling allogeneic therapies need continuous, autonomous enumeration to standardize every batch and comply with 21 CFR Part 11 audit trails. Automated counters now integrate directly with perfusion bioreactors, allowing operators to adjust feed rates in real time and avoid cell-density excursions that jeopardize yield. Contract development and manufacturing organizations (CDMOs) have rushed to deploy these systems to relieve capacity constraints that intensified in 2024. The FDA cleared multiple automated CD34+ cell separators in 2024, signaling official confidence in next-generation enumeration technology.[1]U.S. Food and Drug Administration, “2024 Biological Device Application Approvals,” fda.gov Vendors that overlay cloud analytics and predictive maintenance capture service revenue while shrinking downtime across global multi-site manufacturing networks.
Rising Prevalence of Cancer & Chronic Diseases
Cancer incidence rose worldwide in 2024 and 2025, especially in China and India, prompting hospitals to adopt multi-parameter counting platforms that detect circulating tumor cells, immune subsets, and viability markers in a single run. Pairing flow cytometry with automated counters supports faster, more granular immuno-phenotyping, which guides precision oncology regimens.[2]Nature Editorial Team, “A wearable device for continuous monitoring of circulating cells at single-cell resolution,” nature.com As payers push for outcome-based reimbursement, clinicians rely on high-fidelity cell data to tailor therapies and monitor minimal residual disease, reinforcing the value proposition for premium counting solutions.
Expanded Funding for Life-Science Research Facilities
National research budgets in Japan, the United States, and Germany prioritized automated instrumentation in 2024-2025 grant cycles. New multi-institution consortia stipulate harmonized digital workflows, driving orders for platforms that embed secure cloud dashboards, audit trails, and LIMS connectivity. These requirements have pulled forward purchases in universities that historically deferred upgrades, pushing unit volumes upward even before broader commercial adoption.
AI-Powered Image Analytics Enabling Real-Time Dashboards
Deep-learning classifiers embedded in the latest counters discriminate viable cells from debris within 30 seconds, matching flow-cytometry accuracy yet occupying a smaller footprint. Edge-processing chips handle image segmentation locally, mitigating data-privacy worries while still exporting summary analytics to cloud portals that managers track across sites. Early adopters in biopharma report double-digit cuts in batch-failure incidents because real-time alerts prompt rapid corrective actions.
Restraints Impact Analysis of Automated Cell Counters Market*
| Restraint | (~) % Impact on CAGR Forecast | Geographic Relevance | Impact Timeline |
|---|---|---|---|
| High Upfront Cost Of Advanced Counters | -1.60% | Global, most pronounced in emerging markets | Short term (≤ 2 years) |
| Stringent Regulatory Validation For Diagnostic Use | -1.30% | Global, strictest in North America & EU | Medium term (2-4 years) |
| Supply-Chain Shortage Of High-Res CMOS Sensors | -1.10% | Global, manufacturing concentrated in APAC | Short term (≤ 2 years) |
| Data-Security Concerns Over Cloud-Linked Instruments | -0.80% | Global, heightened in regulated industries | Medium term (2-4 years) |
| Source: Mordor Intelligence | |||
High Upfront Cost of Advanced Counters
Premium AI-enabled counters exceed USD 100,000, discouraging cash-strapped labs in Latin America and Southeast Asia. Semiconductor shortages lifted component prices throughout 2024, inflating final system costs further. Vendors responded with modular designs that allow labs to add fluorescence or high-throughput plates later, staggering expenditure but preserving an upgrade path.
Stringent Regulatory Validation for Diagnostic Use
The May 2025 Laboratory Developed Test final rule forces clinical labs to perform extensive accuracy, precision, and cybersecurity demonstrations before deploying counting devices. Smaller facilities lacking compliance staff may exit the market or merge with larger chains, limiting addressable unit sales in the near term.
*Our forecasts treat driver/restraint impacts as directional, not additive. The impact forecasts reflect baseline growth, mix effects, and variable interactions.
Automated Cell Counters Market Segment Analysis
By Instrument Type:
Image-Based Platforms Retain the Lead, Fluorescence Gains MomentumImage-based counters contributed 41.2% to the automated cell counters market in 2024, thanks to their capacity to pair enumeration with morphological assessment in a single scan. These instruments attract academic and biotech users who value simultaneous readouts of viability, confluence, and differentiation markers. Impedance systems remain staples for high-throughput blood testing where speed trumps multi-parameter analytics, while flow-cytometry-based units serve niche immunology protocols requiring rare-cell detection. Emerging hybrid platforms amalgamate imaging, impedance, and fluorescence modules, creating a one-stop analytical hub that preserves bench space and reduces training burdens. Vendors embed AI engines that self-tune, focus, and reject debris, shrinking analyst intervention time and lifting reproducibility. Fluorescence-based counters, projected to clock an 11.8% CAGR, benefit from soaring demand for viability and phenotyping checks in cell-therapy production suites, where regulators insist on lineage-specific staining to validate product identity.
Second-generation image analysers now interface wirelessly with electronic batch-record systems, injecting real-time results directly into quality-by-design workflows. That shift positions the automated cell counters industry to become a critical node in fully digital manufacturing chains. As micro-lensing and CMOS sensor innovations cascade into lower price tiers, entry-level models close performance gaps with flagship lines, widening the accessible customer base without cannibalising premium margins. The automated cell counters market size for image-based platforms is poised to deepen its revenue contribution as users demand richer analytics per sample processed.


By Sample Throughput Capacity:
Benchtop Units Dominate, Online Bioreactor Counters SurgeBenchtop single-sample devices held 46.5% of the automated cell counters market share in 2024, preferred for routine assays across university cores and hospital labs. Their compact design, intuitive interfaces, and affordable consumables underpin their entrenched popularity. High-throughput plate readers, configured for 24—to 384-well formats, anchor drug-screening pipelines where parallel processing justifies higher capital spend. Portable counters address point-of-care field diagnostics but still face precision trade-offs limiting wider deployment.
Online bioreactor-integrated counters, forecast to rise at 13.9% CAGR, epitomize the shift toward lights-out manufacturing. Mounted inline, these sensors continuously relay viable-cell-density data, triggering automated nutrient feeds or gas-exchange tweaks that stabilize culture growth. The automated cell counters market size for inline units should expand further as allogeneic therapy makers scale up production runs serving multiple patients per batch. Vendors now supply retrofit kits that attach to legacy stainless-steel and single-use bioreactors, broadening the installed base without demanding full system replacements. As processing plants chase real-time release testing, inline counting will likely become a regulatory expectation rather than a discretionary enhancement.[3]Wiley Online Library, “Advances in automated real-time flow cytometry for monitoring of bioreactor processes,” wiley.com
By End User:
Academia Leads, CDMOs Grow FastestAcademic and research institutes generated 33.7% revenue in 2024, leveraging grants that mandate digital recordkeeping and reproducible workflows. Investigators cite lower inter-operator variability and faster turnaround times as key benefits that free personnel to focus on experimental design instead of routine counting. Pharmaceutical and biotech firms deploy top-tier counters to de-risk pipeline assets by ensuring early-stage assays align with cGMP criteria, smoothing downstream tech-transfer. Clinical labs demand FDA-cleared models with locked software versions and audit trails, supporting insurance billing and pathology reporting.
CDMOs, projected to register 12.4% CAGR, purchase multi-unit fleets to satisfy surging outsourcing contracts for cell- and gene-therapy clients. The automated cell counters market supports their need to guarantee consistent product-release metrics across global sites and to demonstrate compliance during sponsor audits. Vendors that bundle 24/7 remote diagnostics and on-site validation services gain preference as CDMOs prioritize uptime and rapid regulatory submissions.
By Application:
Viability Testing Leads, Stem-Cell Workflows AccelerateCell viability and proliferation assays represented 28.4% of the automated cell counters market in 2024, reflecting their universal role in routine culture maintenance and preclinical research. Blood-cell analysis remains entrenched in hematology labs, which require swift complete blood counts to guide transfusions and chemotherapy dosing. Cancer and immunology research harness multi-parameter counters to track immune-cell activation, apoptosis, and cytotoxicity within micro-tumor models, enriching translational insights.
Stem-cell and regenerative-medicine workflows are set to grow 14.6% annually, spurred by an expanding pipeline of mesenchymal and induced-pluripotent therapies nearing commercial launch. Automated systems now quantify colony-forming units and flag differentiation aberrancies, streamlining lot release and shortening fail-fast feedback loops. The automated cell counters market size for this segment will scale as regulatory agencies intensify expectations for quantitative potency and identity assays in advanced-therapy medicinal products.
Geography Analysis
North America Automated Cell Counters Market
North America dominated the automated cell counters market with 40.3% revenue in 2024, buoyed by dense biotech clusters, generous NIH funding, and early adoption of cloud-connected instruments. Laboratories benefit from mature data-privacy regulations that define pathways for remote analytics, accelerating procurement of subscription-based platforms. The United States also hosts a disproportionate share of CDMOs and cell-therapy start-ups, generating predictable demand for high-throughput enumeration and GMP-validated software.
Germany and United Kingdom Automated Cell Counters Market
Europe follows, underpinned by academic strongholds in Germany and the United Kingdom. The European Medicines Agency’s expedited pathways for advanced therapies encouraged facilities to modernize counting workflows in 2024-2025, although fragmented reimbursement regimes slow uniform penetration. Germany’s public-private Cell-Gentherapie initiative earmarked grants for automated QC hardware, signaling ongoing upgrades.
APAC Automated Cell Counters Market
Asia-Pacific is forecast to register the highest 9.2% CAGR, driven by aggressive capacity expansions in China, Japan, and South Korea. Beijing’s tax incentives for biomanufacturing sparked ground-up construction of single-use facilities that install inline counters from day one. Japan’s biotechnology market, projected to reach 15 trillion yen (USD 103 billion) by 2030, is similarly equipping new translational hubs with AI-enabled image analyzers. India’s state governments have funded shared biotech incubators that provide pay-per-use access to advanced instruments, broadening exposure among early-stage firms. Southeast Asian nations such as Singapore are piloting micro-factory concepts where mobile counting stations support multi-tenant GMP suites.
LATAM and MEA Automated Cell Counters Market
Latin America and the Middle East & Africa trail in adoption due to capital constraints and limited service networks, yet rising cancer incidence is nudging regional distributors to stock mid-tier models. Government labs in Brazil and Saudi Arabia began pilot programs in 2024 to validate low-cost fluorescence counters for blood banks, signaling future procurement cycles that could narrow the technology gap.

Competitive Landscape
The automated cell counters market is moderately consolidated. Thermo Fisher Scientific, Danaher Corporation, and Sysmex Corporation pivoted to end-to-end ecosystems that intertwine hardware, reagents, software, and compliance services. These incumbents embed cloud dashboards that unify multi-site fleets, selling uptime guarantees and analytics subscriptions that generate predictable annuity streams. Smaller challengers find it difficult to match such breadth, steering them towards niche segments like field-portable analyzers or wearable cell-tracking patches.
Artificial intelligence is the most visible battlefield. Thermo Fisher’s Countess 3 introduced auto-focusing and debris rejection algorithms, while Beckman Coulter’s partnership with Rarity Bioscience integrated superRCA mutation assays directly into flow-cytometry routines, collapsing workflow steps. BD collaborated with Biosero in January 2025 to robot-integrate plate handling, eliminating manual transfers and lengthening unattended run times.
White-space opportunities persist. Start-ups exploit microfluidics to deliver disposable cartridges tailored to CAR-T manufacturing, and software-only firms offer vendor-agnostic image-analysis plugins that overlay predictive maintenance across legacy fleets. Midsize Asian suppliers leverage proximity to CMOS foundries to undercut on optics cost while still meeting CE-IVDR marks. As service contracts eclipse standalone hardware sales, brand trust and cybersecurity certifications become as decisive as optical resolution or throughput metrics.
Anticipated mergers may further re-shape the field. Thermo Fisher’s USD 4.1 billion purchase of Solventum’s purification unit in February 2025 signalled intent to weld upstream and downstream bioprocess steps into a unified offering. Market observers expect additional bolt-ons that deepen vertical integration and cement ecosystem lock-in.
Automated Cell Counters Industry Leaders
Thermo Fisher Scientific Inc.
Danaher (Beckman Coulter Life Sciences)
Sysmex Corporation
Sartorius (Nexcelom Bioscience)
Chemometec A/S
- *Disclaimer: Major Players sorted in no particular order
Automated Cell Counters Market Companies Covered in this Report
- Thermo Fisher Scientific
- Danaher Corp. (Beckman Coulter Life Sciences)
- Sysmex
- Sartorius AG (Nexcelom Bioscience)
- Chemometec A/S
- Bio-Rad Laboratories
- Agilent Technologies
- Merck KGaA (MilliporeSigma)
- DeNovix
- Logos Biosystems Inc.
- Olympus
- Abbott Laboratories
- Orflo Technologies
- NanoEntek Corp.
- Advanced Instrumentations
- Alifax S.r.l.
- Sony Biotechnology
- Countstar Inc.
- RWD Life Science Co., Ltd.
- Sysmex Partec GmbH

Recent Industry Developments in Automated Cell Counters Market
- July 2025: Sartorius launched the iQue 5 high-throughput screening cytometer with 27 channels and 24-hour continuous operation to support 96- and 384-well workflows.
- May 2025: Sartorius introduced the Octet R8e biolayer interferometry system for real-time, label-free interaction analysis using 96- and 384-well plates.
- March 2025: Beckman Coulter Life Sciences partnered with Rarity Bioscience to integrate superRCA assays into flow-cytometry platforms for residual-disease research.
- January 2025: BD and Biosero announced a collaboration to robot-integrate flow cytometers, automating analysis across multi-well plates.


Global Automated Cell Counters Market Report Scope
Segmentation Overview
| Image-based Automated Cell Counters |
| Impedance-based (Coulter Principle) Counters |
| Flow-Cytometry-based Cell Counters |
| Fluorescence-based Automated Counters |
| Hybrid Multi-Technology Counters |
| Single-Sample Benchtop Counters |
| 24-96-Well Plate High-Throughput Counters |
| Portable/Handheld Counters |
| On-line Bioreactor-Integrated Counters |
| Fully-Automated Workstation-Integrated Counters |
| Academic & Research Institutes |
| Pharmaceutical & Biotechnology Companies |
| Clinical & Diagnostic Laboratories |
| Contract Research & Manufacturing Organizations |
| Industrial & Environmental Testing Labs |
| Cell Viability & Proliferation |
| Blood Cell Analysis & Hematology |
| Stem Cell & Regenerative Medicine |
| Cancer & Immunology Research |
| Bioprocess Monitoring & Cell-Therapy Manufacturing |
| North America | United States |
| Canada | |
| Mexico | |
| Europe | Germany |
| United Kingdom | |
| France | |
| Italy | |
| Spain | |
| Rest of Europe | |
| Asia Pacific | China |
| Japan | |
| India | |
| South Korea | |
| Australia | |
| Rest of Asia Pacific | |
| Middle East & Africa | GCC |
| South Africa | |
| Rest of Middle East & Africa | |
| South America | Brazil |
| Argentina | |
| Rest of South America |
| By Instrument Type | Image-based Automated Cell Counters | |
| Impedance-based (Coulter Principle) Counters | ||
| Flow-Cytometry-based Cell Counters | ||
| Fluorescence-based Automated Counters | ||
| Hybrid Multi-Technology Counters | ||
| By Sample Throughput Capacity | Single-Sample Benchtop Counters | |
| 24-96-Well Plate High-Throughput Counters | ||
| Portable/Handheld Counters | ||
| On-line Bioreactor-Integrated Counters | ||
| Fully-Automated Workstation-Integrated Counters | ||
| By End User | Academic & Research Institutes | |
| Pharmaceutical & Biotechnology Companies | ||
| Clinical & Diagnostic Laboratories | ||
| Contract Research & Manufacturing Organizations | ||
| Industrial & Environmental Testing Labs | ||
| By Application | Cell Viability & Proliferation | |
| Blood Cell Analysis & Hematology | ||
| Stem Cell & Regenerative Medicine | ||
| Cancer & Immunology Research | ||
| Bioprocess Monitoring & Cell-Therapy Manufacturing | ||
| By Geography | North America | United States |
| Canada | ||
| Mexico | ||
| Europe | Germany | |
| United Kingdom | ||
| France | ||
| Italy | ||
| Spain | ||
| Rest of Europe | ||
| Asia Pacific | China | |
| Japan | ||
| India | ||
| South Korea | ||
| Australia | ||
| Rest of Asia Pacific | ||
| Middle East & Africa | GCC | |
| South Africa | ||
| Rest of Middle East & Africa | ||
| South America | Brazil | |
| Argentina | ||
| Rest of South America | ||


Key Questions Answered in the Report
What is the current size of the automated cell counters market?
The automated cell counters market size stood at USD 8.36 billion in 2025 and is projected to reach USD 13.13 billion by 2030.
Which instrument type holds the largest share?
Image-based counters led with 41.2% market share in 2024 because they combine enumeration with morphological insights.
Which end-user category is growing fastest?
Contract development and manufacturing organizations are forecast to grow at 12.4% CAGR through 2030 as cell-therapy outsourcing rises.
Why is Asia-Pacific the fastest-growing region?
Rapid biomanufacturing build-outs in China, Japan, and South Korea, coupled with expanding research investments, drive a 9.2% CAGR in the region.
How are subscription models influencing adoption?
Pay-per-use cloud-connected packages lower upfront costs, making advanced counters accessible to smaller labs while ensuring vendors earn recurring revenue.
What regulatory trends affect the market?
The FDAs Laboratory Developed Test rule effective May 2025 increases validation requirements, raising compliance costs but enhancing data reliability for diagnostic applications.
Page last updated on:


