Asia Pacific Single Cell Analysis Market Size and Share
Market Overview
| Study Period | 2020 - 2031 |
|---|---|
| Forecast Data Period | 2026 - 2031 |
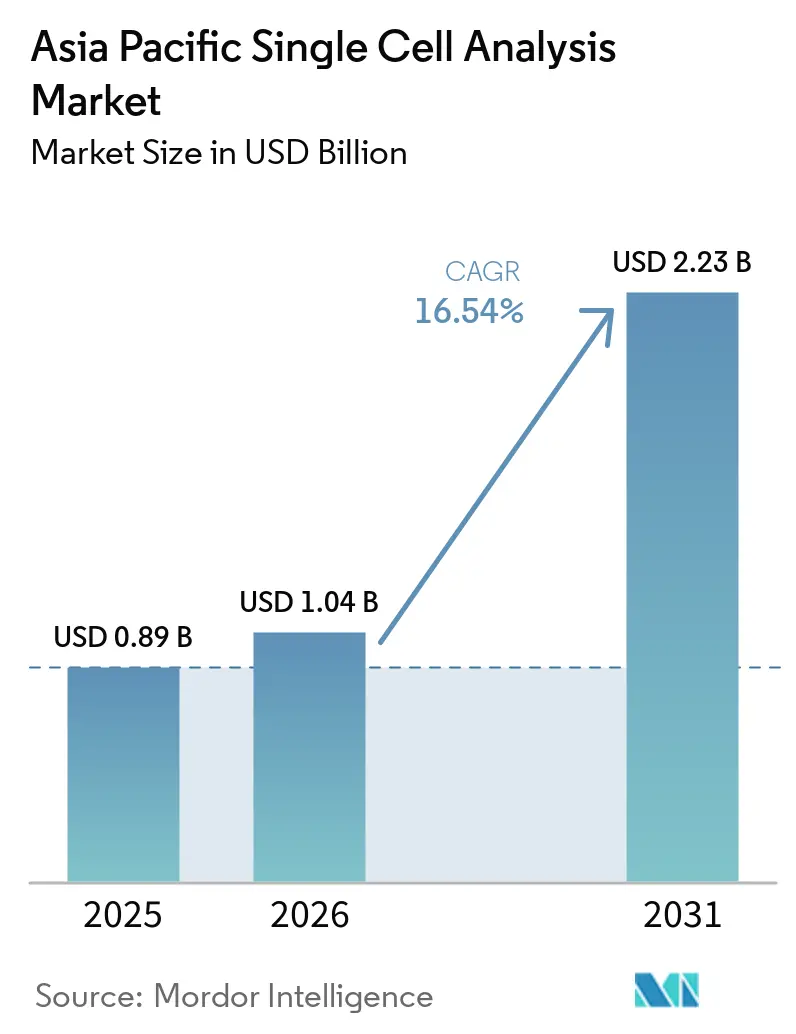
| Base Year Market Size (2025) | USD 0.89 Billion |
| Market Size (2026) | USD 1.04 Billion |
| Market Size (2031) | USD 2.23 Billion |
| Growth Rate (2026 - 2031) | 16.54% CAGR |
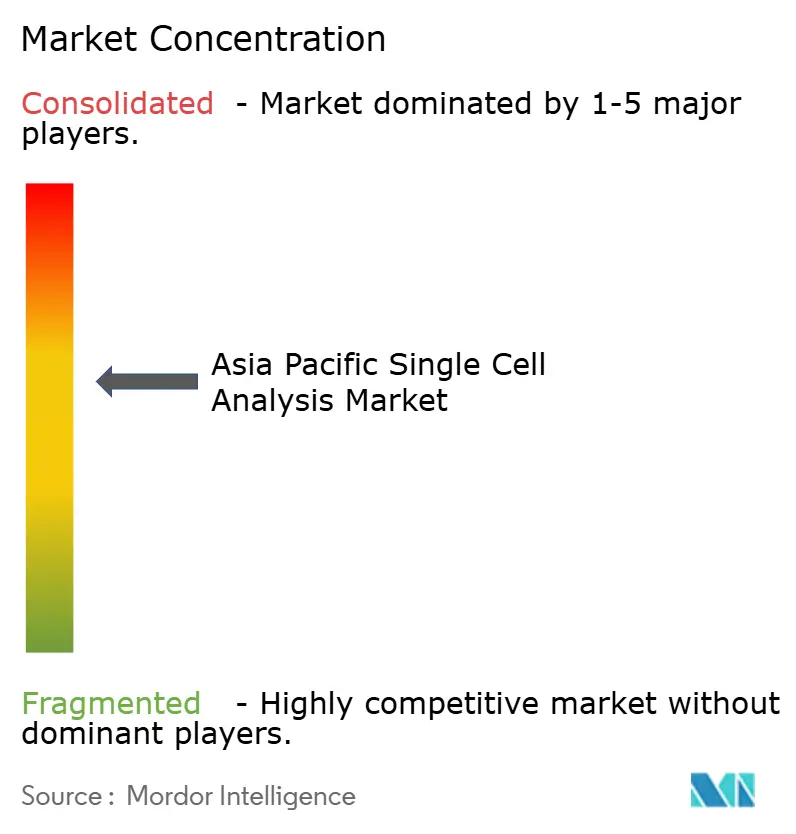
| Market Concentration | Medium |
Major Players *Disclaimer: Major Players sorted in no particular order Image © Mordor Intelligence. Reuse requires attribution under CC BY 4.0. | |
Asia Pacific Single Cell Analysis Market Analysis by Mordor Intelligence
Asia Pacific single cell analysis market size in 2026 is estimated at USD 1.04 billion, growing from 2025 value of USD 0.89 billion with 2031 projections showing USD 2.23 billion, growing at 16.54% CAGR over 2026-2031. The expansion is being propelled by strong government funding for precision medicine, large-scale genomics programs, and rapid technology upgrades that cut per-cell costs. Reagents and consumables retain spending leadership because every experiment requires fresh kits, while newly launched high-parameter instruments are widening analytical scope and drawing fresh capital allocations. Oncology studies account for the bulk of demand as researchers tackle tumor heterogeneity, but neurology projects are scaling quickly with an aging regional population. China’s industrial capacity and national projects keep it at the revenue apex, yet India’s policy push and startup ecosystem make it the fastest mover within the single cell analysis market.
Key Report Takeaways
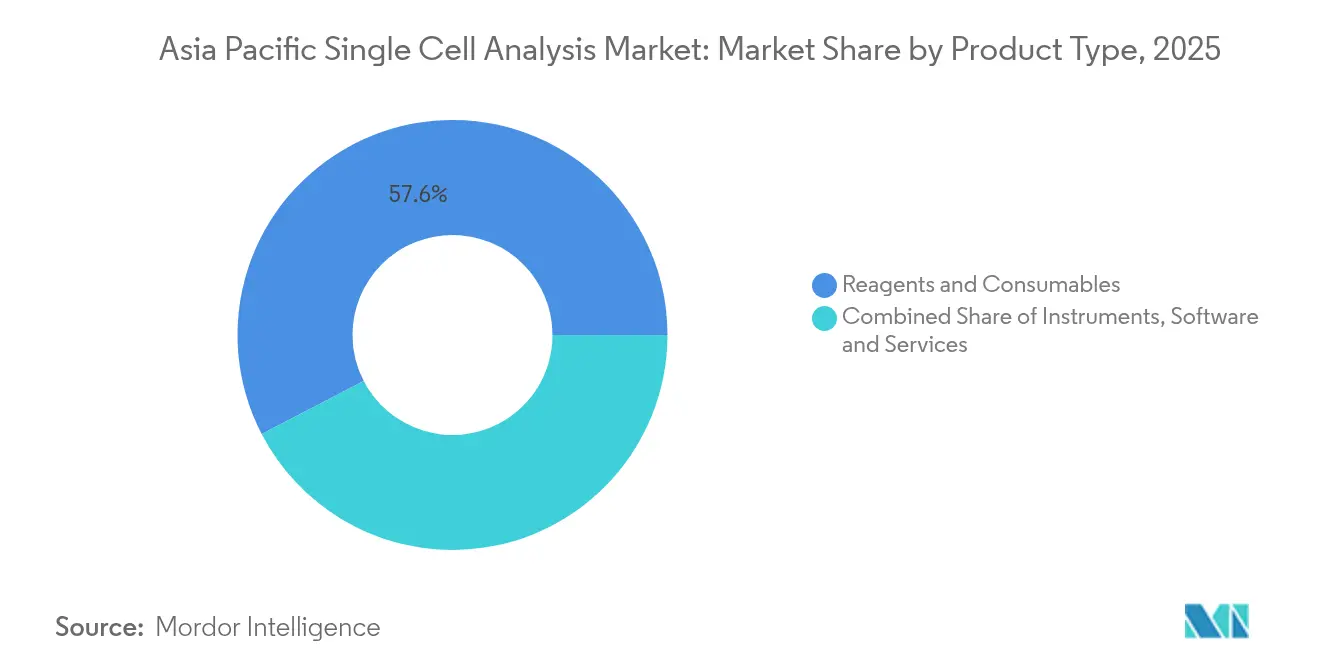
- By product type, reagents and consumables led with 57.62% revenue share in 2025; instruments are projected to expand at a 17.08% CAGR through 2031.
- By technique, flow cytometry held 34.12% of the single cell analysis market share in 2025, while next-generation sequencing is growing at 16.89% CAGR to 2031.
- By disease area, oncology commanded 51.63% share of the single cell analysis market size in 2025; neurology is forecast to rise at a 17.14% CAGR.
- By workflow stage, single-cell isolation and preparation accounted for 45.92% share in 2025; data analysis and interpretation shows the highest 17.31% CAGR outlook.
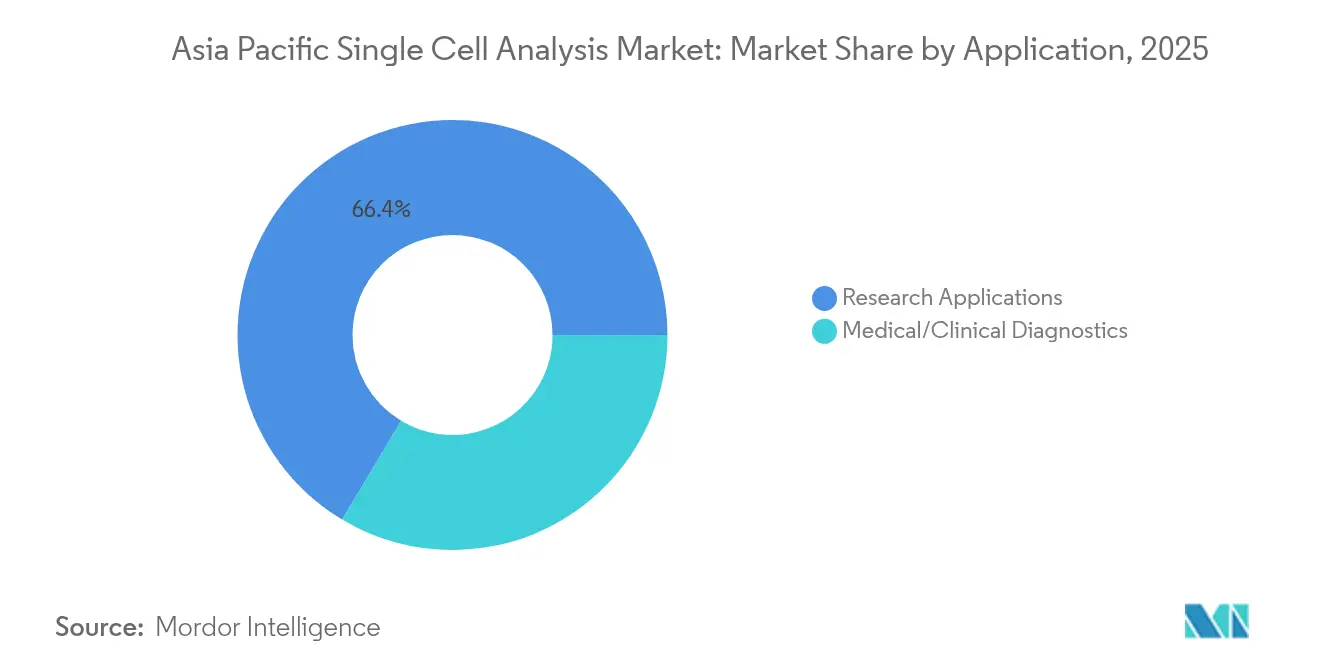
- By application, research activities captured 66.42% of the market in 2025; clinical diagnostics is advancing at an 17.76% CAGR.
- By end user, academic and research laboratories held 46.21% share in 2025, whereas biotechnology and pharmaceutical companies exhibit a 17.19% CAGR trajectory.
- By geography, China dominated with 37.82% revenue share in 2025; India is expanding fastest at 18.02% CAGR.
Note: Market size and forecast figures in this report are generated using Mordor Intelligence’s proprietary estimation framework, updated with the latest available data and insights as of 2026.
Worldwide, activity is shaped by contributions from multiple regions, with Asia representing one of the more structurally developed among them. The global report on single cell analysis market by Mordor Intelligence reflects how these regional layers combine into a single system.
Asia Pacific Single Cell Analysis Market Trends and Insights
Driver Impact Analysis*
| Driver | ( ~ ) % Impact on CAGR Forecast | Geographic Relevance | Impact Timeline |
|---|---|---|---|
| Technological advancements in single-cell analysis products | +3.2% | Global, led by Asia Pacific | Medium term (2-4 years) |
| Increasing investments in cancer research | +2.8% | China, Japan, India core markets | Long term (≥ 4 years) |
| Rising prevalence of chronic diseases | +2.1% | Region-wide, aging focus | Long term (≥ 4 years) |
| Growing adoption of spatial transcriptomics integrations | +2.5% | China, Japan, Australia early adopters | Medium term (2-4 years) |
| Government-backed cell & gene-therapy manufacturing hubs | +1.9% | China, India, Singapore | Medium term (2-4 years) |
| Academic-industry microfluidic collaborations cut cost per cell | +1.4% | Japan, South Korea, Australia | Short term (≤ 2 years) |
| Source: Mordor Intelligence | |||
Technological advancements in single-cell analysis products
Rice University engineers created a gravity-driven microfluidic chip that removes pump hardware yet still counts CD4+ T cells accurately, showing how engineering tweaks lower capital thresholds for emerging labs [1]Rice University News Staff, “Gravity-Driven Microfluidic Cytometer,” Rice University News, rice.edu. BD’s CellView Image Technology now sorts by visual features, unlocking richer phenotypes that traditional fluorescence could miss. China’s Institute of Automation introduced FlowRACS 3.0, using deterministic lateral displacement to condense microbial strain screening from months to days. 10x Genomics’ GEM-X Flex chemistry aims for one-cent per-cell reagent costs, signalling a decisive shift toward mass-scale affordability. Together these upgrades position the single cell analysis market for accelerated platform turnover and broader laboratory reach.
Increasing investments in cancer research
Illumina is bankrolling the Garvan Institute’s TenK10K study, mapping 50 million human cells to uncover cancer-linked genomic fingerprints [2]Garvan Communications Team, “TenK10K Cell Atlas Initiative,” Garvan Institute of Medical Research, garvan.org.au. South Korea’s K-MASTER network screened 994 metastatic colorectal cancer cases and found 52.8% actionable mutations, underscoring direct clinical utility. Korean scientists applied single-cell RNA sequencing to chemotherapy-resistant bladder cancer and isolated resistance pathways now under therapeutic review. Spatial genomics and transcriptomics is connecting tumor micro-environment features with relapse risk, amplifying demand for integrated platforms in the single cell analysis market.
Rising prevalence of chronic diseases
Japan’s 100,000-genome initiative is steering precision drug discovery for age-driven disorders. Spatial techniques help decode cellular dialogues in rheumatoid arthritis and lupus, exposing targets unseen in bulk studies. China’s lysosomal screening of 22,687 newborns shows how single-cell readouts feed early diagnostics to curb disease before onset. Cardiovascular programs now parse patient-specific cardiac cell responses, reinforcing the technology’s cross-disease relevance.
Growing adoption of spatial transcriptomics integrations
BGI’s Stereo-seq photographs entire organs at nanoscale, capturing every cell across a 13 cm x 13 cm canvas. Illumina plans million-cell spatial kits for 2026 commercial launch, broadening statistical power for rare-cell hunts [3]Illumina Editorial Team, “Next-Generation Spatial Transcriptomics Roadmap,” Illumina Inc., illumina.com. A gastric cancer spatial study traced evolution paths tied to outcomes, showcasing how tissue-context data drives prognostic insight. Takara Bio bought Curio Bioscience to add Trekker and Seeker spatial tools, illustrating consolidation momentum.
Restraint Impact Analysis*
| Restraint | ( ~ ) % Impact on CAGR Forecast | Geographic Relevance | Impact Timeline |
|---|---|---|---|
| High cost of single-cell analysis instruments | -2.1% | Region-wide, emerging markets hit hardest | Short term (≤ 2 years) |
| Limited computational & bioinformatics expertise | -1.8% | India, Southeast Asia | Medium term (2-4 years) |
| Regulatory uncertainty around multi-omics data privacy | -1.2% | China, India cross-border flows | Medium term (2-4 years) |
| Supply-chain dependence on US precision fluidic chips | -0.9% | Global dependence | Long term (≥ 4 years) |
| Source: Mordor Intelligence | |||
High cost of single-cell analysis instruments
BD’s biosciences division logged USD 3.4 billion revenue in 2024 yet still moved to spin out, highlighting the capital-intensive nature of instrument R&D. 10x Genomics responded with Chromium Xo, a leaner model for budget conscious users. Consumable spend, service contracts, and staff training add hidden burdens, pushing universities toward shared core facilities. Core sharing tempers purchasing cycles and can slow experimental throughput, highlighting a price-elastic segment within the single cell analysis market.
Limited computational & bioinformatics expertise
Curio Bioscience and DNAnexus linked spatial kits to cloud workflows, aiming to shield biologists from coding complexity. India’s GenomeIndia has spurred bioinformatics curriculum growth yet demand still outstrips trained analysts. Machine learning pipelines now automate cell typing but sophisticated study designs continue to need experts, creating a bottleneck for the single cell analysis industry.
*Our forecasts treat driver/restraint impacts as directional, not additive. The impact forecasts reflect baseline growth, mix effects, and variable interactions.
Segment Analysis
By Product Type: consumables sustain revenue engines while instruments power innovation
Reagents and consumables supplied 57.62% of 2025 revenue as each run requires proprietary cartridges, beads, or reagent kits. The recurring model stabilizes vendor cash flow and anchors long-term customer relationships inside the single cell analysis market. Instruments, however, register a 17.08% CAGR through 2031 because new optical, microfluidic, and imaging features allow deeper phenotyping. BD’s FACSDiscover A8 now maps over 50 parameters in real time, expanding the single cell analysis market size for high-dimensional cytometry. Automation agreements with robotics makers shorten setup times and lift reproducibility, factors that nudge laboratories toward upgrades. Software and services remain comparatively small but are strategic funnels that lock users into vendor ecosystems by handling data pipelines and compliance documentation.
The rising instrument curve is reinforced by active-pixel semiconductor designs from Chinese startup Aosuo Technology, which promises faster protein quantification at lower luminosity errors. Such advances encourage mid-tier hospitals to step up from shared facilities to in-house units, widening geographic reach of the single cell analysis market. Vendors bundling consumables with service contracts cushion price sensitivity and foster predictable reagent consumption. This synergy keeps consumables at the revenue core even as instrument fleets modernize.


By Technique: flow cytometry retains heritage, next-generation sequencing scales reach
Flow cytometry carried 34.12% technique share in 2025 by virtue of embedded lab infrastructure and decades-old protocols that technicians master early in their careers. Multilaser spectral systems boost channel counts without fluor overlap, supporting intricate immunophenotyping. Meanwhile, next-generation sequencing books the fastest 16.89% CAGR, reflecting plunging read costs and the allure of transcriptome-wide coverage. The single cell analysis market thus aligns along two poles: high-throughput sorting on one side and deep genomic insight on the other.
Hybrid systems are bridging the divide. Takara Bio’s Shasta platform pre-enriches cells, then funnels them straight to automated NGS, collapsing sample-to-data time. Microfluidic slips from Toyohashi University push 95% cell viability in drug screens, signalling a future where gentle handling couples with sequencing depth. As sequencing output soars, laboratory planners must weigh data-storage overheads against biological payoff, a calculus that increasingly guides capital budgets within the single cell analysis market.
By Disease Area: oncology supremacy challenged by neurology’s surge
Oncology commanded 51.63% revenue in 2025 thanks to urgent clinical payoffs from mapping tumor heterogeneity. Circulating tumor cell sequencing is now sensitive enough for multi-cancer liquid biopsy triage, cementing the segment’s share of the single cell analysis market size. Neurology, however, is sprinting ahead with 17.14% CAGR as single-cell atlases unravel Alzheimer’s and Parkinson’s pathways previously masked by bulk averaging. The neurology upswing benefits from cross-fertilization with spatial transcriptomics that keeps tissue architecture intact and spotlights neuron-glia dialogues.
Immunology applications also flourish as autoimmune researchers exploit single-cell windows into aberrant T-cell clonotypes. Infectious disease teams employ mass-spec and PCR hybrids to dissect host-pathogen skirmishes at the cell level, creating long-tail demand pockets that diversify the single cell analysis market.
By Workflow Stage: isolation dominates spend, analytics gathers velocity
Sample isolation and preparation absorbed 45.92% of spending in 2025 because every downstream metric hinges on cell viability. Platforms now integrate on-chip lysis and barcoding to shrink hands-on time. Yet data analysis tools notch the steepliest 17.31% CAGR as laboratories drown in terabyte-scale outputs. The single cell analysis market share for analytic platforms is rising as cloud compute, AI clustering, and compliant pipelines become indispensable.
Library preparation kits ride the coattails of sequencing growth, while detection instruments monetize final readouts. Partnerships like BioSkryb with Tecan cut library prep to under 10 hours, keeping workflows synchronous with fast sequencers. Vendors offering end-to-end stacks from isolation through analytics enjoy pricing power and higher customer stickiness.
By Application: research leads but diagnostics accelerates translation
Research usage retained 66.42% of 2025 revenue, reflecting ongoing cell atlas projects and mechanistic disease studies. Public funding bodies bankroll multi-institution consortia that standardize protocols across the single cell analysis market. Diagnostics is the breakout category with 17.76% CAGR, fueled by regulatory validations of single-cell assays for minimal residual disease tracking. Southeast Asian hospitals already adopt circulating tumor DNA panels that flag recurrence months ahead of imaging.
Quality-control testing in cell therapy manufacturing is another rising application; scRNA-seq fingerprints production batches to verify identity and purity. Point-of-care microfluidic rigs lend rapid counts from finger-prick blood, indicating clinical usage will soon permeate primary care settings across the single cell analysis industry.
By End User: academia rules but biotech capitalizes
Universities and research institutes owned 46.21% share in 2025 as grant cycles pay for exploratory science and method development. However, biotech and pharmaceutical firms post a 17.19% CAGR on the promise of faster target validation and companion diagnostics. Arovella Therapeutics’ GMP-grade lentiviral build for CAR-T illustrates how industry embeds single-cell checkpoints within manufacturing. Hospital labs sit at the translational intersection, expanding alongside diagnostic approvals to cement clinical adoption in the single cell analysis market.
Core facilities at academic campuses evolve into revenue-sharing models where startups buy instrument time, further knitting academia and industry. The resulting ecosystem lets graduate students spin out ventures, increasing technology diffusion across the single cell analysis industry.
Geography Analysis
China generated 37.82% of 2025 revenue and is expected to maintain leadership through 2031. The “Human Spatiotemporal Genomics” mega-project mobilizes 190 research teams and fuels domestic demand for reagents, sequencers, and analytic software. Policy refinements now permit foreign companies to co-develop stem-cell diagnostics within free-trade zones, broadening market competition. Domestic suppliers, buoyed by funding rounds such as Aosuo Technology’s USD 15 million Series A, anchor local supply and shorten lead times.
India, projecting 18.02% CAGR, benefits from the BioE3 blueprint that targets a USD 300 billion bioeconomy by 2030. The GenomeIndia program’s 10,000-genome repository stimulates platform purchases, while the Bio-RIDE subsidy of INR 9,197 crore eases startup capital needs. Venture-backed firms like OneCell Diagnostics channel domestic engineering talent into cost-sensitive clinical products, magnifying local content in the single cell analysis market.
Japan’s Pharmaceuticals and Medical Devices Agency accelerates regenerative medicine approvals, keeping the nation a key adopter for iPSC and cell therapy analytics . South Korea’s K-MASTER cohort undergirds precision oncology pipelines, and government grants sponsor local bioinformatics toolchains. Australia’s Garvan Institute anchors continental research heft through the TenK10K atlas, buttressed by USD 27 million from Illumina.
Competitive Landscape
The single cell analysis market is moderately fragmented. Global heavyweights such as BD, 10x Genomics, and Illumina command broad portfolios that meld hardware, reagents, and informatics. BD’s strategic spin-out of its biosciences arm underscores the managerial focus required to keep pace with rapid feature cycles. Regional challengers differentiate on cost and niche specializations; Aosuo Technology leverages active-pixel chips for proteomics, while Japan’s On-Chip Biotechnologies pushes micro-flow platforms optimized for fragile cell types.
Artificial intelligence integration provides new battlegrounds. Rice University’s AI-infused microfluidics highlights academic-industry alliances that translate prototypes into products. Consolidation continues: Takara Bio’s 2025 purchase of Curio Bioscience added spatial genomics to its arsenal, and Illumina acquired Fluent Biosciences for bead-based single-cell prep. Vendor partnerships with robotics firms such as Hamilton aim to standardize multiomics pipelines, giving adopters turnkey solutions that compress learning curves in the single cell analysis market.
White-space opportunities span point-of-care devices, automated data curation, and consumables that lower per-cell cost below the psychological USD 0.01 threshold. Suppliers that pair consumables with subscription software unlock annuity revenue and high switching barriers. Startups exploiting low-code analytics or reagent-agnostic microfluidics can carve share if they secure regulatory clarity on data privacy and cross-border genomic transfers.
Asia Pacific Single Cell Analysis Industry Leaders
Agilent Technologies Inc.
Beckman Coulter Inc. (Danaher Corporation)
Becton, Dickinson, and Company
Bio-Rad Laboratories Inc.
Standard BioTools
- *Disclaimer: Major Players sorted in no particular order

Recent Industry Developments
- September 2024: 10x Genomics introduced Chromium Xo, a budget-conscious instrument delivering routine high-quality single-cell data.
- August 2024: Parse Biosciences partnered with Taiwan’s Prisma Biotech to distribute Evercode products and Trailmaker analytics across Asia Pacific.


Research Methodology Framework and Report Scope
Market Definitions and Key Coverage
Our study defines the Asia-Pacific single-cell analysis market as revenue generated from instruments, reagents, consumables, and enabling software that let laboratories isolate, process, sequence, image, or phenotype individual cells in research and clinical workflows. According to Mordor Intelligence, the market stood at USD 0.89 billion in 2025.
Scope exclusion: Bulk omics platforms that output averaged cell data are outside this scope.
Segmentation Overview
- By Product Type
- Instruments
- Reagents & Consumables
- Software & Services
- By Technique
- Flow Cytometry
- Next-Generation Sequencing (NGS)
- Polymerase Chain Reaction (PCR)
- Microscopy
- Mass Spectrometry
- Microfluidics-based Platforms
- By Application
- Research Applications
- Medical/Clinical Diagnostics
- By Disease Area
- Oncology
- Immunology & Autoimmune Disorders
- Neurology
- Infectious Diseases
- Other Disease Areas
- By Workflow Stage
- Single-Cell Isolation & Preparation
- Library Preparation & Amplification
- Sequencing/Detection
- Data Analysis & Interpretation
- By End User
- Academic & Research Laboratories
- Biotechnology & Pharmaceutical Companies
- Hospital & Diagnostic Laboratories
- By Country
- China
- Japan
- India
- South Korea
- Australia
- Rest of Asia-Pacific
Detailed Research Methodology and Data Validation
Primary Research
Structured calls with core-facility heads, oncology investigators, and reagent distributors across China, India, Japan, South Korea, and Australia help us validate uptake rates, discount levels, and workflow bottlenecks that documents miss.
Desk Research
We map baseline demand with open datasets such as WHO cancer registries, OECD R&D budgets, China customs logs for flow cytometers, Japan PMDA device clearances, and PubMed papers that report run counts. Analysts then overlay Questel patent volumes, Dow Jones Factiva news, and D&B Hoovers financials before confirming early-adoption pockets with the Asian Flow Cytometry Society. Investor decks, grant databases, and conference posters anchor average selling prices and replacement cycles. Many additional public sources were reviewed, though not listed here.
Market-Sizing & Forecasting
Our model starts top-down with sequencing run counts and installed flow-cytometer bases, then reconciles results with sampled supplier roll-ups. Key levers include cells per run, reagent spend per cell, oncology trial starts, precision-medicine grants, and research head count. Multivariate regression blended with scenario analysis on per-cell cost decline projects revenues to 2030, while three-year weighted averages smooth gaps.
Data Validation & Update Cycle
Outputs are stress-tested against import tallies, grant totals, and historical ASP curves; any anomaly triggers fresh expert checks before sign-off. We refresh the dataset each year and push interim updates after major funding or technology events.
Why Mordor's Asia Pacific Single Cell Analysis Market Analysis Market Baseline Earns Credibility
Published estimates often diverge because firms select different product baskets, base years, and currency treatments. Mordor Intelligence confines scope to verified single-cell workflows, converts every figure to calendar-2025 dollars, and revisits numbers annually, so our baseline stays current.
Gap drivers include whether software licenses are booked as service revenue, how consumable reuse is modeled, and if sequencer discounts are captured. Weighting these factors consistently gives buyers a steadier midpoint they can trust.
Benchmark comparison
| Market Size | Anonymized source | Primary gap driver |
|---|---|---|
| USD 0.89 B (2025) | Mordor Intelligence | - |
| USD 1.38 B (2025) | Regional Consultancy A | Counts all cell-sequencing consumables, ignores installed-base alignment |
| USD 0.71 B (2024) | Trade Journal B | Extrapolates past sales, uses 2022 FX rates |
These comparisons confirm that our disciplined steps deliver a transparent, balanced baseline that decision-makers can rely on.


Key Questions Answered in the Report
How big is the Asia Pacific Single Cell Analysis Market?
The market stands at USD 1.04 billion in 2026 and is set to reach USD 2.23 billion by 2031.
Which product category generates the most revenue?
Reagents and consumables lead with 57.62% share owing to their recurring purchase nature in every workflow cycle
Who are the key players in Asia Pacific Single Cell Analysis Market?
Agilent Technologies Inc., Beckman Coulter Inc. (Danaher Corporation), Becton, Dickinson, and Company, Bio-Rad Laboratories Inc. and Standard BioTools are the major companies operating in the Asia Pacific Single Cell Analysis Market.
Why is India the fastest-growing country market?
Government programs like BioE3 and GenomeIndia, coupled with venture-funded startups, are driving an 18.02% CAGR through 2031.
Page last updated on:


