
Market Overview
| Study Period | 2021 - 2031 |
|---|---|
| Forecast Data Period | 2026 - 2031 |
| Base Year Market Size (2025) | 27.66 gigawatt |
| Market Volume (2026) | 28.95 gigawatt |
| Market Volume (2031) | 36.4 gigawatt |
| Growth Rate (2026 - 2031) | 4.68 % |
| Market Concentration | High |
Major Players *Disclaimer: Major Players sorted in no particular order Image © Mordor Intelligence. Reuse requires attribution under CC BY 4.0. | |
Austria Renewable Energy Market Analysis by Mordor Intelligence
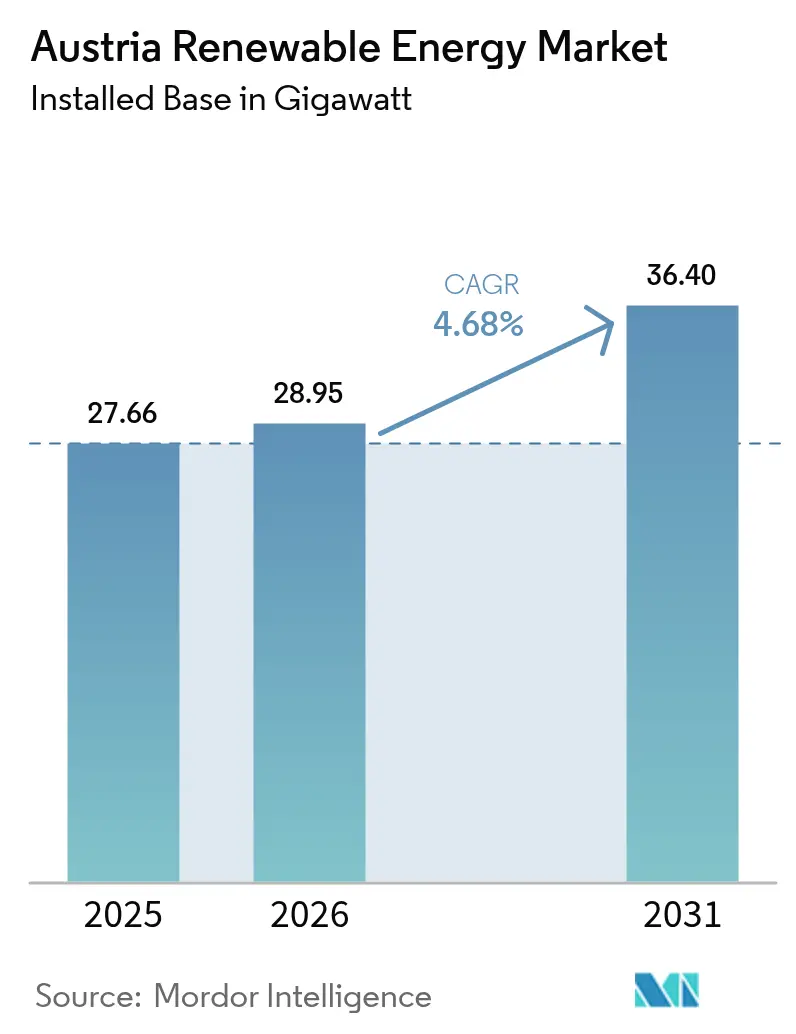
The Austria Renewable Energy Market size is expected to grow from 27.66 gigawatt in 2025 to 28.95 gigawatt in 2026 and is forecast to reach 36.4 gigawatt by 2031 at 4.68% CAGR over 2026-2031.
Faster capacity additions are driven by the Renewable Energy Expansion Act, Austria’s 100% renewable electricity target for 2030, and the broader ambition of achieving climate neutrality by 2040. Hydropower remains the backbone of electricity supply and grid stability, while solar photovoltaics and onshore wind register the steepest cost declines. National carbon pricing makes fossil fuels less competitive, public-sector financing cuts financing costs, and community-owned projects deepen citizen participation. Together, these forces keep the Austria renewable energy market on a high-growth trajectory despite grid congestion, land constraints, and labour shortages.
Key Report Takeaways
- By technology, hydropower led the Austrian renewable energy market with 46.12% of the market share in 2025, while geothermal is forecast to expand at a 36.2% CAGR through 2031.
- By end-user, utilities held 64.05% of the Austria renewable energy market share in 2025, whereas the residential segment is advancing at a 10.1% CAGR to 2031.
Note: Market size and forecast figures in this report are generated using Mordor Intelligence’s proprietary estimation framework, updated with the latest available data and insights as of 2026.
Austria Renewable Energy Market Trends and Insights
Drivers Impact Analysis*
| Driver | (~) % Impact on CAGR Forecast | Geographic Relevance | Impact Timeline |
|---|---|---|---|
| Government-backed target of 100% renewable electricity by 2030 | +1.8% | National, accelerated deployment in Vienna, Lower Austria, Burgenland | Medium term (2-4 years) |
| Hydropower-anchored grid flexibility enabling VRE integration | +0.9% | Alpine regions (Tyrol, Salzburg, Carinthia) | Long term (≥4 years) |
| Rapid LCOE decline of solar-PV and onshore wind | +1.2% | Lower Austria, Burgenland, Styria | Short term (≤2 years) |
| EU ETS and national CO₂ pricing raising fossil-fuel costs | +0.7% | Cross-border markets with Germany, Italy, Czech Republic | Medium term (2-4 years) |
| VAT-free small-scale PV systems accelerating rooftop uptake | +0.6% | National, with higher penetration in urban centers (Vienna, Graz, Linz) | Short term (≤ 2 years) |
| Rise of "energy communities" & peer-to-peer trading platforms | +0.5% | National, with pilot implementations in rural communities across all states | Long term (≥ 4 years) |
| Source: Mordor Intelligence | |||
Government-backed 100% Renewable-Electricity Target by 2030
Austria’s Renewable Energy Expansion Act mandates an extra 27 TWh, allocating 11 TWh to photovoltaics, 10 TWh to wind, 5 TWh to hydropower, and 1 TWh to biomass. Policy certainty unlocked a EUR 1.3 billion financing package for Burgenland Energie Group, illustrating how clear targets draw capital. ÖNIP allocates EUR 9 billion to transmission upgrades through 2034, easing bottlenecks.[1] Timelines are tight; Austria became a net electricity importer in August 2024, underscoring the urgency of the situation.
Hydropower-anchored Grid Flexibility Enabling VRE Integration
More than 3,000 hydropower plants, totaling 14.1 GW, equip Austria with unmatched flexibility. Facilities such as the 430 MW Reisseck II pumped-storage plant help balance wind and solar variability, while the Kronstorf substation upgrade is expected to introduce a 220-kV loop by 2030. This agility enabled renewables to supply 87% of the electricity in 2023, far exceeding the EU average.
Rapid LCOE Decline of Solar PV and Onshore Wind
Solar installations reached 2.22 GW in 2024, supported by falling equipment costs and new agrivoltaic models, which were financed by a EUR 80 million European Investment Bank loan to PÜSPÖK Group. Wind economics also improved, as evidenced by the 62 MW WEB Windenergie project in Lower Austria, which was backed by EUR 20.1 million in EIB funding. Technology gains, however, are offset by grid-connection fees and permitting delays.
EU ETS and National CO₂ Pricing Raising Fossil-Fuel Costs
Carbon pricing squeezes fossil fuel heating and transportation, accelerating the adoption of renewables. Heat-pump sales rose from 31,184 units in 2021 to 49,192 units in 2022 as carbon levies took hold. OMV invested almost EUR 200 million to co-process 160,000 tonnes of liquid biomass into renewable diesel at its Schwechat refinery, thereby reducing CO₂ emissions by 360,000 tonnes per year.[2]
Restraints Impact Analysis*
| Restraint | (~) % Impact on CAGR Forecast | Geographic Relevance | Impact Timeline |
|---|---|---|---|
| Grid congestion and lengthy permitting procedures | -0.8% | Lower Austria, Burgenland, Styria | Short term (≤2 years) |
| Insufficient storage capacity to absorb VRE peaks | -0.6% | Urban load centers (Vienna, Graz, Linz) | Medium term (2-4 years) |
| Skilled-labour shortages in RES installation & O&M | -0.4% | National, with particular impact in rural areas lacking technical training infrastructure | Short term (≤ 2 years) |
| Insufficient storage capacity to absorb VRE peaks | -0.3% | National, with grid stability challenges concentrated in high VRE penetration areas | Medium term (2-4 years) |
| Source: Mordor Intelligence | |||
Grid Congestion and Lengthy Permitting Procedures
Redispatch volumes could sextuple by 2040 without coordination, the European Commission warns.[3]Since 2018, the Germany-Austria congestion management system caps cross-border flows during peak periods. ÖNIP’s EUR 9 billion build-out will help, although completion is expected to stretch to 2034.
Limited Land Availability for Utility-Scale Wind and Solar
Mountainous terrain and dense settlement restrict the availability of greenfield sites. Agrivoltaics offers a workaround, for instance, on PÜSPÖK Group’s six dual-use farms in Burgenland. Regional planning instruments now earmark additional zones for renewables; yet, high-yield locations remain scarce, thereby inflating project costs.
*Our forecasts treat driver/restraint impacts as directional, not additive. The impact forecasts reflect baseline growth, mix effects, and variable interactions.
Segment Analysis
By Technology: Geothermal Leads the Next Wave of Additions
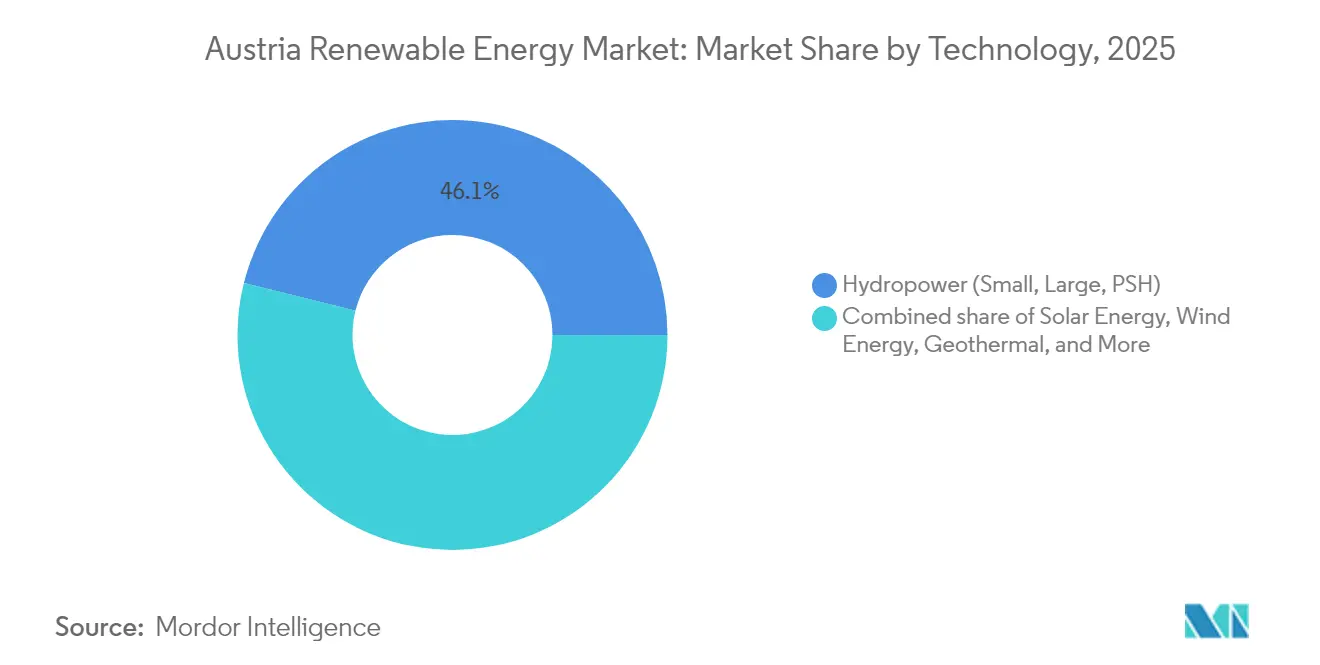
Geothermal capacity is projected to grow at a 36.2% CAGR through 2031, the fastest rate of any technology in the Austria renewable energy market, as deep wells in Vienna and Graz move from exploration to construction. Hydropower retained 46.12% of Austria's renewable energy market share in 2025, anchoring frequency stability even as solar and wind energy expand. Pumped-storage additions, such as the 480 MW Limberg III project, demonstrate how legacy hydro assets are being repurposed for long-duration flexibility. Utility-scale solar added 1.5 GW in 2024 and now benefits from levelized costs below EUR 40 per MWh, while onshore wind added 400 MW, with capacity factors above 35% in Burgenland. Bioenergy supplied 1 TWh in 2024 but faces feedstock constraints, limiting further growth.
The Austrian renewable energy market size for geothermal heat alone could surpass 0.54 GWth by 2031 if current drilling schedules hold, providing urban district-heating operators with a baseload alternative to natural gas. Solar rooftops continue to scale under zero-VAT rules, while hybrid solar-plus-storage plants, such as Energie AG's 50 MW site, illustrate the shift toward firm renewable energy sources. Wind repowering is gaining momentum as operators replace older 2 MW turbines with 4-6 MW machines on the same pads, maximizing output from increasingly scarce land. Small hydropower remains capped by environmental rules, although digital turbine retrofits are lifting efficiency at run-of-river plants. Together, the diversified portfolio mitigates weather risk and keeps Austria on track to achieve its 100% renewable electricity target.

By End-User: Residential Prosumers Accelerate Adoption
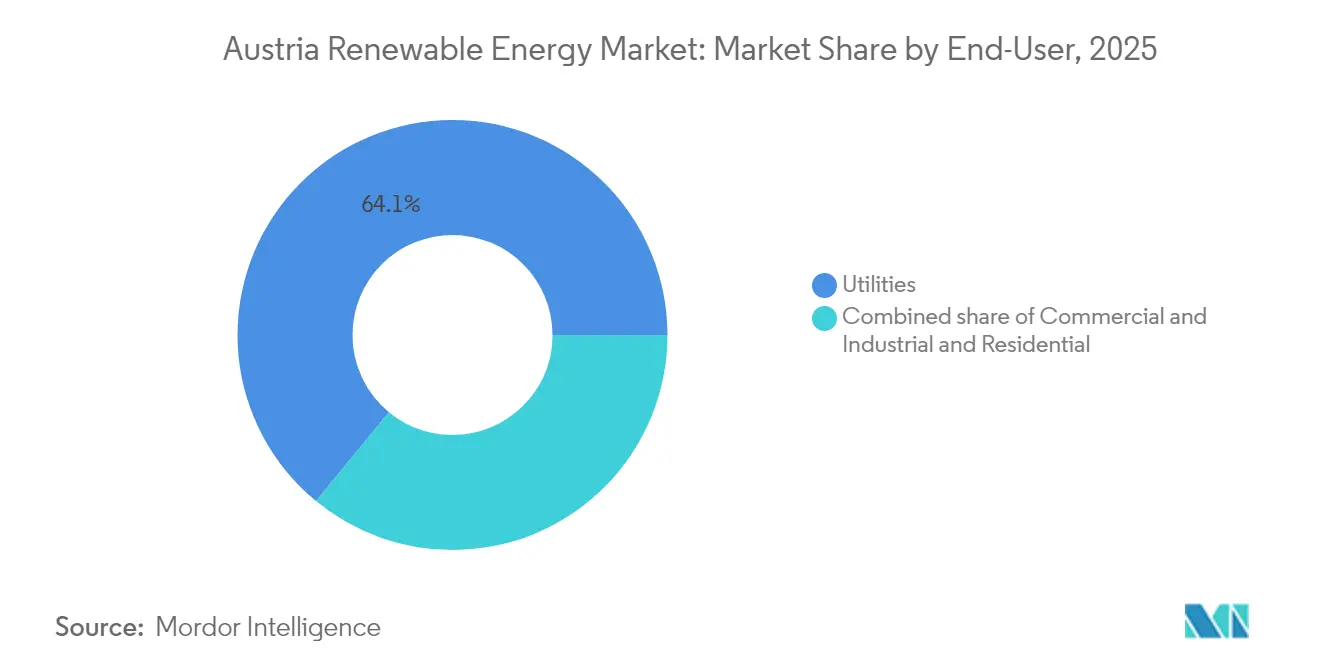
Utilities held 64.05% of the Austria renewable energy market share in 2025, but their dominance is eroding as households embrace rooftop solar and battery storage. Residential capacity is rising at a 10.1% CAGR thanks to VAT-free panels under 35 kW and grid-fee discounts of up to 57% for local peer-to-peer trades. Hybrid inverters launched by Fronius in 2024 enable prosumers to earn income from frequency regulation, reducing payback periods to under seven years. Commercial and industrial users are also expanding, led by Voestalpine’s 200 MW wind PPA that locks in low-carbon power for steel production.
Although the Austrian renewable energy market, controlled by utilities, is expected to continue growing in absolute terms, its share is anticipated to decline below 60% by 2031 as distributed generation expands. Utilities are responding with hybrid projects that blend solar, wind, and storage to offer firm capacity and ancillary services. Community-energy aggregators now bundle output from multiple rooftops to bid into balancing markets, further shifting revenue away from centralized assets. Industrial rooftops lag because of split-incentive barriers, yet energy-as-a-service contracts are starting to unlock that segment. The emerging mix of centralized hydro and decentralized solar, wind, and storage assets positions Austria for a more resilient, consumer-driven power system.
Geography Analysis
Lower Austria, Burgenland, and Upper Austria combine to form over half of the current renewable energy capacity, shaped by their flat terrain, high solar irradiation, and mature wind resources. Burgenland alone has secured EUR 1.3 billion to fund 700 MW of new solar and wind projects, and plans to double that figure by 2030. Hydropower-rich Alpine regions, such as Tyrol and Carinthia, feed surplus power into eastern load centers, their pumped-storage systems cushioning variability and underpinning regional trade.
Vienna pioneers urban renewables and is building a geothermal plant in Aspern to heat 20,000 households by 2028, removing 54,000 t of CO₂ annually. Energy-community pilots cluster here, coupling rooftop PV, battery storage, and peer-to-peer platforms. Upper Austria’s energy mix features 30% renewables led by biomass, matching its industrial heat demand while progressing on solar and wind targets
Austria’s EUR 9 billion ÖNIP transmission plan upgrades east-west corridors and integrates future hydrogen pipelines, creating a platform for cross-border power flows. The Austrian renewable energy market benefits as congestion eases, though the full benefits materialize post-2030.
Regulatory Landscape
Austria's renewable build-out is anchored by the Erneuerbaren-Ausbau-Gesetz (EAG). It targets covering 100% of electricity consumption with renewable sources by 2030 and provides the core support architecture through market premiums and investment subsidies (administered through the EAG-Foerderabwicklungsstelle). Oversight and market supervision are handled by E-Control, the independent energy regulator under the Energy-Control-Gesetz, and progress against the EAG targets is tracked through the annual EAG Monitoring Report submitted to the BMK and national institutions.
In 2026, the policy focus shifted toward execution speed. The Erneuerbaren-Ausbau-Beschleunigungsgesetz (EABG) entered into force in July 2026 to accelerate authorization procedures for renewable plants, and it explicitly ties permitting improvements to enabling infrastructure such as storage and distribution. This procedural emphasis responds to project delays associated with grid congestion and lengthy approvals, and it complements transmission planning initiatives such as the Integrated Net Infrastructure Plan (OeNIP) for multi-year grid upgrades.
Competitive Landscape
State-majority utility VERBUND generated EUR 10.4 billion in revenue in 2023 and owns approximately half of the national hydropower, aiming for climate neutrality by 2040. EVN aims to achieve a 3.8 TWh renewable energy output by 2030, expanding its wind and solar fleets. OMV is pivoting from hydrocarbons to geothermal, hydrogen, and renewable fuels, as demonstrated by the Schwechat biorefinery and its 4 TWh geothermal goal.
ANDRITZ supplies turbines and electromechanical equipment to hydropower plants worldwide, leveraging its Austrian engineering heritage. International actors such as Enphase deploy micro-inverters and batteries to capture the residential PV segment, while community-energy platforms challenge traditional retail models. Abundant EIB lending lowers weighted average capital cost, intensifying project competition. Taken together, the Austria renewable energy market shows moderate concentration and rising technological differentiation.
Austria Renewable Energy Industry Leaders
-
Verbund AG
-
Wien Energie GmbH
-
EVN AG
-
Energie AG Oberösterreich
-
Engie SA
- *Disclaimer: Major Players sorted in no particular order

Market Opportunities and Future Outlook
The near-term opportunities cluster where policy targets meet system constraints. APG's Network Development Plan (NEP) 2025, released in April 2026, sets out EUR 9 billion of grid investment through 2035 and creates a pipeline for transmission reinforcements, transformer capacity additions, and 380 kV corridors to support wind and PV integration in bottlenecked parts of eastern Austria. Grid projects are also supported by cross-border prioritization, with several APG initiatives included on the European Commission's PCI/PMI list that entered into force on April 29, 2026, helping align permitting and financing for strategic infrastructure.
On the generation side, the EAG's 2030 expansion allocations (11 TWh photovoltaics, 10 TWh wind, 5 TWh hydropower, 1 TWh biomass) keep auctions and investment subsidies central to market access. At the same time, permitting acceleration under the EABG shifts competitive advantage toward developers and OEMs that can standardize designs and move quickly through approvals. A second opportunity set focuses on firming and flexibility, where hydropower and pumped storage provide balancing headroom while rising variable renewables raise the value of short-duration and long-duration storage, grid services, and hybrid plant configurations that can meet connection and dispatch requirements under tighter network conditions. These openings sit alongside Austria's broader climate-neutrality ambition for 2040, which keeps electrification and renewable fuels on the agenda and supports multi-technology investment cases across utilities, municipalities, and industrial off-takers.
Recent Industry Developments
- June 2026: Wien Energie commissioned the 62 MW Loidesthal II wind park in Zistersdorf, Lower Austria, reported as the largest wind power project in the combined Wien Energie and ImWind portfolio. The project adds utility-scale output in a region central to Austria's wind build-out and highlights the role of consolidated development pipelines in scaling capacity.
- May 2026: EVN commissioned the 28.8 MW Gnadendorf wind park and the repowered 12.6 MW Ebenfurth wind park, and also brought online an additional 3.3 MWp PV park in Gaweinstal. The mix of new-build and repowering shows how developers extract more generation from constrained sites while keeping execution moving across multiple technologies.
- November 2024: The European Investment Bank provided EUR 80 million to PUEPSOEK Group to finance six agrivoltaic farms in Burgenland. The financing backs dual-use PV models that reduce land-use conflict and supports the addressable pipeline for utility-scale solar in a country where greenfield availability is limited.
Research Methodology Framework and Report Scope
Market Definition and Coverage
For this report, the Austria renewable energy market is defined as the country's installed renewable power generation capacity, expressed in gigawatts, across grid-connected projects and behind-the-meter systems where capacity is reported.
Scope exclusions: We exclude non-renewable generation assets and count capacity only (not electricity prices, project finance value, or power sales revenue).
Segmentation Overview
- By Technology
- Solar Energy (PV and CSP)
- Wind Energy (Onshore and Offshore)
- Hydropower (Small, Large, PSH)
- Bioenergy
- Geothermal
- Ocean Energy (Tidal and Wave)
- By End-User
- Utilities
- Commercial and Industrial
- Residential
Data Sources, Market Sizing, and Validation
Desk Research
Desk research started with capacity and generation context, since this market is sized in gigawatts and needs consistent definitions. We used public sources such as Eurostat, IEA statistics releases, IRENA capacity datasets, Austria's energy regulator publications, and grid and transmission operator updates to anchor historical capacity and new connection trends.
To build the market story around what is getting built and why, we reviewed government policy pages and targets, auction and incentive announcements, permitting notes, and association releases. We then supplemented this with company annual reports, investor decks, and reputable energy press.
In parallel, a paid subscription for company financials and news helped us cross-check ownership changes and timing of major project additions. We also ran a patent database scan as a light signal on technology direction. The desk sources listed here are illustrative only, and we used many other public references to validate and clarify data points during the build.
Primary Interviews and Surveys
Within Austria, expert interviews and surveys cover project developers, utilities, grid specialists, equipment distributors, regulators, and energy advisors. Their input is used to test capacity additions, commissioning timing, grid constraints, policy support, and gaps in reported behind-the-meter systems before the model is finalized.
Distribution of primary research fieldwork respondents
| Company type | Respondent position |
|---|---|
| Top tier: 30% | CXOs: 18% |
| Mid tier: 44% | Functional/Unit leaders: 31% |
| Smaller Players: 26% | Managers: 51% |
Market-Sizing & Forecasting
Sizing was built using a top-down approach where national capacity time series and official additions were reconstructed into a clean installed base by year, then split into renewable technologies based on reported shares and commissioning patterns. To make sure totals did not drift away from on-the-ground reality, we corroborated them with selective bottom-up checks, such as a roll-up of visible utility-scale project additions, sampled rooftop installation volumes multiplied by typical system sizes, and channel checks on annual installation pace.
A few inputs carried most of the model weight, so they were tracked carefully and refreshed during validation. These include annual net capacity additions by technology, retirement and repowering timing (particularly for older wind assets), grid connection and curtailment constraints, policy support signals like auction volumes and incentive changes, and the rooftop solar share versus utility-scale build. For the forecast, we used scenario analysis so policy and grid constraints could be reflected in low, base, and high commissioning paths, then reconciled with expert consensus from interviews. Where bottom-up visibility was incomplete, gaps were handled through conservative commissioning lags and Austria-specific utilization of historical build rates rather than forcing a full supplier roll-up.
Data Validation & Update Cycle
Outputs were checked against independent signals such as reported national capacity totals, technology-level build trends, and publicly stated pipeline and auction volumes, and then variances were reviewed before final sign-off. If an assumption created an unusual jump in a single year, it was re-tested and, where needed, respondents were re-contacted to confirm whether the change was a real commissioning shift or a timing artifact.
The report is refreshed annually, and interim updates are triggered when material policy actions, grid rules, or large project commissioning events change the near-term pathway. Before delivery, a final analyst pass is completed so the model reflects the most recent public releases and validated field feedback.
Mordor Intelligence's Austria Renewable Energy Market Size Measured Against Other Published Estimates
Published estimates for Austria renewable energy often differ because not everyone measures the same thing, even when the titles look similar. In practice, some sources size installed capacity, while others convert activity into a revenue figure, and the year used for conversion can shift the result a lot.
The table shows that the 2025 figure is presented as installed capacity, and in Mordor Intelligence's model it is counted in gigawatts of operational renewable power capacity, rather than a USD value tied to equipment sales, power prices, or investment spend. Differences also come from whether a source includes only grid-scale assets versus also counting behind-the-meter rooftop systems, and from how repowering and retirement timing is treated when projects move from planned to commissioned.
Benchmark comparison
| Source | Market Size | Gaps in Research Methodology |
|---|---|---|
| Mordor Intelligence | USD 27.66 B (2025) | |
| Regional Consultancy A | USD 1.00 B (2024) | Reported as a USD valuation that typically reflects revenue or investment activity, which can exclude capacity already installed and can vary widely with price and spending assumptions. |
| Trade Journal B | USD 6.22 B (2021) | Uses a narrower technology lens and an older base year, and it tends to align totals to selective technology capacity snapshots without normalizing for commissioning lags and retirements across the full renewable mix. |
Once the unit and the counting rule are aligned, the spread becomes easier to explain and to reconcile. Our approach stays traceable because each yearly value is tied back to capacity additions, timing adjustments, and cross-checks against publicly observable build signals.
Key Questions Answered in the Report
What is the current size of the Austria renewable energy market?
The Austria renewable energy installed capacity is 28.95 GW in 2026, and is projected to reach 36.4 GW by 2031, reflecting a 4.68% CAGR.
How fast is geothermal capacity expanding in the Austria renewable energy market?
Deep-geothermal projects are projected to grow at a 36.2% CAGR through 2031, the fastest rate among all technologies.
What share do utilities still hold in Austria's clean-power build-out?
Utilities controlled 64.05% of installed renewable capacity in 2025, though their share is expected to decline as residential and C&I segments scale.
Which regions face the worst grid congestion?
Lower Austria and Burgenland endure the most acute transmission bottlenecks, driving redispatch costs close to EUR 200 million annually.
Why are energy communities important in Austria?
More than 1,300 registered communities leverage grid-fee discounts and peer-to-peer trading, accelerating rooftop solar deployment and decentralizing market power.
What storage gap must Austria close by 2031?
The Austrian Energy Agency estimates an additional 3-5 GWh of short-duration and up to 15 GWh of long-duration capacity will be required to integrate rising VRE volumes.
Which hybrid project illustrates the future of firm renewables in Austria?
Energie AG's 50 MW solar farm paired with 10 MWh of batteries, commissioned in 2024, shows how PV plus storage can deliver frequency regulation and peak-shaving services.