Australia Telecom Tower Market Size and Share
Market Overview
| Study Period | 2020 - 2031 |
|---|---|
| Forecast Data Period | 2026 - 2031 |
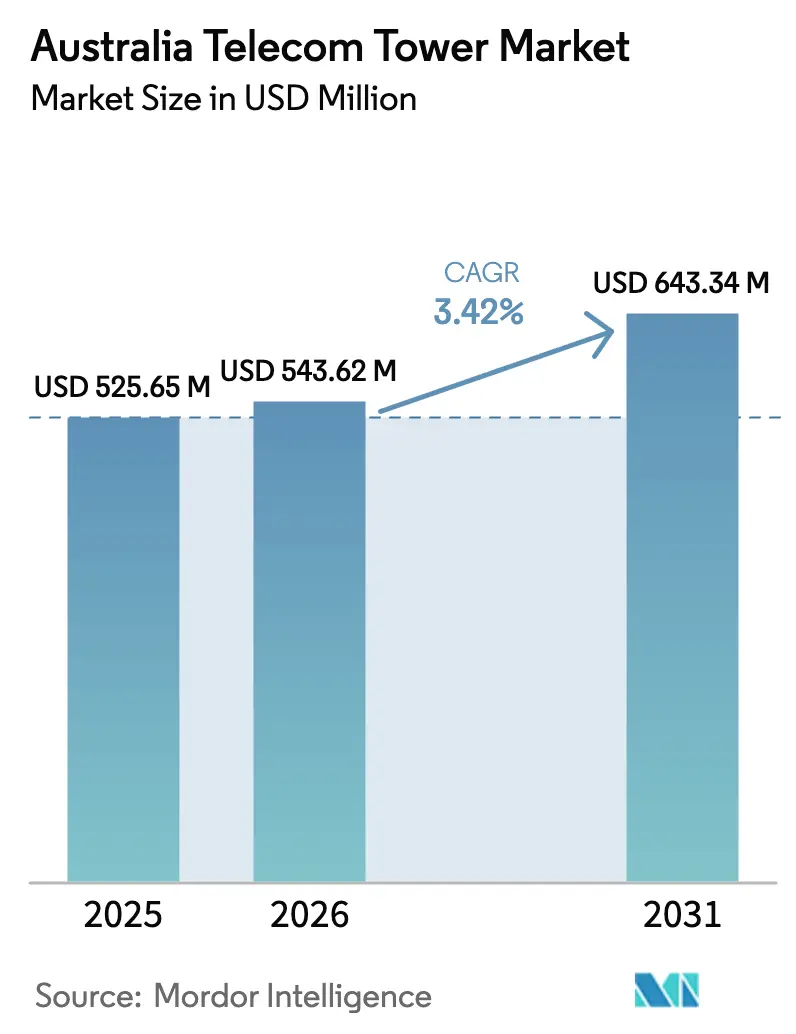
| Base Year Market Size (2025) | USD 525.65 Million |
| Market Size (2026) | USD 543.62 Million |
| Market Size (2031) | USD 643.34 Million |
| Growth Rate (2026 - 2031) | 3.42% CAGR |
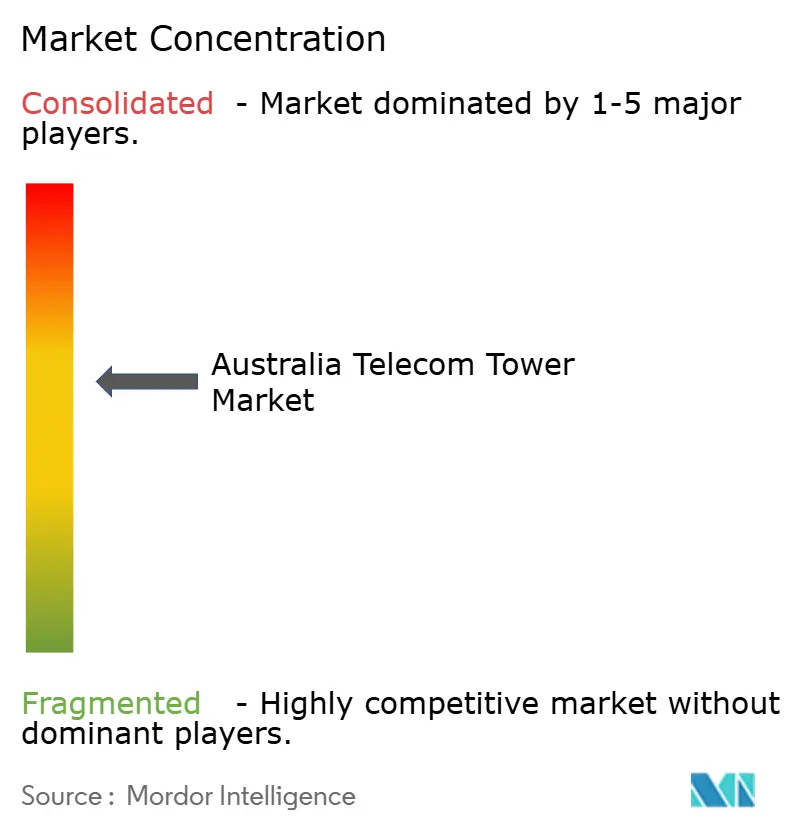
| Market Concentration | Medium |
Major Players *Disclaimer: Major Players sorted in no particular order Image © Mordor Intelligence. Reuse requires attribution under CC BY 4.0. | |
Australia Telecom Tower Market Analysis by Mordor Intelligence
The Australia Telecom Tower market size is expected to grow from USD 525.65 million in 2025 to USD 543.62 million in 2026 and is forecast to reach USD 643.34 million by 2031 at 3.42% CAGR over 2026-2031.
Momentum comes from a decisive pivot toward 5G densification, government-funded coverage programs, and the accelerated entry of institutional capital that favors infrastructure-light operating models. Independent TowerCos are scaling fastest on the back of sale-leaseback transactions, while renewable-powered retrofits lower lifetime operating costs and help operators meet net-zero commitments. Consolidation among TowerCos improves portfolio utilization, and network-sharing deals such as the TPG-Optus Mobile Originated Call Network (MOCN) arrangement unlock fresh rural colocation demand [1]TPG Telecom, “Media Release Updates,” tpgtelecom.com.au. Meanwhile, edge-computing roll-outs by data-center players create premium requirements for high-capacity tower backhaul, positioning towers as critical nodes for low-latency digital services.
Key Report Takeaways
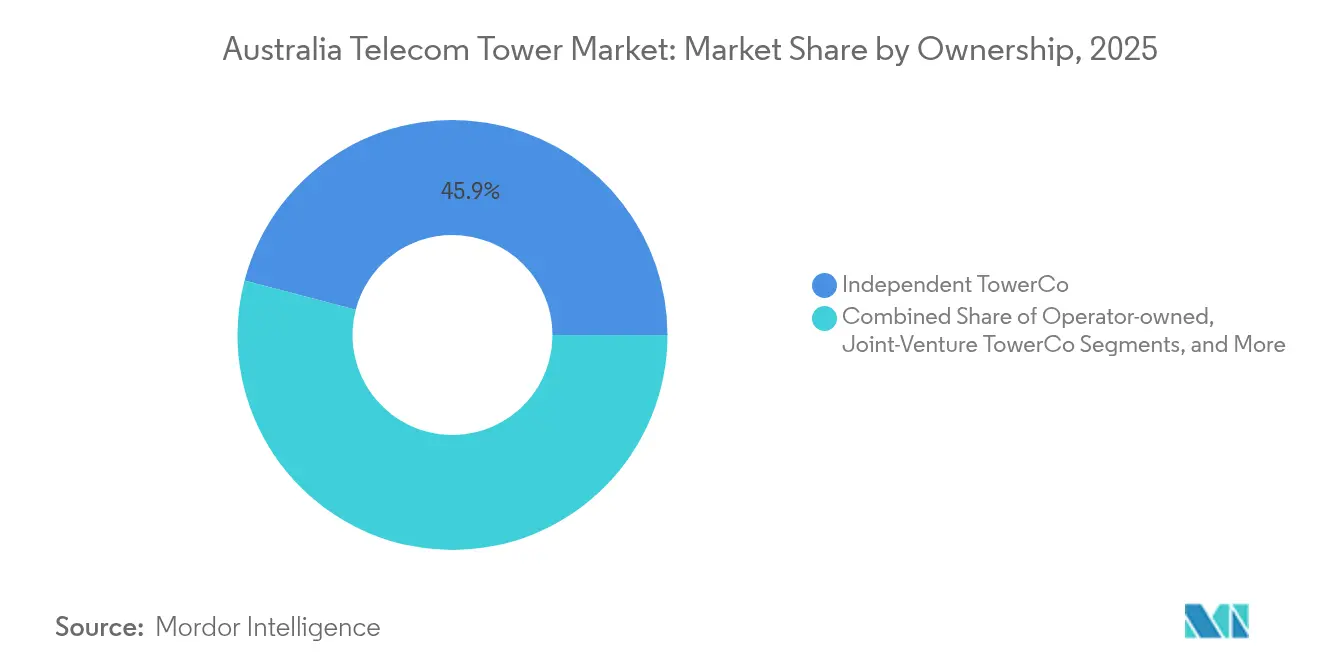
- By ownership, independent TowerCos captured 45.92% of the Australian telecom tower market share in 2025 and are expanding at a 6.08% CAGR through 2031.
- By installation, ground-based towers held a 68.85% revenue share of the Australian telecom tower market size in 2025, whereas rooftop deployments are advancing at a 4.78% CAGR to 2031.
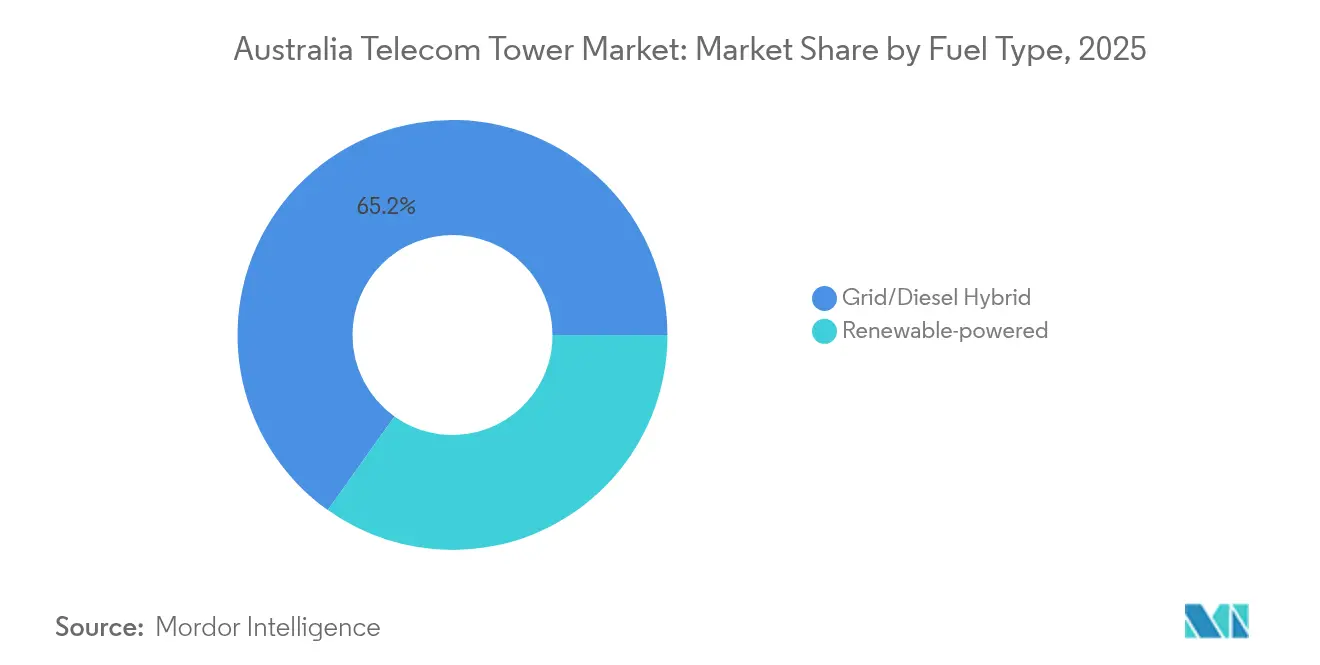
- By fuel type, renewable-powered sites accounted for only 34.85% of the Australian telecom tower market size in 2025 but led growth at a 13.98% CAGR to 2031.
- By tower type, monopoles dominated with a 54.45% share of the Australian telecom tower market size in 2025, whereas stealth and concealed designs record the fastest expansion at a 6.02% CAGR to 2031.
Note: Market size and forecast figures in this report are generated using Mordor Intelligence’s proprietary estimation framework, updated with the latest available data and insights as of 2026.
Australia Telecom Tower Market Trends and Insights
Drivers Impact Analysis*
| Driver | (~) % Impact on CAGR Forecast | Geographic Relevance | Impact Timeline |
|---|---|---|---|
| 5G population-coverage mandates accelerate densification | +1.2% | Sydney, Melbourne, Brisbane corridors | Short term (≤ 2 years) |
| Government-funded Mobile Black Spot Program Phase 6 | +0.8% | Remote regions nationwide | Medium term (2-4 years) |
| Rising data-center edge deployments needing tower back-haul | +0.6% | Metro cores and mining belts | Medium term (2-4 years) |
| Telstra-TPG MOCN sharing pushes new rural colocation demand | +0.5% | 1 million km² regional footprint | Short term (≤ 2 years) |
| Net-zero targets drive renewable-powered tower retrofits | +0.4% | National, faster in bushfire-prone zones | Long term (≥ 4 years) |
| Emergence of private-LTE/5G mining networks (Pilbara, Bowen) | +0.3% | Pilbara (WA), Bowen Basin (QLD) | Medium term (2-4 years) |
| Source: Mordor Intelligence | |||
5G Population-Coverage Mandates Accelerate Densification
Regulator-imposed coverage milestones compel operators to build far denser networks than in 4G cycles, materially lifting site demand across metropolitan corridors. Optus alone plans 2,444 regional 5G transmitter locations by 2030, validating a long runway for new leases [2]The Edge Malaysia, “SingTel's Optus Wins 4G Spectrum in Australia,” theedgemalaysia.com. Although small cells complement coverage, macro and mini-macro towers remain indispensable for backhaul and radius requirements in Australia’s vast non-urban terrain. The mandate effectively locks in a multiyear capex stream and ensures predictable tenancy ratios for TowerCos positioning their assets near expected densification clusters.
Government-Funded Mobile Black Spot Program Phase 6
Phase 6 injects direct subsidies into tower builds where commercial returns are marginal, anchoring revenue even before anchor tenants sign up. Indara’s recent AUD 14.2 million award underscores how public capital de-risks rural projects, while resilience specifications, backup power, and hardened shelters raise average revenue per site. Subsidized rollouts also shorten payback periods, making these rural assets more attractive to infrastructure funds targeting stable, inflation-linked cash flows.
Rising Data-Center Edge Deployments Needing Tower Backhaul
Australia’s edge-data-center build-out led by NEXTDC brings fiber to previously underserved secondary cities, with towers acting as the final aggregation point for cloud workloads destined for mining, healthcare, and finance. Each new edge facility requires multi-gigabit throughput and diverse paths, prompting TowerCos to bundle antennas, microwave dishes, and high-capacity fiber terminators. These premium specifications translate into higher lease rates compared with legacy voice-centric macros.
Telstra-TPG MOCN Sharing Expands Rural Colocation
The September 2024 ACCC green light enables TPG to roam on Optus regional sites, sharply raising tenancy ratios while avoiding redundant builds. TowerCos gain immediate incremental revenue from equipment overlays and power upgrades. The model is expected to trim rural deployment timelines by up to two years, locking in demand ahead of original forecasts.
Restraints Impact Analysis*
| Restraint | (~) % Impact on CAGR Forecast | Geographic Relevance | Impact Timeline |
|---|---|---|---|
| Slow local-council approvals in heritage and coastal zones | -0.7% | Coastal NSW; heritage districts in Melbourne and Sydney | Short term (≤ 2 years) |
| Fiber-rich metro small-cell build cannibalizes rooftop sites | -0.5% | Sydney CBD; Melbourne inner city | Medium term (2-4 years) |
| High insurance and maintenance costs in bush-fire risk areas | -0.4% | Rural NSW, Victoria, South Australia | Long term (≥ 4 years) |
| Macro-economic cap-rate compression limits sale-leaseback upside | -0.3% | National | Medium term (2-4 years) |
| Source: Mordor Intelligence | |||
Slow Local-Council Approvals in Heritage and Coastal Zones
Municipal objections routinely stretch project timelines by 12-18 months and inflate carrying costs, even where federal low-impact provisions apply. Recent rejections in St Helens and Ocean Reef illustrate how aesthetic concerns override national coverage goals. TowerCos counter by proposing stealth designs and rooftop substitutions, but these alternatives often come with higher capex and lower structural flexibility, damping ROI.
Fiber-Rich Metro Small-Cell Build Cannibalizes Rooftop Sites
In CBD precincts blanketed by fiber, operators favor permit-exempt small cells that mount on street furniture and cover 50-200 meters, directly substituting traditional rooftop macros. ACMA’s C564 code streamlines this shift, cutting leasing revenue for legacy rooftops and forcing TowerCos to diversify into street-level assets or value-added services such as edge hosting [3]Australian Communications and Media Authority, “Communications Infrastructure Approval Processes,” acma.gov.au. While overall market demand still grows, the mix shifts toward lower-rent micro-infrastructure, moderating revenue growth in dense metros.
*Our forecasts treat driver/restraint impacts as directional, not additive. The impact forecasts reflect baseline growth, mix effects, and variable interactions.
Segment Analysis
By Ownership: Independent TowerCos Drive Market Consolidation
Independent TowerCos commanded 45.92% of the Australian telecom tower market share in 2025, reflecting a structural hand-off from vertically integrated Mobile Network Operators. This cohort benefits from scale purchasing, lean staffing models, and portfolio-wide tenancy optimization that captive owners struggle to replicate. Sale-leaseback proceeds, such as Telstra’s AUD 2.8 billion Amplitel stake sale, freed operator capital for spectrum and core-network upgrades while guaranteeing long-term tenancy contracts. Consequently, independent entities record a 6.08% growth trajectory, raising their contribution to the Australian telecom tower market size to an estimated USD 344.08 million by 2031.
Foreign pension and sovereign funds catalyze further consolidation by targeting fragmented regional assets; OMERS-backed Waveconn’s takeover of American Tower’s domestic portfolio epitomizes this inbound capital wave. The ownership shift also enhances transparency and governance since most independents adopt real-estate-style reporting and ESG frameworks, aligning with lenders’ sustainability mandates. Joint-venture structures survive mainly where network-sharing arrangements lock multiple MNOs into shared governance, while operator-owned portfolios focus on mission-critical or high-security sites such as defense installations.


By Installation: Rooftop Renaissance within Ground-Based Dominance
Ground-based towers retained a 68.85% slice of the Australian telecom tower market size in 2025 because they deliver unmatched height, loading, and coverage radius, attributes vital for regional service. Yet rooftops are growing at a 4.78% CAGR, lifted by urban densification and aesthetic opposition to new lattice structures. Leasing pre-existing building space circumvents lengthy land-use approvals and trims civil-works budgets, boosting project IRRs even at higher monthly rents.
Hybrid rooftop plus small-cell strategies now underpin dense 5G rollouts in Sydney and Melbourne business districts. Operators deploy compact, multi-band antennas on parapets, while TowerCos backfill power and fiber connectivity, turning each building into a mini-hub. Ground-based builds still dominate remote mining belts and transport corridors where tower height and generator capacity trump footprint concerns. Collectively, the two formats meet complementary needs, ensuring balanced growth across the Australian telecom tower market.
By Fuel Type: Renewable Revolution Reshapes Operating Models
Grid/diesel hybrids accounted for 65.15% of 2025 energy configurations yet face displacement as renewable solutions race ahead at 13.98% CAGR. TowerCos adopts solar-battery arrays and pilot hydrogen fuel cells, leveraging Australia’s rich solar resources and improved storage densities. Telstra’s hydrogen trials across five Victorian sites highlight viability in temperate climates, while EdgePoint Towers’ first solar-hybrid macro in Queensland sets a benchmark for subtropical deployment.
Renewables cut fuel truck rolls, shrink emissions, and lessen wildfire ignition risk, satisfying both ESG investors and insurers. Over time, renewable-powered sites are forecast to represent USD 401.37 million of the Australian telecom tower market size by 2031. Meanwhile, grid/diesel hybrids persist in high-traffic metro areas where power draw exceeds current battery autonomy or where roof-space limits panel arrays. The coexistence phase gives TowerCos a diversified asset mix that hedges fuel-price volatility.
By Tower Type: Monopole Pre-eminence Meets Stealth Upswing
Monopoles held 54.45% of the Australian telecom tower market size in 2025 because they combine structural efficiency with streamlined permitting. Fabricated off-site and installed rapidly, they fit most suburban and regional contexts. However, stealth and concealed towers register 6.02% CAGR as councils enforce stricter visual-impact standards, especially near coastal lookouts and heritage precincts.
Stealth designs, monopalms, monopines, flagpoles, cost 20-30% more yet unlock approvals that traditional steel masts cannot secure, commanding premium rents to offset higher capex. Lattice and guyed towers remain niche, deployed where antenna count or microwave dishes demand wider faces or greater height. Across categories, modular construction and standardized anchor cages accelerate build cycles, sustaining supply to match densification targets within the Australian telecom tower market.
Geography Analysis
Australia telecom tower market growth differs sharply by region, mirroring population clusters, mining activity, and local regulations. Metropolitan cores, Sydney, Melbourne, and Brisbane, lead densification as operators chase 5G population-coverage targets, propelling rooftop and small-cell roll-outs that raise tenancy density. Regional expansion pivots on the Federal Mobile Black Spot Program and the Telstra-Optus-TPG MOCN framework, which together finance or repurpose infrastructure across an extra 600,000 km² of underserved territory.
In Western Australia’s Pilbara, autonomous haul-truck fleets and private LTE grids stimulate tower demand beyond consumer traffic. Each new mine-site network installs dedicated macro poles with hardened shelters and 100 Mbps backhaul, commanding rental premiums up to 40% above nationwide averages. Queensland’s Bowen Basin replicates the pattern as coal producers digitize operations. Conversely, coastal New South Wales faces deployment friction due to vocal community opposition and heritage overlays, forcing TowerCos toward costlier stealth or rooftop options.
Edge-data-center nodes in Port Hedland, Newman, and Sunshine Coast multiply fiber endpoints and interconnect towers into low-latency rings, blurring the line between telecom and cloud infrastructure. Bushfire-prone belts in Victoria and South Australia necessitate hardened, renewable-powered designs, raising capex but winning insurance discounts. The geographic mosaic keeps asset strategies varied, but across all zones, the Australian telecom tower market continues its measured shift from pure coverage plays toward hybrid models that integrate energy, backhaul, and edge computing functions.
Competitive Landscape
Three leading Independent TowerCos, Telstra’s Amplitel, AustralianSuper’s Indara, and OMERS-backed Waveconn, collectively manage a significant share of active sites, giving the Australian telecom tower market a moderate concentration profile. Amplitel leverages an 8,000-site footprint to negotiate multisector tenancy deals and reported 45.5% external revenue growth in FY2024 after overlaying 5G equipment across legacy macros. Indara focuses on rural resilience, builds financed by Black Spot grants, while Waveconn accelerates through acquisitions, having absorbed American Tower’s domestic assets in late 2024.
Below the top tier, Everest Infrastructure Partners and Axicom pursue opportunistic buys in mining corridors and coastal towns where incumbents under-invest. Competitive differentiation increasingly hinges on operational technology, remote monitoring, predictive maintenance, and ESG reporting, as much as on sheer site count. Renewable-ready designs and edge-hosting suites now feature in bid proposals, allowing TowerCos to upsell power, shelter, and fiber capacity rather than compete solely on rent discounts.
Regulatory oversight by the Australian Competition and Consumer Commission ensures non-discriminatory access, preventing any single landlord from throttling market entry. Sale-leaseback pipelines remain robust as MNOs offload mature sites to free capital for standalone 5G cores and Open RAN experiments. The interplay of consolidation and specialization balances the market, sustaining healthy, if unspectacular, growth through 2030 within the Australian telecom tower market.
Australia Telecom Tower Industry Leaders
Amplitel (Telstra Group)
Indara Digital Infrastructure
Waveconn (OMERS Infrastructure)
BAI Communications (Boldyn Networks)
Everest Infrastructure Partners AU
- *Disclaimer: Major Players sorted in no particular order

Recent Industry Developments
- February 2025: Telstra earmarked USD 800 million for nationwide mobile-network modernization, prioritizing 5G capacity upgrades that raise tower loading and power requirements.
- January 2025: TPG Telecom’s regional network-sharing agreement with Optus went live, doubling TPG’s geographic footprint to more than 1 million km² and triggering colocation upgrades across 2,444 sites.
- September 2024: Waveconn signed to acquire American Tower’s Australian entities, adding 170 sites and marking sustained international investment appetite for domestic telecom infrastructure.


Australia Telecom Tower Market Report Scope
The telecommunication market is largely concerned with the operations and provision of infrastructure for transmitting data - voice, image, sound, text, and video. To expand its network and services, the telecommunication market relies on towers, which are used to mount telecommunication networking and power equipment.
The Report Covers Australia Telecom Tower Companies and the Market is Segmented by Ownership (Operator-Owned, Private-Owned, MNO Captive Sites), by Installation (Rooftop, Ground-Based), by Fuel Type (Renewable, Non-Renewable). The Market Sizes and Forecasts are provided in terms of Installed base (in Thousand Units) for all the above Segments.
| Operator-owned |
| Independent TowerCo |
| Joint-Venture TowerCo |
| MNO Captive |
| Rooftop |
| Ground-based |
| Renewable-powered |
| Grid/Diesel Hybrid |
| Monopole |
| Lattice |
| Guyed |
| Stealth / Concealed |
| By Ownership | Operator-owned |
| Independent TowerCo | |
| Joint-Venture TowerCo | |
| MNO Captive | |
| By Installation | Rooftop |
| Ground-based | |
| By Fuel Type | Renewable-powered |
| Grid/Diesel Hybrid | |
| By Tower Type | Monopole |
| Lattice | |
| Guyed | |
| Stealth / Concealed |


Key Questions Answered in the Report
What is the forecast value of the Australia telecom tower market by 2031?
The market is projected to reach USD 643.34 million by 2031, growing at a 3.42% CAGR.
Which ownership category grows fastest through 2031?
Independent TowerCos record the highest growth at 6.08% CAGR thanks to sale-leaseback deals and portfolio consolidation.
Why are renewable-powered towers gaining traction?
Net-zero targets, lower fuel logistics, and maturing solar-battery systems drive a 13.98% CAGR for renewable-powered sites.
How does the Telstra-TPG MOCN deal affect rural tower demand?
It instantly raises tenancy ratios across 2,444 regional sites, expanding coverage to over 1 million km² and boosting colocation revenue.
Which tower type sees the fastest growth?
Stealth and concealed structures grow at 6.02% CAGR as councils enforce stricter visual-impact rules in sensitive zones.
What regional market offers premium lease rates?
Western Australia’s Pilbara mining belt commands rentals up to 40% above the national average due to private LTE and autonomous-operations needs.
Page last updated on:


