Market Overview
| Study Period | 2020 - 2031 |
|---|---|
| Forecast Data Period | 2026 - 2031 |
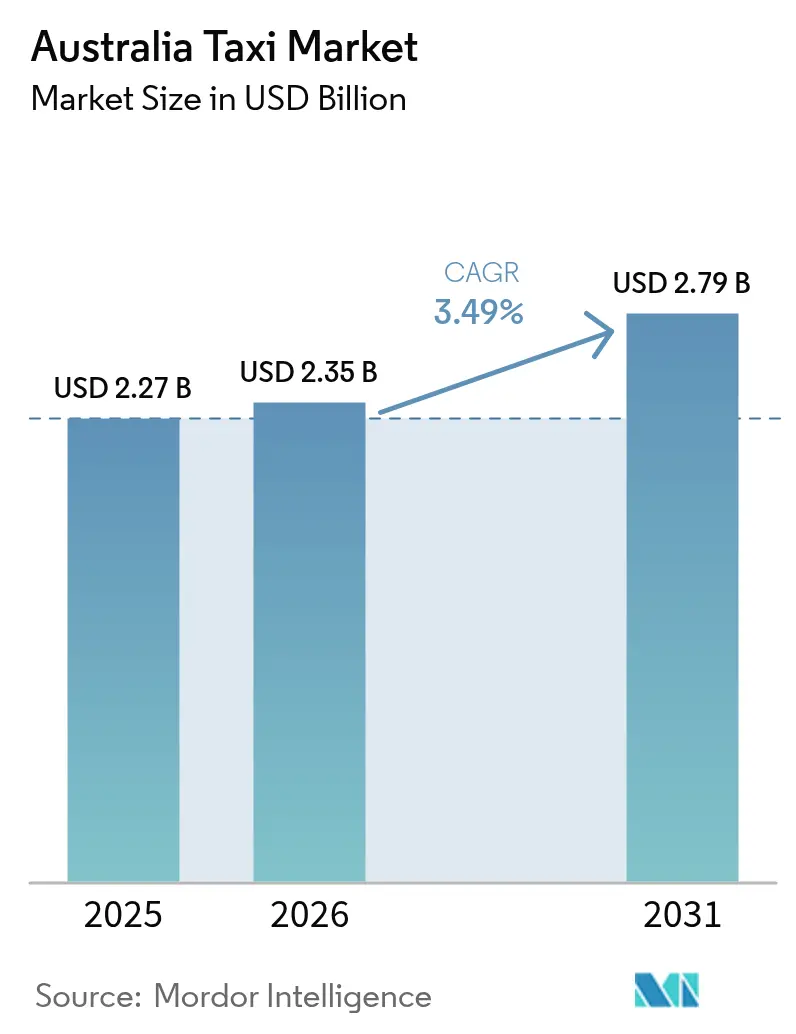
| Base Year Market Size (2025) | USD 2.27 Billion |
| Market Size (2026) | USD 2.35 Billion |
| Market Size (2031) | USD 2.79 Billion |
| Growth Rate (2026 - 2031) | 3.49% CAGR |
| Market Concentration | High |
Major Players *Disclaimer: Major Players sorted in no particular order Image © Mordor Intelligence. Reuse requires attribution under CC BY 4.0. | |
Australia Taxi Market Analysis by Mordor Intelligence
The Australia taxi market size in 2026 is estimated at USD 2.35 billion, growing from 2025 value of USD 2.27 billion with 2031 projections showing USD 2.79 billion, growing at 3.49% CAGR over 2026-2031. Steady growth reflects a mature, well-regulated landscape balancing recovery in tourism, rising corporate travel, and the rapid shift toward digital booking channels. Airport passenger volumes rebounded sharply in 2024, tightening the link between aviation traffic and short-haul taxi demand. National Disability Insurance Scheme (NDIS) transport budgets, wheelchair-accessible taxi incentives, and Mobility-as-a-Service (MaaS) pilots add structural demand that insulates operators from cyclical swings. At the same time, ride-share platforms and new emission standards accelerate fleet renewal, pushing operators to invest in hybrids and battery-electric cars. Regulatory modernization remains uneven across states, but recent class-action settlements and fare-setting reviews indicate a gradual convergence of standards that should lower compliance friction for multi-state fleets.
Key Report Takeaways
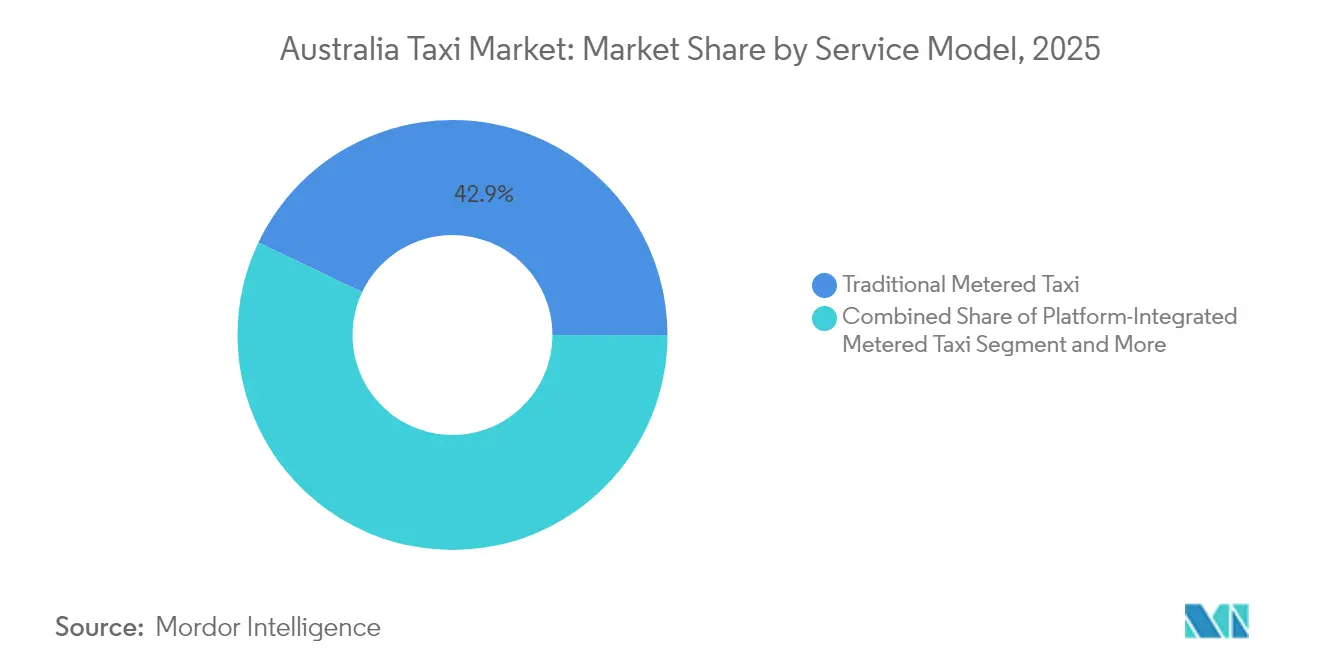
- By service model, traditional metered taxis led with 42.93% of the Australia taxi market share in 2025, while shared and shuttle services are projected to post the fastest 4.39% CAGR through 2031.
- By booking channel, apps and online platforms captured 63.45% share of the Australia taxi market in 2025 and are expanding at a 6.12% CAGR over the forecast period.
- By vehicle body style, sedans commanded 42.85% of the Australia taxi market share in 2025, whereas hatchbacks are advancing at a 5.41% CAGR through 2031.
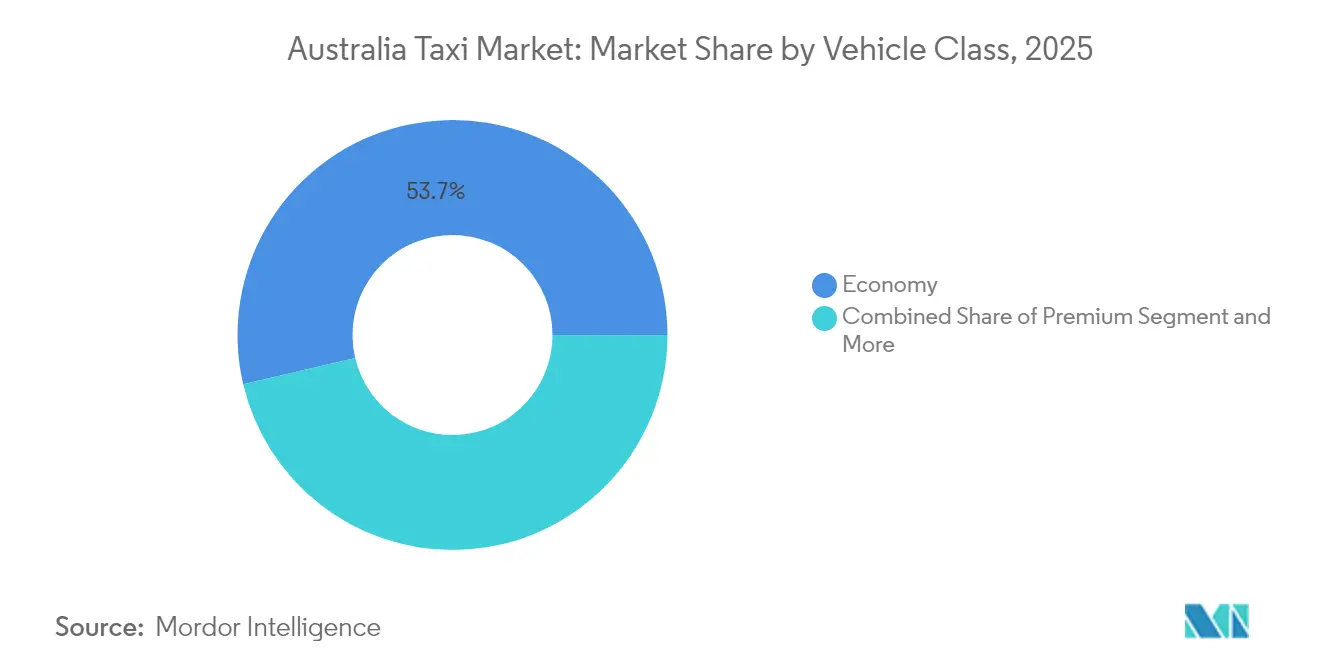
- By vehicle class, economy cars held 53.68% of the Australia taxi market share in 2025, and the luxury and business class segment is forecast to grow at a 4.39% CAGR through 2031.
- By end user, airport passengers contributed 39.55% of the Australia taxi market share in 2025, whereas corporate travelers represent the fastest-growing segment with a 4.65% CAGR to 2031.
- By fuel type, LPG-powered vehicles accounted for 46.89% of the Australia taxi market share in 2025, while battery-electric taxis will rise fastest at a 6.13% CAGR during the outlook.
- By state, New South Wales generated 33.08% of the Australia taxi market share in 2025; Western Australia is expected to record the highest 3.86% CAGR to 2031.
Note: Market size and forecast figures in this report are generated using Mordor Intelligence’s proprietary estimation framework, updated with the latest available data and insights as of 2026.
Australia Taxi Market Trends and Insights
Drivers Impact Analysis*
| Driver | (~) % Impact on CAGR Forecast | Geographic Relevance | Impact Timeline |
|---|---|---|---|
| Growing Tourism Inflows | +0.8% | NSW, Victoria, Queensland | Medium term (2-4 years) |
| Expansion of Mobility-as-a-Service Platforms | +0.6% | Sydney, Melbourne metro areas | Long term (≥ 4 years) |
| Integration of NDIS Budgets | +0.5% | Urban centers nationwide | Long term (≥ 4 years) |
| Scope-3 Reporting Driving Low-Emission Taxis | +0.4% | Sydney, Melbourne, Perth corporate hubs | Long term (≥ 4 years) |
| Wheelchair-Accessible Taxi Subsidies | +0.4% | Queensland, NSW | Short term (≤ 2 years) |
| Push For Cashless and Open-Loop Payments | +0.3% | National | Medium term (2-4 years) |
| Source: Mordor Intelligence | |||
Growing Tourism Inflows
International arrivals revived robustly after border reopening, lifting airport-origin taxi trips and landside access revenues. Passenger throughput at Sydney, Melbourne, Brisbane, and Perth airports reached 100.7 million in FY 2023, multiplying vehicle turn-round and queue management requirements for rank operators[1]“Airport Monitoring Report 2022-23,”, Australian Competition and Consumer Commission, accc.gov.au . In Australia’s tourism sector, taxi transport is becoming increasingly vital, especially in major gateway cities. Recent economic contributions from taxis have surged, mirroring a rebound in travel activities and bolstering urban mobility services. With international visitor numbers—particularly from Asia-Pacific markets—rising, the demand for dependable, point-to-point transport is firmly rooted in coastal capitals boasting established infrastructure.
Traditional taxi fleets, bolstered by long-standing concession agreements, enjoy priority access to bustling ranks. This advantage helps them remain profitable, even in the face of mounting competition from ride-share platforms. Such a solidified stance enables operators to uphold service standards and tap into concentrated demand, all without the need for hefty new infrastructure investments.
Expansion of Mobility-as-a-Service (MaaS) Platforms
In Australia’s shifting transport landscape, the rise of Mobility-as-a-Service (MaaS) platforms is reshaping the traditional role of taxis. For instance, Transport for NSW’s Opal Next Generation initiative underscores the potential of taxis as integral first- and last-mile connectors in unified trip-planning systems. The increasing adoption of digital journey planners signals a robust public enthusiasm for multimodal travel, with users leaning on these platforms for crafting efficient, comprehensive trips.
Taxi operators stand to gain strategically from MaaS integration. With real-time insights into public transport disruptions, they can dynamically adjust pricing and service deployment. This agility allows taxis to cater to heightened demand during peak times or service outages. Those who embraced these platforms early are reaping the benefits of accumulating data insights, especially as passengers transition from hailing taxis on the street to seeking app-based recommendations.
Unified payment systems, exemplified by Queensland’s public transport fare pilot, showcase how cohesive fare structures can facilitate smooth transitions between different transport modes. Such systems bolster overarching mobility objectives while ensuring the sustainability of taxis, especially in regions lacking extensive rail services. With the ongoing evolution of MaaS platforms, taxis are set to be pivotal in offering adaptable, responsive, and cohesive transport solutions—filling infrastructure voids and enriching the passenger journey.
Wheelchair-Accessible Taxi Subsidies and Lift-Payment Incentives
Accessible transport initiatives are reshaping taxi services in Australia, ensuring equitable mobility for passengers with disabilities. Queensland's Taxi Subsidy Scheme stabilizes operator revenues and boosts service availability by subsidizing metered fares and compensating drivers for wheelchair assistance, encouraging investment in accessible vehicles[2]“Taxi Subsidy Scheme Grants 2024–26,”, Queensland Department of Transport and Main Roads, tmr.qld.gov.au.
Targeted funding supports fleet renewal, offsetting the costs of wheelchair-ready vehicles and ensuring accessibility remains integral. New South Wales mirrors these efforts, ensuring consistent demand and user experience for accessible services. Integration with systems like the National Disability Insurance Scheme (NDIS) streamlines payments and travel planning for eligible users. Regulatory measures, such as activating meters only after boarding, enhance transparency and reduce fare disputes.
Government Push for Cashless/Open-Loop Fare Collection
Cabcharge already processes transactions nationwide for 98% of cabs, providing an advanced base for open-loop upgrades. Treasury’s December 2024 consultation on mandatory cash acceptance sparked debate, but impending state integrations with public-transport payment systems will likely keep digital uptake on track [3]“Defining Cash Acceptance for Corporations Consultation Paper, Dec 2024,”, Australian Treasury, treasury.gov.au. Hybrid terminals enable fleets to satisfy any future cash rules while retaining the efficiencies of card and mobile wallets. Open-loop payments reduce reconciliation errors, speed vehicle turnaround at ranks, and feed ride data directly into dispatch platforms, supporting more accurate demand forecasting and surge management.
Restraints Impact Analysis*
| Restraint | (~) % Impact on CAGR Forecast | Geographic Relevance | Impact Timeline |
|---|---|---|---|
| Competition From Ride-Share Hire | -1.2% | Sydney, Melbourne metros | Short term (≤ 2 years) |
| Fragmented State-Level Regulations | -0.7% | Varies by jurisdiction | Medium term (2-4 years) |
| Falling Taxi-Plate Values | -0.5% | Legacy-operator markets | Long term (≥ 4 years) |
| Mandatory Telematics and Data-Sharing Costs | -0.3% | Nationwide | Medium term (2-4 years) |
| Source: Mordor Intelligence | |||
Rising Competition from Ride-Share and Point-to-Point Hire
Despite facing legal settlements and shifts in competition, Uber continues to be a strong player in Australia's ride-share market, boasting a substantial user base. The 2024 exit of Ola diminished the competitive landscape, channeling more business towards Uber and DiDi. With the Fair Work Commission's new regulatory powers, gig workers may see heightened minimum standards, potentially bridging the cost gap between ride-shares and traditional taxis. Yet, in urban areas dense with smartphone users, the ingrained preference for app-based hailing poses ongoing challenges for conventional taxi bookings.
Fragmented and Shifting State-Level Regulations
Taxi fleets in Australia grapple with operational complexities due to regulatory fragmentation across states. Inconsistent fare caps, licensing fees, and vehicle-age limits disrupt economies of scale. Additionally, differing child-restraint rules create confusion for drivers operating across state lines. For instance, Victoria and Tasmania employ unique fare methodologies and licensing processes, while Queensland's sliding scale for licence fees introduces further complications. Multi-state operators face heightened administrative burdens, as they must diligently track compliance across various jurisdictions, limiting their operational flexibility.
*Our forecasts treat driver/restraint impacts as directional, not additive. The impact forecasts reflect baseline growth, mix effects, and variable interactions.
Segment Analysis
By Service Model: Resilient Traditional Base, Accelerating Shuttle Services
In 2025, traditional metered taxis delivered 42.93% of revenue within the Australia taxi market. Exclusivity at airport ranks and familiarity among older passengers underpin this share. Shared and corporate shuttle solutions are scaling at a 4.39% CAGR through 2031, buoyed by company sustainability pledges prioritizing pooled trips to curb per-capita emissions. ComfortDelGro Australia’s 2024 acquisition of A2B Australia integrates the 13cabs and Silver Service brands into a cross-model portfolio, enabling seamless dispatch between legacy meters and platform-booked shuttles. Consolidation equips operators with data pools broad enough to refine utilization algorithms and shrink deadhead mileage.
Platform-integrated taxis sit between legacy meters and pure ride-share, offering licensed drivers the flexibility of app bookings while preserving metered street-hail rights. They also satisfy state requirements for security cameras and tamper-proof meters, lowering compliance risk relative to ride-share vehicles that may still be navigating telematics mandates.


By Booking Channel: Digital Leadership Locks In
App and online platform owned 63.45% share of the Australia taxi market in 2025, rising at a 6.12% CAGR through 2031. App penetration crosses socioeconomic strata, with growing comfort among seniors using simplified interfaces. Phone-based dispatch retains relevance in rural districts where patchy data coverage hampers real-time GPS feeds. Rank and street hail bookings remain entrenched near entertainment precincts and stadiums, where impulse demand peaks and app wait-times stretch. Uber registers an active fleet of roughly 74,000 vehicles, demonstrating how network breadth and machine-learning pricing tighten its grip in high-density corridors.
State MaaS pilots will add fresh tailwinds. The impending Opal app upgrade in NSW will allow one-tap taxi bookings from the same screen that confirms train timetables, nudging users into integrated journey purchase flows. Operators with open APIs will slot directly into these ecosystems, capturing spill-over from overcrowded rail services during peak events.
By Vehicle Body Style: Hatchbacks Gain Ground
Sedans held a 42.85% share of the Australia taxi market in 2025, balancing luggage capacity with favorable fuel economy. Yet hatchbacks are advancing at a 5.41% CAGR through 2031, especially among independent drivers navigating congested CBD streets. Shorter wheelbases trim maneuvering time, allowing more trips per shift. Regulatory differences matter: Perth permits vehicles up to 16 years old, sheltering older sedans, whereas South Australia caps age at eight years, spurring adoption of newer, smaller, more efficient hatchbacks.
SUVs and MPVs are substitutes for high-occupancy or wheelchair jobs, reflecting how specialization segments the Australian taxi market. However, higher acquisition and fuel costs limit fleetwide uptake. Industry purchasing data show Toyota Corolla hatchbacks and Camry hybrids topped the Uber-approved models list for their 4.0 L/100 km consumption and strong resale values.
By Vehicle Class: Economy Leads, Premium Picks Up
Economy-class vehicles controlled a 53.68% share of the Australia taxi market in 2025, favored by riders prioritizing price over amenities. Premium and executive categories command higher fares but expand on narrower bases, growing 4.39% CAGR through 2031, as corporate budgets normalize post-pandemic. Taxi operators differentiate through vehicle age, leather interiors, guaranteed wait times, and bundling perks that justify premiums. Business-class routes to airports have recovered faster than general commuter lanes, benefiting from the rebound in conferences and inbound trade delegations.
By End User: Airports Anchor Volume, Corporates Drive Upside
Airport passengers hold a 39.55% share of the Australia taxi market in 2025. ACCC monitoring points to double-digit growth in landside access fees tied to passenger recovery, underscoring airports’ centrality to taxi economics. Corporate travel, though smaller in absolute trips, is the fastest-growing segment at 4.65% CAGR through 2031. Large employers seek consolidated invoicing and carbon reporting, steering demand toward licensed taxis that provide itemized receipts and verified emission data. With regulators tightening Scope-3 disclosure guidelines, fleets offering hybrid or electric options will capture premium company accounts.
By Fuel Type: LPG Holds but Electric Looms
LPG retained a 46.89% share of the Australia taxi market in 2025, although the number of LPG refueling sites has shrunk, lifting downtime costs. Petrodiesel and unleaded petrol have ceded share to petrol-hybrids, which strike a mid-transition balance between acquisition price and lower burn rates. Battery-electric taxis, while only a small base today, will post a 6.13% CAGR through 2031, supported by Uber’s 50% commission rebate for EV drivers and generous state stamp-duty exemptions.
Geography Analysis
New South Wales generated a 33.08% share of the Australia taxi market in 2025, leveraging Sydney Kingsford Smith Airport’s status as the nation’s busiest international gateway. The state’s Taxi Transport Subsidy Scheme reimburses 50% of fares for eligible users, cushioning operators against demand troughs. Victoria ranks second, with Melbourne’s cultural calendar, including the Formula 1 Grand Prix and Australian Open, supplying high-yield event traffic. Essential Services Commission fare oversight in Victoria provides predictable pricing, encouraging ongoing fleet investments despite intense ride-share rivalry.
Queensland commands a seasonally skewed profile, with coastal tourism peaks amplifying holiday-period trip volumes. Government grants subsidies for new wheelchair-ready vehicles signal a continued commitment to accessibility and should lift the average fleet age downward over the forecast. Though with a smaller absolute base, Western Australia leads growth at 3.86% CAGR through 2031. Perth’s geographic isolation and mining-sector fly-in-fly-out operations drive dependable demand for long-distance taxi services with limited rail options. Flexible vehicle-age rules in WA reduce capital outlays, raising return on invested capital for small fleet owners. South Australia, the ACT, Tasmania, and the Northern Territory remain fragmented markets but act as test beds for regulatory innovation. South Australia’s point-to-point reform aims to streamline licensing, potentially serving as a template for national harmonization. Future competition may arise from advanced air mobility; partnerships signed in Queensland envisage AUD 50 per-seat air-taxi offerings by the 2032 Olympics. While commercial deployment is a decade away, conventional taxi operators are already exploring feeder-service agreements integrating kerb-to-vertiport transfers into existing dispatch platforms.
Competitive Landscape
ComfortDelGro Australia’s April 2024 takeover of A2B Australia unified major brands—13cabs, Silver Service, and Cabcharge—under one corporate umbrella, delivering economies of scale in maintenance, insurance, and technology procurement.
DiDi leverages lower driver commission rates to lure supply away from Uber, particularly in Sydney and Melbourne, where driver wage concerns are acute. Meanwhile, niche entrants such as ZeroCabs emphasize all-electric fleets to align with corporate sustainability goals, and women-only platform Shebah caters to underserved safety-conscious demographics. Technology remains the wedge: fleets adopting predictive dispatch and AI-driven routing show higher revenue per driver hour than those relying on manual allocation. The ongoing Victorian Supreme Court litigation alleging anti-competitive conduct continues to cast legal uncertainty over market-entry tactics, but is unlikely to disrupt daily operations soon.
Australia Taxi Industry Leaders
Uber Technologies Inc.
A2B Australia Limited
GM Cabs Pty Limited
RYDO TECHNOLOGIES PTY LTD
Beijing Xiaoju Technology Co, Ltd. (DiDi)
- *Disclaimer: Major Players sorted in no particular order


Recent Industry Developments
- August 2025: The NSW government expanded funding for wheelchair-accessible cab services, enlarging the subsidy pool to enhance availability for NDIS participants.
- September 2024: Oiii App launched in Melbourne. Oiii® combines the best of traditional taxis and rideshares, offering innovative, on-demand transportation across Australia. The platform leverages advanced technology to ensure convenience, safety, and affordability, addressing the growing demand for reliable transport in the region.
- January 2024: Australia rolled out its inaugural fully electric rideshare service, Uber's "Comfort Electric." This service is set to provide Australians with eco-friendly rides. Exclusive perks include complimentary electric vehicle rides to the Melbourne tennis precinct, which are available first to Uber One members thanks to a collaboration with Kia.


Australia Taxi Market Report Scope
A taxi is a vehicle for hire with a driver used by a single passenger or a small group of passengers.
The Australian taxi market has been segmented by service type, booking type, vehicle type, and country. The market has been segmented by ride hailing and ridesharing based on service type. Based on the booking type, the market is segmented into online and offline booking. On the basis of vehicle type, the market is segmented into hatchbacks, sedans, and SUVs/MUVs. On the basis of country, the market is segmented into New South Wales, Victoria, Queensland, Western Australia, and Rest of Australia. For each segment, market sizing and forecasts have been done on the basis of market value (USD).
By Service Model
| Traditional Metered Taxi |
| Platform-Integrated Metered Taxi |
| Shared / Shuttle (Corporate and B2B) |
By Booking Channel
| App / Online |
| Phone and Dispatch |
| Street Hail / Rank |
By Vehicle Body Style
| Sedan |
| Hatchback |
| Sports Utility Vehicles and Multi-Purpose Vehicles (SUVs and MPVs) |
By Vehicle Class
| Economy |
| Premium / Executive |
| Luxury / Business |
By End User
| Corporate |
| Tourist / Leisure |
| Airport |
| Others (Individual, Govt, NDIS, etc.) |
By Fuel Type
| Petrol |
| LPG |
| Hybrid |
| Battery-Electric |
By State / Territory
| New South Wales |
| Victoria |
| Queensland |
| Western Australia |
| South Australia |
| Tasmania |
| Australian Capital Territory |
| Northern Territory |
| By Service Model | Traditional Metered Taxi |
| Platform-Integrated Metered Taxi | |
| Shared / Shuttle (Corporate and B2B) | |
| By Booking Channel | App / Online |
| Phone and Dispatch | |
| Street Hail / Rank | |
| By Vehicle Body Style | Sedan |
| Hatchback | |
| Sports Utility Vehicles and Multi-Purpose Vehicles (SUVs and MPVs) | |
| By Vehicle Class | Economy |
| Premium / Executive | |
| Luxury / Business | |
| By End User | Corporate |
| Tourist / Leisure | |
| Airport | |
| Others (Individual, Govt, NDIS, etc.) | |
| By Fuel Type | Petrol |
| LPG | |
| Hybrid | |
| Battery-Electric | |
| By State / Territory | New South Wales |
| Victoria | |
| Queensland | |
| Western Australia | |
| South Australia | |
| Tasmania | |
| Australian Capital Territory | |
| Northern Territory |


Key Questions Answered in the Report
How large is the Australia taxi market in 2026?
The Australia taxi market size is USD 2.35 billion in 2026, with a projected value of USD 2.79 billion by 2031.
What is driving growth in taxi demand across Australian airports?
Passenger volumes at major airports reached 100.7 million in FY 2023, and tourism recovery is fueling consistent point-to-point transport demand that benefits licensed taxi fleets.
How are state regulations affecting taxi operators?
Divergent fare caps, licensing fees, and vehicle-age limits across states add compliance costs that particularly affect operators with multi-state fleets.
What fuel types are Australian taxi fleets adopting?
LPG still holds the largest share, but battery-electric taxis are the fastest-growing segment at a 6.13% CAGR, aided by ride-share incentives and new charging investments.
Which segment is expanding fastest by end user?
Corporate travel shows the highest forecast growth at 4.65% CAGR as businesses demand predictable pricing and emissions data for Scope-3 reporting.
Page last updated on:


