Australia System Integration Market Size and Share
Market Overview
| Study Period | 2020 - 2031 |
|---|---|
| Forecast Data Period | 2026 - 2031 |
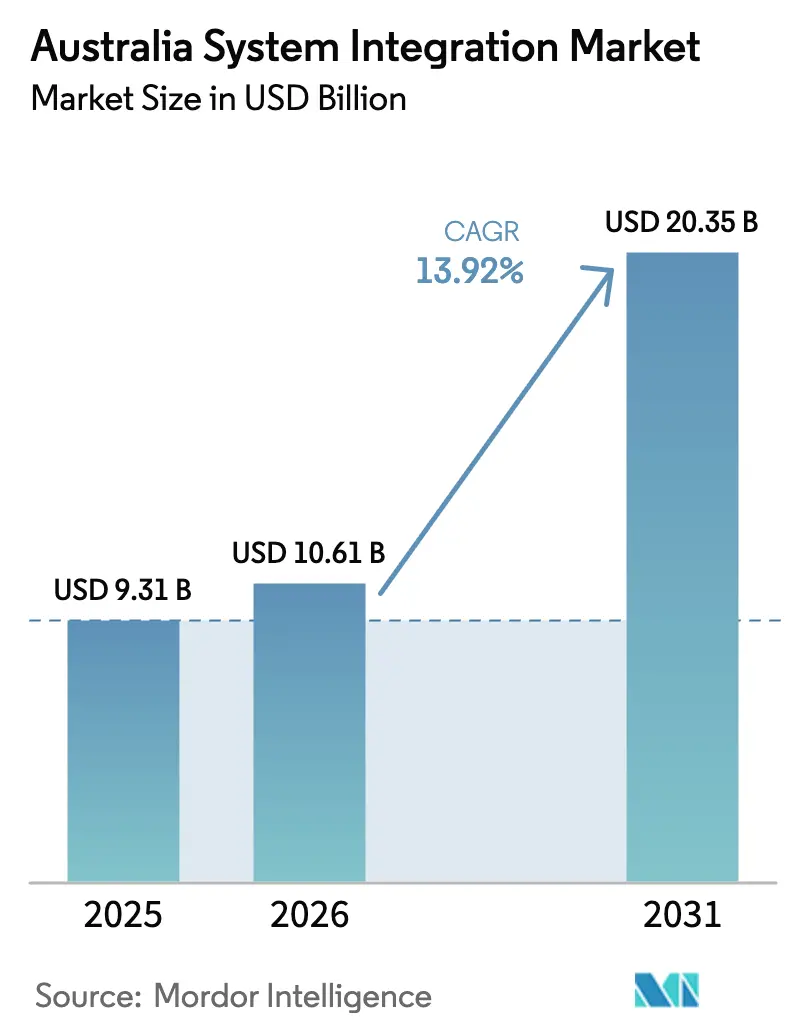
| Base Year Market Size (2025) | USD 9.31 Billion |
| Market Size (2026) | USD 10.61 Billion |
| Market Size (2031) | USD 20.35 Billion |
| Growth Rate (2026 - 2031) | 13.92% CAGR |
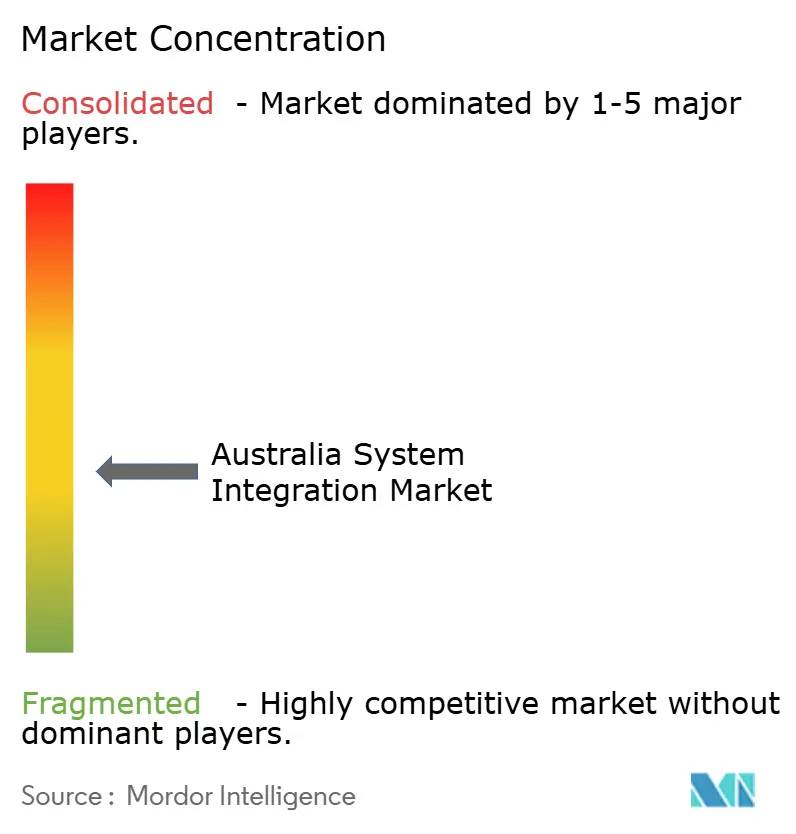
| Market Concentration | Medium |
Major Players
*Disclaimer: Major Players sorted in no particular order Image © Mordor Intelligence. Reuse requires attribution under CC BY 4.0. |
|
Australia System Integration Market Analysis by Mordor Intelligence
Australia system integration market size in 2026 is estimated at USD 10.61 billion, growing from 2025 value of USD 9.31 billion with 2031 projections showing USD 20.35 billion, growing at 13.92% CAGR over 2026-2031. Growth reflects the country’s push for sovereign digital capability, mandatory ESG reporting, and cloud-first strategies that drive end-to-end modernization across private and public sectors. Federal outlays such as the Digital ID Act 2024 and the AUD 940 million (USD 620 million) quantum-computing program sharpen demand for integration around identity, cyber-resilience, and next-generation workloads. Enterprises accelerate migration to hybrid and multi-cloud environments, while government mandates for climate disclosure force unified data architectures that join finance, supply chain, and operational systems. Edge-to-cloud integration around mining automation, vehicle-to-grid pilots, and smart-meter rollouts adds further momentum.
Key Report Takeaways
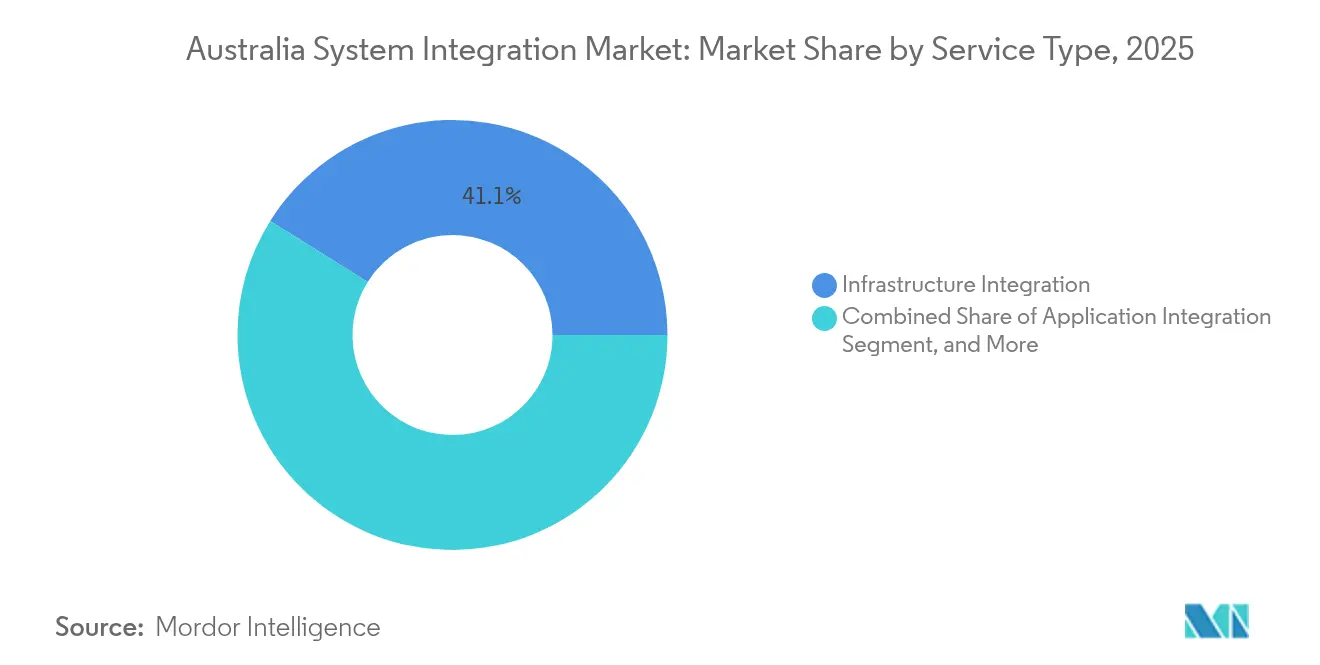
- By service type, Infrastructure Integration led with 41.10% of Australia system integration market share in 2025, while Data Integration is projected to expand at a 14.25% CAGR to 2031.
- By deployment model, the cloud segment commanded 57.80% share of the Australia system integration market size in 2025 and is growing at a 15.08% CAGR through 2031.
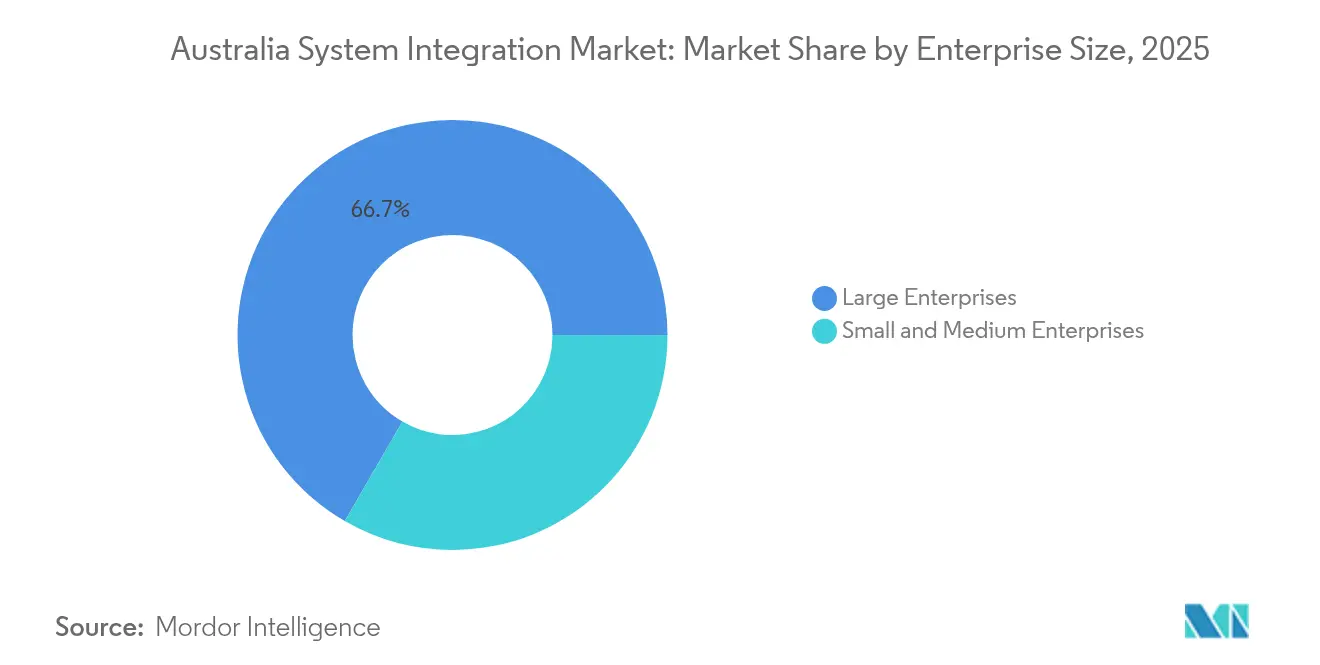
- By enterprise size, large enterprises held 66.65% share of the Australia system integration market in 2025; SMEs record the highest projected CAGR at 14.05% through 2031.
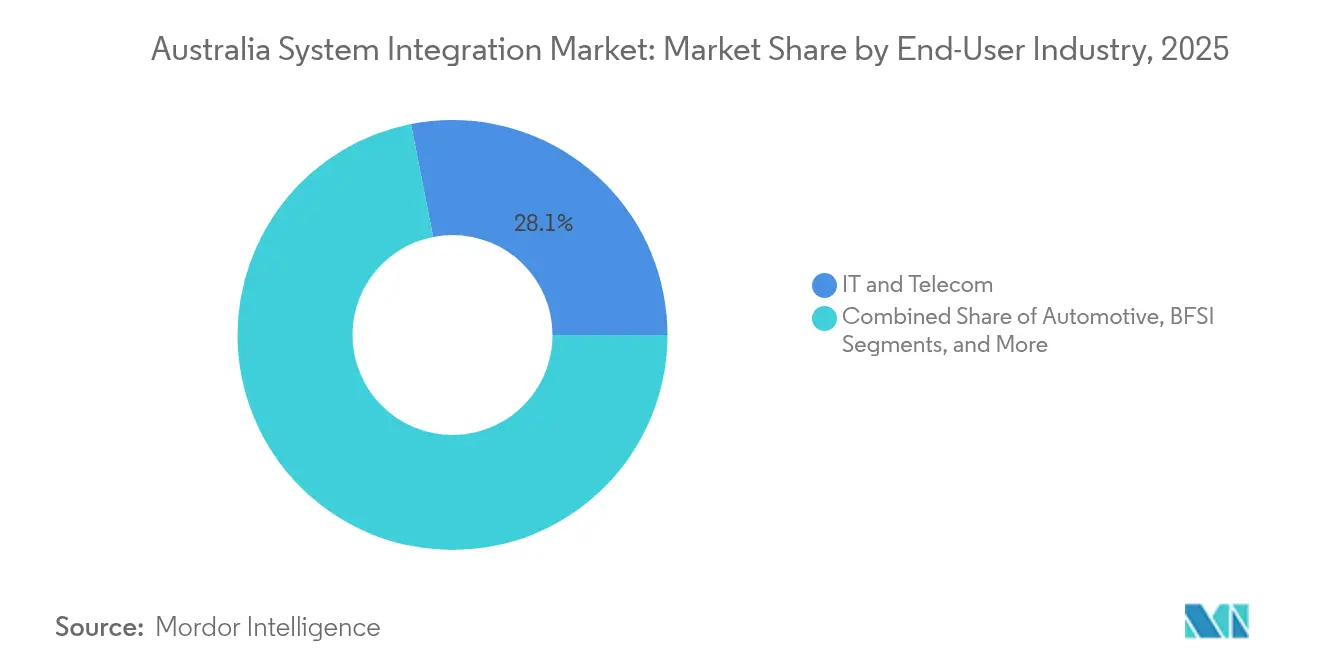
- By end-user industry, IT & Telecom captured 28.10% revenue share in 2025, while Healthcare is advancing at a 14.72% CAGR to 2031.
Note: Market size and forecast figures in this report are generated using Mordor Intelligence’s proprietary estimation framework, updated with the latest available data and insights as of 2026.
Worldwide, activity is shaped by contributions from multiple countries and regions, with Australia representing one among them. The global report on system integration market by Mordor Intelligence reflects how these countries and regional layers combine into a single system.
Australia System Integration Market Trends and Insights
Drivers Impact Analysis*
| Driver | (~) % Impact on CAGR Forecast | Geographic Relevance | Impact Timeline |
|---|---|---|---|
| Escalating cloud migration among Australian enterprises | +3.2% | National, with concentration in Sydney, Melbourne, Brisbane | Medium term (2-4 years) |
| Nationwide digital-infrastructure investments (NBN, Digital ID) | +2.8% | National, with priority rollout in regional areas | Long term (≥ 4 years) |
| Accelerated IoT adoption in resources and smart-city projects | +2.1% | Western Australia, Queensland mining regions, major metropolitan areas | Medium term (2-4 years) |
| ESG compliance data-unification imperatives | +1.9% | National, with early adoption in ASX-listed entities | Short term (≤ 2 years) |
| Defence sovereign-capability integration programs | +1.5% | South Australia, Western Australia, ACT | Long term (≥ 4 years) |
| Emergence of quantum-tech RandD integration needs | 0.8% | Queensland, New South Wales innovation precincts | Long term (≥ 4 years) |
| Source: Mordor Intelligence | |||
Escalating Cloud Migration Among Australian Enterprises
Australian organisations continue to re-platform critical workloads to public and sovereign clouds as hyperscalers commit more than AUD 18 billion (USD 11.65 Billion) to domestic data-centre capacity.Woolworths migrated 90% of its data to Google Cloud, boosting self-service analytics threefold and shrinking disaster-recovery windows from five days to two hours. The shift towards API-first and event-driven architectures enables near-real-time application integration, visible in Woolworths’ MILKRUN launch built in four months on a headless commerce stack. As composable designs replace point-to-point links, the Australia system integration market benefits from larger platform consolidation deals and demand for cloud-native orchestration.
Nationwide Digital-Infrastructure Investments (NBN, Digital ID)
Federal and state programs create mandatory standards that spur sustained integration spending. NSW invested AUD 21 million (USD 13.59 Million) in Digital Identity and Verifiable Credentials for 2024-25, while Service NSW’s Single View of Customer uses event streaming to connect 70-plus agencies. The Digital ID Act 2024 obliges public entities to adopt common frameworks, cascading to private-sector partners. Healthcare integration quickens as the National Interoperability Plan completes 14 of 44 actions, improving data exchange for patient safety.[1]Australian Digital Health Agency, “National Interoperability Plan Progress Update,” digitalhealth.gov.au These rollouts anchor long-term demand across core ERP, identity, and data-exchange layers of the Australia system integration market.
Accelerated IoT Adoption in Resources and Smart-City Projects
Autonomous haul-truck fleets at Rio Tinto’s Koodaideri mine and digital-twin platforms at BHP demonstrate edge-to-cloud integration that links operational technology with enterprise analytics. On the urban side, the Australian Energy Market Commission mandates 100% smart-meter deployment by 2030, driving high-volume data ingestion and device orchestration.[2]Australian Energy Market Commission, “Smart-Meter Implementation Pathway,” aemc.gov.au Vehicle-to-grid research predicts AUD 960 (USD 621.17) annual savings per EV through bidirectional energy trading, highlighting new integration models for utilities. Such deployments expand the Australia system integration market beyond classic IT domains into real-time industrial environments.
ESG Compliance Data-Unification Imperatives
More than 6,000 entities must lodge climate-related financial disclosures from January 2025 under the Treasury Laws Amendment Bill 2024. Firms integrate energy-management, supply-chain, and finance data to comply with Australian Sustainability Reporting Standards. Early movers like NoviqTech and Livium tokenise battery-recycling data on distributed ledgers to satisfy audit trails. Coupling sustainability with financial reporting lifts demand for unified data hubs and workflow automation, enlarging the Australia system integration market.
Restraints Impact Analysis*
| Restraint | (~) % Impact on CAGR Forecast | Geographic Relevance | Impact Timeline |
|---|---|---|---|
| Acute shortage of skilled integration professionals | -2.4% | National, with severe impact in regional areas | Short term (≤ 2 years) |
| High legacy-system migration costs | -1.8% | National, concentrated in large enterprises and government | Medium term (2-4 years) |
| Inter-state data-sovereignty and compliance complexities | -0.9% | National, with varying state-level requirements | Medium term (2-4 years) |
| Rising energy prices affecting on-premise integration ROI | -0.7% | National, with higher impact in energy-intensive industries | Short term (≤ 2 years) |
| Source: Mordor Intelligence | |||
Acute Shortage of Skilled Integration Professionals
Australia needs 60,000 additional ICT workers each year, yet university pipelines and migration programs lag demand. ServiceNow forecasts a 600,000-worker digital skills gap by 2028, pushing agencies and corporates to outsource, automate, and upskill.[3]ServiceNow, "ServiceNow AI Platform for any industry," servicenow.com Offshore delivery models expand, but visa processes slow ramp-up for critical roles. Talent scarcity inflates salaries and project timelines, trimming margins across the Australia system integration market.
High Legacy-System Migration Costs
Inflation lifts the price of data-centre upgrades, cabling, and electrical gear by up to 12%, raising overall project budgets. Westpac earmarked 30% of its AUD 1.8-2 billion (USD 1.16-1.29 billion) annual tech budget for a four-year simplification program that will cut 180 platforms to 60. Organisations weigh the expense of keeping aging systems alive versus complete refactoring. Cost overhang tempers some investment, restraining near-term growth in the Australia system integration market.
*Our forecasts treat driver/restraint impacts as directional, not additive. The impact forecasts reflect baseline growth, mix effects, and variable interactions.
Segment Analysis
By Service Type: Data Integration Drives Digital Transformation
In 2025, Infrastructure Integration commanded 41.10% of Australia system integration market share, a position cemented by National Broadband Network workstreams and smart-meter rollouts. However, Data Integration is expanding at a 14.25% CAGR and is forecast to be the primary contributor to Australia system integration market size additions through 2031. Demand escalates as ESG reporting joins transactional, OT, and customer data into common lakes for analytics.
The pivot from connectivity to data orchestration is evident in Service NSW’s Single View of Customer, where real-time streams link datasets from more than 70 agencies. Quantum-ready architectures and API management services fall under the “Others” bucket and signal the market’s shift to specialised capabilities. As firms modernise, Infrastructure Integration’s growth moderates, but its installed base underwrites steady revenue for service providers within the Australia system integration market.


By Deployment Model: Cloud-First Strategies Reshape Integration
The cloud model held 57.80% of the Australia system integration market in 2025 and is growing at a 15.08% CAGR, reflecting cost flexibility and hyperscaler investments. On-premises and private-cloud setups persist for latency or sovereignty needs, especially in resources and defence. Commonwealth Bank’s cloud-native AI reduced scam losses by 50% using real-time transaction scoring.
Hybrid approaches dominate new project architectures as Rio Tinto coordinates edge analytics at mines with cloud dashboards. The need to federate data across environments deepens demand for integration PaaS and secure API gateways. The Australia system integration market size for hybrid orchestration platforms is expected to post the fastest sub-segment gains within the deployment category during the forecast horizon.
By Enterprise Size: SMEs Embrace Cloud-Native Integration
Large enterprises captured 66.65% of the Australia system integration market in 2025 through multi-year modernisation roadmaps, but SME adoption is climbing at 14.05% CAGR. Low-code tools and integration-as-a-service models cut entry barriers. Mid-tier firms such as HEB Construction modernised ERP workflows via Boomi without heavy infrastructure outlays.
SME momentum pressures services pricing while widening the customer base. For larger firms, complexity dominates: Westpac’s effort to retire 120 legacy systems illustrates the capital tied to integration stabilisation. Providers must balance industrial-scale rollouts with agile offerings tuned for smaller customers, enlarging total addressable value for the Australia system integration market.
By End-User Industry: Healthcare Leads Digital Transformation
IT and Telecom remains the biggest spender, securing 28.10% revenue share in 2025, yet Healthcare is the fastest-growing vertical at 14.72% CAGR. The My Health Record overhaul (AUD 228.7 million) (USD 147.98 million) and the National Interoperability Plan drive EMR integrations and secure messaging. The Productivity Commission estimates potential savings of more than AUD 5 billion (USD 3.24 billion) yearly from better digital uptake.
Mining and resources trail only slightly, as autonomous haulage and digital twins push high-bandwidth, low-latency integration. Retail and e-commerce leverage omnichannel data loops, with Woolworths surpassing AUD 8 billion (USD 5.18 billion) in online sales that depend on live inventory feeds. Energy, utilities, and defence each add domain-specific requirements, broadening the scope of the Australia system integration market.
Geography Analysis
Integration activity clusters around east-coast metros, with Sydney and Melbourne hosting the bulk of enterprise headquarters and hyperscaler regions. NSW spearheads public-sector programs such as the AUD 21 million (USD 13.59 million) Digital Identity rollout and the AUD 200 million (USD 129.41 million) PaTH ERP consolidation, anchoring sizeable contracts for system integrators. Victoria’s healthcare and transport reforms contribute further project volume. In this corridor, service providers scale dedicated practices to capture recurring managed-services revenue, fuelling the Australia system integration market.
Queensland’s quantum-computing investment positions Brisbane as a specialist hub for high-performance integration. Advanced air-mobility research in the state also bolsters aerospace and defence workloads that require low-latency data handling. Western Australia’s mining belt commands specialised operational-technology integration around autonomous fleets and edge analytics. These OT-heavy deployments illustrate regional diversification in the Australia system integration market.
Regional and remote areas benefit from NBN upgrades and the mandate for nation-wide smart-meter penetration, extending demand for field-device orchestration. South Australia gains from defence contracts such as Hunter-class frigate systems, while Tasmania and the Northern Territory carve niches in renewables and government-service digitalisation. Although smaller in dollar value, these projects spread integration opportunities beyond capital cities, expanding the footprint of the Australia system integration market.
Mordor Intelligence provides coverage of the system integration market across other key regional markets. Detailed country-level analysis extends to Singapore incorporating local coverage and market participation, as required.
Competitive Landscape
The Australia system integration market is moderately concentrated. Global consultancies—Accenture, IBM, Deloitte, Capgemini—secure large transformation mandates through scale and government frameworks. Accenture led NSW’s PaTH rollout, onboarding 60,000 users across 75 agencies. Capgemini reinforced cloud expertise by acquiring Empired in 2024, while Deloitte purchased Efficientia Solutions to deepen manufacturing integration.
Local specialists differentiate with domain depth and faster cycles. The CSO Group-xAmplify merger created a AUD 100 million (USD 64.70 million) AI-focused integrator in cybersecurity automation. Telstra Purple, Datacom, and MOQdigital capture mid-market and regional deals where proximity and sector know-how matter.
Indian service providers such as HCLTech and Infosys scale local workforces and land multi-year contracts. HCLTech renewed its Transport for NSW managed-services deal and forms alliances around Microsoft’s Nuance to extend AI capabilities. Technology vendors themselves blur lines by packaging low-code orchestration: Microsoft’s Azure Integration Services and Boomi’s iPaaS allow clients to bypass some bespoke coding, subtly reshaping value pools inside the Australia system integration market.
Australia System Integration Industry Leaders
-
Accenture Australia
-
IBM Australia
-
Deloitte Australia
-
Telstra Purple
-
Capgemini Australia
- *Disclaimer: Major Players sorted in no particular order

Recent Industry Developments
- January 2025: TCS partnered with MUFG Pension & Market Services to modernize Australia’s AUD 4 trillion (USD 2.59 trillion) pension landscape.
- May 2025: Red Earth Energy Storage, Nebula Electronics, and ambibox revealed a ‘Microgrid-in-a-Box’ for residential solar, storage, and EV charging integration.
- April 2025: Woolworths chose RELEX to optimise replenishment across 1,400 stores and distribution centres.
- March 2025: ABB and Allied Green Ammonia agreed to accelerate green-hydrogen integration projects.
- February 2025: Rohde and Schwarz won a communications-systems contract for the first three Hunter-class frigates.
- January 2025: HCLTech and Microsoft deployed generative-AI fan experiences for Cricket Australia’s mobile app.


Research Methodology Framework and Report Scope
Market Definitions and Key Coverage
Our study defines the Australia system integration market as the value generated when specialist firms knit disparate hardware, software, and network subsystems into one secure, interoperable environment across on-premise and cloud estates. Consulting, infrastructure, application, and data-integration services aimed at end-users in enterprise, government, and critical-industry settings are in scope.
Scope exclusion: stand-alone software licensing, custom software development that does not culminate in multi-system integration, and pure staff-augmentation contracts are left out.
Segmentation Overview
-
By Service Type
- Infrastructure Integration
- Application Integration
- Data Integration
- Others
-
By Deployment Model
- On-Premise
- Cloud
-
By Enterprise Size
- Large Enterprises
- Small and Medium Enterprises
-
By End-User Industry
- Automotive
- Aerospace and Defense
- IT and Telecom
- BFSI
- Healthcare
- Oil and Gas
- Energy and Utilities
- Mining and Resources
- Retail and E-commerce
- Others
Detailed Research Methodology and Data Validation
Primary Research
Mordor analysts interviewed integration practice leads at tier-one consultancies, cloud-platform alliance managers, and state procurement officers across New South Wales, Victoria, and the ACT. The conversations validated price bands, project cycle times, and the rising share of subscription-style managed integration bundles, while short online surveys with CIOs at midsize enterprises clarified adoption triggers and constraints.
Desk Research
We began by mapping Australia's integration demand to macro indicators posted by the Australian Bureau of Statistics, Digital Transformation Agency technology budgets, and the Department of Industry's Digital Economy Strategy. Trade association releases from the Australian Information Industry Association and IoT Alliance Australia, along with peer-reviewed papers on cloud migration patterns published in the Journal of Systems and Software, supplied baseline adoption ratios. Our analysts then extracted revenue splits from integrator 10-Ks accessed through D&B Hoovers and screened local project awards logged on Tenders Info. Dow Jones Factiva feeds were monitored to capture mid-year contract wins and merger activity that shift market shares. This list is illustrative, not exhaustive, and numerous additional public records were consulted for corroboration.
Market-Sizing & Forecasting
A top-down build starts with national IT services spend, splits out integration-relevant lines using penetration ratios drawn from desk and primary inputs, and is subsequently cross-checked with bottom-up supplier roll-ups and sampled average selling price times project volumes. Variables such as cloud workload migration rates, data-center capacity additions, tech-workforce headcount, and federal cyber-security compliance deadlines feed a multivariate regression that generates the forecast trend. Gap areas in supplier revenue disclosures are bridged with channel checks and scenario bands before we lock the base year value.
Data Validation & Update Cycle
Outputs are run through variance and outlier screens, peer reviewed by senior analysts, and re-benchmarked against fresh contract flows each quarter. Mordor refreshes the full model annually; material events such as major policy shifts trigger interim updates so clients receive the latest view.
Why Mordor's Australia System Integration Baseline Earns Unmatched Trust
Published estimates often diverge because each publisher slices service lines differently, chooses distinct input proxies, and refreshes data on its own rhythm.
Key gap drivers for this market include whether industrial-only integration is counted, whether generic IT consulting is bundled in, and the currency year applied during conversion.
Benchmark comparison
| Market Size | Anonymized source | Primary gap driver |
|---|---|---|
| USD 9.31 B (2025) | Mordor Intelligence | - |
| USD 2.10 B (2024) | Regional Consultancy A | Focuses solely on industrial-automation projects, excluding cloud and application layers |
| USD 30.10 B (2024) | Industry Association B | Bundles entire IT services stack, inflating totals beyond genuine integration revenue |
The comparison shows that when scope is too narrow, totals collapse, and when scope is too broad, they balloon, whereas Mordor's disciplined definition, transparent variable set, and yearly audit provide decision-makers with a balanced and reproducible baseline.


Key Questions Answered in the Report
What is the current value of the Australia system integration market?
The market stands at USD 10.61 billion in 2026 and is projected to hit USD 20.35 billion by 2031.
Which segment is growing fastest within the Australia system integration market?
Data Integration is expanding at a 14.25% CAGR through 2031, outpacing all other service categories.
Why is cloud deployment so dominant in Australia?
Cloud commands 57.80% market share due to hyperscaler investments and successful enterprise migrations that highlight cost and agility gains.
How will mandatory ESG reporting influence integration spending?
More than 6,000 firms must unify sustainability and financial data from 2025, driving additional demand for data-integration and reporting platforms.
What is the chief restraint on market growth?
A national shortage of skilled integration professionals is shaving an estimated 2.4 percentage points off the forecast CAGR.
Page last updated on:


