Australia Data Center Storage Market Size and Share
Market Overview
| Study Period | 2020 - 2031 |
|---|---|
| Forecast Data Period | 2026 - 2031 |
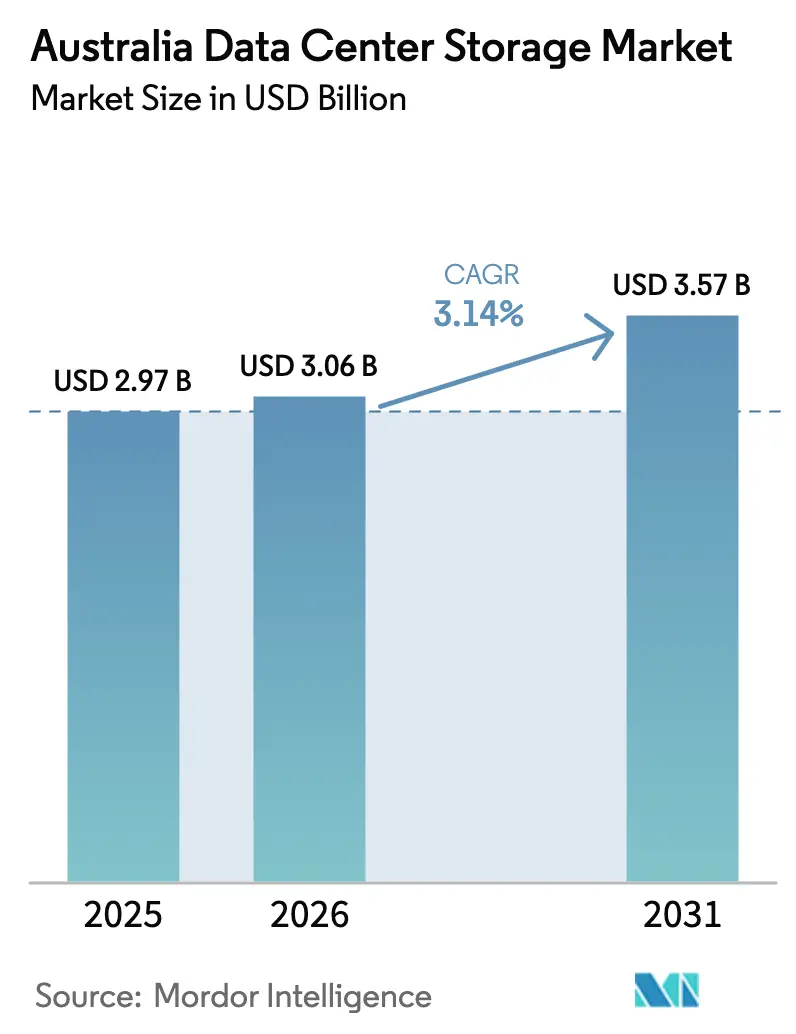
| Base Year Market Size (2025) | USD 2.97 Billion |
| Market Size (2026) | USD 3.06 Billion |
| Market Size (2031) | USD 3.57 Billion |
| Growth Rate (2026 - 2031) | 3.14% CAGR |
| Market Concentration | Medium |
Major Players *Disclaimer: Major Players sorted in no particular order Image © Mordor Intelligence. Reuse requires attribution under CC BY 4.0. | |
Australia Data Center Storage Market Analysis by Mordor Intelligence
The Australia data center storage market size was valued at USD 2.97 billion in 2025 and estimated to grow from USD 3.06 billion in 2026 to reach USD 3.57 billion by 2031, at a CAGR of 3.14% during the forecast period (2026-2031). Intensifying mandates for 5-star NABERS-rated facilities, equivalent to a power-usage-effectiveness threshold of 1.4, are compelling vendors to redesign arrays around high-density flash, advanced cooling, and granular telemetry that collectively lower energy draw and carbon liability. Sovereign-cloud investments by hyperscalers, multi-petabyte AI/ML workloads, and the rollout of 5G edge nodes are collectively moving storage closer to users, thereby raising total petabyte demand and spawning new purchase criteria focused on latency, local jurisdiction, and lifecycle emissions. Electricity-price volatility and a shortage of certified storage engineers temper deployment velocity, yet forward-looking procurement tied to mining automation and healthcare digitization continues to lift capital expenditure pipelines. Competitive dynamics remain fluid as global incumbents Dell Technologies, HPE, and NetApp defend share against flash-native and software-defined entrants positioning around AI performance, open APIs, and in-country operational control.
Key Report Takeaways
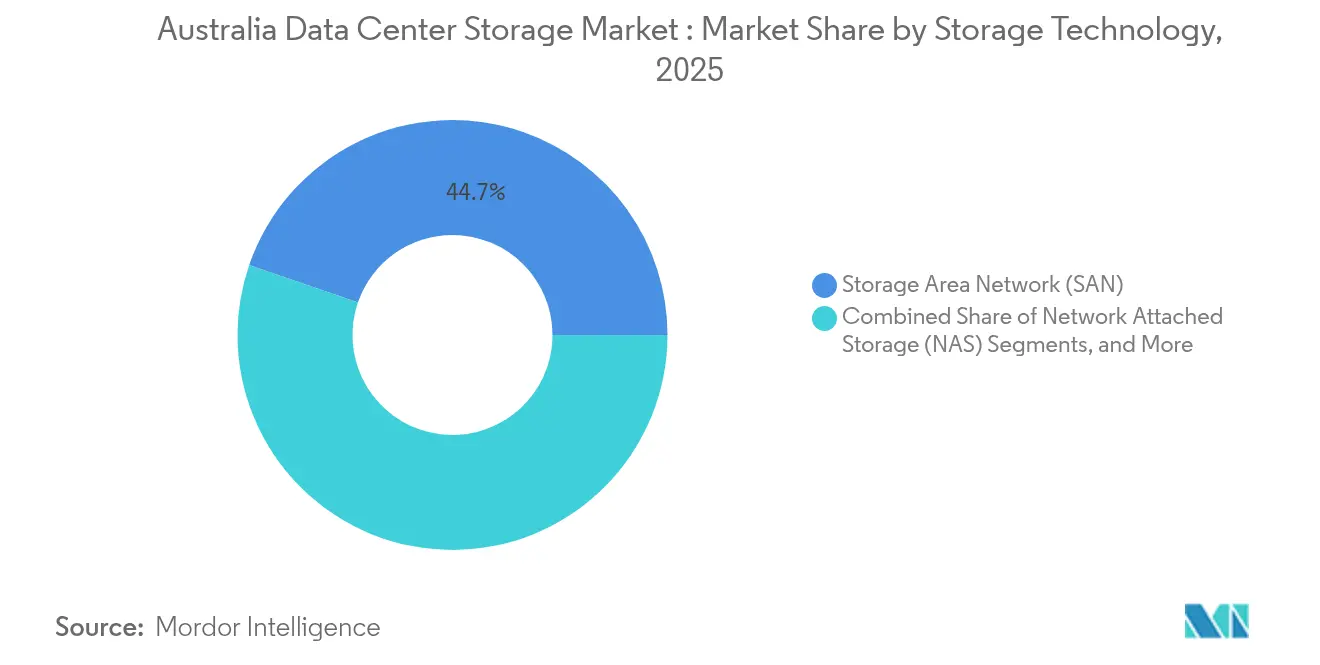
- By storage technology, Storage Area Networks led with 44.73% revenue share in 2025; Object and Tape Storage is projected to advance at a 5.14% CAGR through 2031.
- By storage type, traditional HDD arrays held 46.12% of the Australia data center storage market share in 2025, while all-flash arrays are expanding the Australia data center storage market size at a 6.56% CAGR.
- By data-center type, colocation facilities captured 65.55% share in 2025; hyperscalers and cloud service providers represent the fastest trajectory with a 7.22% CAGR to 2031.
- By end user, IT & telecommunications accounted for 36.84% of the Australia data center storage market size in 2025, whereas healthcare and life sciences is growing at 8.01% CAGR.
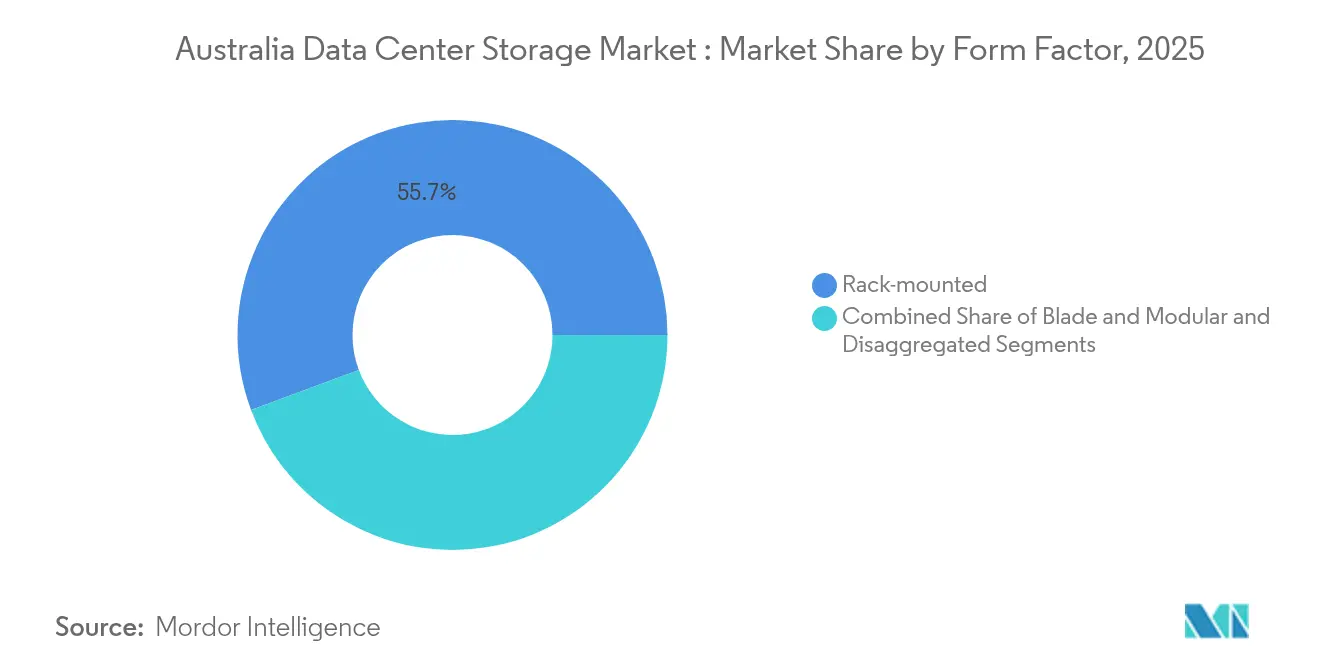
- By form factor, rack-mounted systems retained 55.68% share, and disaggregated/composable architectures are progressing at a 6.45% CAGR.
- By interface, SAS/SATA commanded 54.21% share in 2025; NVMe shipments are climbing at 6.98% CAGR as flash price parity approaches.
Note: Market size and forecast figures in this report are generated using Mordor Intelligence’s proprietary estimation framework, updated with the latest available data and insights as of 2026.
Australia Data Center Storage Market Trends and Insights
Drivers Impact Analysis*
| Driver | (~) % Impact on CAGR Forecast | Geographic Relevance | Impact Timeline |
|---|---|---|---|
| Accelerated rollout of 5G and edge-compute nodes | +0.8% | National, concentrated in Sydney, Melbourne, Brisbane | Medium term (2-4 years) |
| Sustained hyperscale cloud CAPEX in Australia | +0.7% | National, with focus on Sydney and Melbourne data center hubs | Long term (≥ 4 years) |
| Rapid adoption of AI/ML workloads demanding flash and NVMe | +0.6% | National, led by enterprise clusters in major cities | Short term (≤ 2 years) |
| Mandatory data-sovereignty and localisation rules | +0.5% | National, with government and financial services emphasis | Medium term (2-4 years) |
| Growing demand for sovereign-secure backup of critical infra | +0.3% | National, concentrated in Canberra and state capitals | Long term (≥ 4 years) |
| Mining sector's move to autonomous ops driving rugged edge storage | +0.2% | Western Australia, Queensland, Northern Territory | Medium term (2-4 years) |
| Source: Mordor Intelligence | |||
Accelerated Rollout of 5G and Edge-Compute Nodes
Australia’s leading carriers have begun inserting distributed storage nodes inside 5G cloud-RAN clusters so latency-sensitive traffic can be processed locally rather than backhauled to metro core sites[1] Ericsson newsroom, “Telstra Deploys Cloud RAN Across 5G Network,” ericsson.comTelstra’s commercial deployment of Ericsson Cloud RAN yields 3× capacity uplift and 60% lower power draw, which in turn elevates storage requirements for rugged, high-IOPS arrays at tens of micro-edge locations per city. Applications spanning real-time video analytics, VR training, and connected-car telemetry trigger sub-10-millisecond latency thresholds that disk architectures cannot meet, so operators are standardizing on NVMe flash sleds with QSFP28 100 Gbps links. Each additional megawatt of edge compute built between 2025-2030 is expected to pull 2-4 PB of adjacent storage, translating to a USD 200–300 million annual addressable pool for vendors able to ship small-footprint, field-serviceable systems.
Sustained Hyperscale Cloud CAPEX in Australia
Amazon’s USD 2 billion top-secret‐cloud program for government workloads, Blackstone’s AUD 24 billion acquisition of AirTrunk, and NEXTDC’s multi-site expansion pipelines cement a decade-long build queue that underpins volume demand for tier-1 storage. Cloud operators face compulsory residency clauses under the Security of Critical Infrastructure Act 2018, forcing them to co-locate object stores, backup vaults, and compliance logs within sovereign borders. Capacity-planning heuristics show that every incremental megawatt of white-space built by hyperscalers drags between 3-5 PB of total storage across primary and secondary tiers, a multiplier that lifts total volumes even as price per terabyte declines. Suppliers with proven delivery records in metro Sydney and Melbourne and energy-efficient all-flash designs are best positioned to win refresh cycles scheduled for 2027-2028.
Rapid Adoption of AI/ML Workloads Demanding Flash and NVMe
Enterprise AI penetration reached 68% in 2024, led by financial-services and media studios executing high-IOPS training pipelines that saturate legacy SAN fabrics. Pure Storage’s six-petabyte all-flash grid at the University of Western Australia slashed research batch times by 70% and trimmed energy bills by 80%, creating a proof point that resonates with budget-constrained public institutions.[2]Pure Storage customer story, “University of Western Australia Accelerates Research with All-Flash,” purestorage.com Film-maker Kennedy Miller Mitchell processes 20 PB of generative-AI data on Dell PowerScale arrays to avoid frame-render bottlenecks, revealing a willingness to pay 20–30% premiums for tuned, GPU-adjacent storage computerweekly.com. Since AI model file sizes double roughly every 18 months, flash adoption is forecast to tilt the Australia data center storage market mix toward 35% all-flash by 2030, up from 22% in 2024.
Mandatory Data-Sovereignty and Localisation Rules
The Digital Transformation Agency has certified only three providers—Australian Data Centres, Canberra Data Centres, and Macquarie Telecom—for sensitive government workloads, narrowing the addressable vendor set for Tier‐A opportunities.[3]Australian Government Department of Finance, “Data and Digital Government Strategy 2030,” finance.gov.auFinancial institutions are moving to encrypted hybrid frameworks in which regulated datasets stay onshore while less-sensitive analytics run in multiregion clouds. Commonwealth Bank’s five-year AWS deal and Westpac’s USD 500 million cloud program signal a pivot to sovereign zones within global hyperscalers, magnifying demand for vendor solutions that can demonstrate in-country key management, local incident-response personnel, and 5-star NABERS host facilities. Upcoming carbon-pricing tweaks further privilege low-wattage arrays, directly benefiting vendors offering QLC-flash shelves and intelligent power-cap management.
Restraints Impact Analysis*
| Restraint | (~)% Impact on CAGR Forecast | Geographic Relevance | Impact Timeline |
|---|---|---|---|
| High upfront capex for all-flash arrays | -0.4% | National, particularly affecting SME adoption | Short term (≤ 2 years) |
| Scarcity of skilled storage and SAN engineers | -0.3% | National, acute in regional areas | Medium term (2-4 years) |
| Escalating electricity tariffs and carbon-pricing | -0.2% | National, with state-level variations | Long term (≥ 4 years) |
| Delays in fibre back-haul expansion in regional Australia | -0.2% | Regional Australia, mining and agricultural areas | Medium term (2-4 years) |
| Source: Mordor Intelligence | |||
High Upfront Capex for All-Flash Arrays
While raw USD/GB for QLC flash approaches parity with 10 K RPM disks, users still face higher controller, licensing, and support charges that push three-year total-cost-of-ownership above hybrid alternatives. HPE’s benchmarking shows that breakeven requires 2:1 data-reduction ratios not always attainable for video, genomics, or encrypted backups. Financing frictions are pronounced among SMEs that contribute 40% of total demand yet operate on one-year budget cycles, forcing them to stagger upgrades and accept performance trade-offs. Government procurement cycles average 12-18 months, elongating vendor sales funnels and softening near-term unit growth.
Scarcity of Skilled Storage and SAN Engineers
IDC surveys indicate 76% of Australian firms struggle to hire certified storage talent, elongating implementation timelines by 20–30% and increasing reliance on vendor professional-services teams. Microsoft’s Data Center Academy expands the pipeline, but the two-year course lag defers relief until 2027. Remote mining and agriculture hubs face acute scarcity, limiting advanced deployments and creating white-space for plug-and-play edge systems requiring minimal onsite oversight. Vendors investing in intuitive UI, AIOps-driven troubleshooting, and managed-service wrappers gain relative advantage.
*Our forecasts treat driver/restraint impacts as directional, not additive. The impact forecasts reflect baseline growth, mix effects, and variable interactions.
Segment Analysis
By Storage Technology: SAN Dominance Faces Object-Storage Disruption
Storage Area Networks closed 2025 with 44.73% share of the Australia data center storage market, still favored for high-throughput banking ledgers and government ERP clusters. Object and Tape Storage, however, is growing at a 5.14% CAGR as compliance-heavy clients build AI-ready data lakes spanning medical images, seismic files, and video surveillance archives. Mining giants installing rugged edge clusters select object repositories because the model supports eventual consistency across multiple pit sites while eliminating rigid LUN provisioning, which diminishes field-engineer workload. Vendor webinars now spotlight S3-compatible gateways layered atop SAN backplanes, indicating convergence rather than outright cannibalization as buyers hedge architectural bets.
The Australia data center storage market size for object platforms tied to AI data lakes is forecast to surpass USD 612.7 million by 2031, reflecting the interplay of rising ML adoption and lower-cost cold-archive tiers. Meanwhile, SAN fabrics gradually embrace NVMe-over-Fibre-Channel to keep latency within single-digit microseconds, preserving relevance in tier-0. Suppliers able to overlay unified namespace across block, file, and object modalities are positioned to capture wallet share as customers rationalize multigeneration estates.


By Storage Type: Flash Arrays Gain Despite HDD Persistence
Traditional HDD arrays retained 46.12% share in 2025, anchored by hyperscale archival pools where cost per gigabyte trumps IOPS. Seagate’s roadmap to 100 TB HAMR disks reassures buyers that spinning media will stay viable for bulk reservoirs into 2031. Within performance tiers, all-flash arrays are compounding at 6.56% CAGR, outpacing overall Australia data center storage market growth as financial services, healthcare imaging, and CGI studios rush to guarantee millisecond response times even at concurrency spikes. The Australia data center storage market share for all-flash is projected to hit roughly 34.15% by 2031 under a scenario in which AI training, inference, and data-prepping tasks dominate I/O footprints.
Hybrid arrays bridge cost-performance gaps by placing cold data on high-capacity disks and hot datasets on QLC flash caches managed by predictive tiering. Vendors offering consumption-based billing and adaptive QoS tiers accelerate migration by flattening day-1 capex and aligning payments with usage bursts. Buyers expect further decline in raw flash price per terabyte once PCIe Gen5 and 3D NAND stacking mature in 2026, a milestone likely to unlock delayed migrations among mid-market cohorts.
By Data-Center Type: Colocation Leadership Challenged by Hyperscaler Growth
Colocation sites own 65.55% of deployed capacity, servicing enterprises that want off-prem resilience without full cloud re-platforming. Hyperscalers and cloud service providers, though presently smaller, are compounding at 7.22% CAGR as security-classified workloads relocate to sovereign zones inside metro Sydney and Melbourne. The Australia data center storage market size tied to hyperscaler vaults is poised to top USD 1.45 billion by 2031, contingent on sustained regulatory clarity and power-grid expansion.
Edge and enterprise on-prem micro-data-centers serve latency-sensitive industrial-IoT and autonomous fleet workloads. Mining operators in Pilbara deploy containerized sites with rugged flash for autonomous trucks, prioritizing ingress/egress bandwidth and vibration tolerance over sheer density. Colocation firms such as NEXTDC now bundle cross-connect fabrics that tunnel directly into AWS, Azure, and Google sovereign regions, allowing tenants to maintain single-digit latency while meeting residency clauses.
By End User: Healthcare Acceleration Outpaces Traditional Leaders
IT & telecommunications led with 36.84% share as telcos refresh SAN cores to cope with 5G traffic growth. Healthcare & life sciences owns a smaller base but is expanding at 8.01% CAGR, the fastest among verticals, driven by the My Health Record build-out and AI-assisted imaging. Lumus Imaging’s NetApp deployment enables 10× faster scans and USD 5-10 million annual savings, demonstrating ROI for capital committees cio.com. Banks maintain steady upgrade cadence to keep pace with AML rule changes and instant-payment platforms. Government agencies focus on compliance with Security of Critical Infrastructure Act, awarding long-term master contracts to certified sovereign suppliers.
Media & entertainment and manufacturing post mid-single-digit CAGRs as CGI renders, Industry 4.0 telemetry, and quality-inspection videos enlarge unstructured datasets. Cross-industry interest in generative-AI processing further flattens demand cycles, pulling forward refreshes tied to GPU cluster rollouts.
By Form Factor: Rack-Mounted Stability Meets Composable Innovation
Rack-mounted designs still account for 55.68% share due to entrenched datacenter floor-tile layouts and a deep pool of commodity component vendors. Disaggregated and composable architectures, where compute and storage resources are declaratively bound at runtime, are growing at 6.45% CAGR. Hitachi Vantara’s Virtual Storage Platform One showcases an all-QLC drawer capable of delivering per-I/O telemetry to an AIOps fabric, slashing wasted capacity and lowering wall-plug draw by 33% year-over-year. Composable systems resonate with hyperscalers seeking to raise fleet-wide utilization and with AI labs requiring frequent re-mix of CPU, GPU, and NVMe pools for varied workload patterns.
Blade and modular units target high-density or edge deployments where rack depth and chilled-water loops are scarce. Vendors that integrate advanced zoning and zero-trust microsegmentation at the chassis level unlock premium pricing within defense and critical-infrastructure bids.
By Interface: SAS/SATA Incumbency Faces NVMe Acceleration
SAS/SATA interfaces dominate at 54.21% share because enterprise tooling, multipathing stacks, and supply chains remain tuned to them. Yet NVMe volumes are climbing at 6.98% CAGR, capturing AI inference tiers, Kafka log-processing clusters, and space-constrained micro-DC-in-a-box deployments. Western Digital’s 64 TB eSSD and PCIe Gen5 roadmap underscores the throughput trajectory, mapping to host bus rates surpassing 14 GB/s for sequential reads. Fibre Channel and iSCSI maintain relevance in regulated sectors but add NVMe-over-FC and RDMA extensions to extend asset life.
Latency benefits translate directly into model-training cycle time reductions; Australian AI practitioners report 18-25% run-time savings after switching to NVMe over older SAS appliances. Pricing parity is expected within two years for mid-capacity QLC drives, at which point Australia data center storage market buyers are predicted to trigger broad interface refresh projects.
Geography Analysis
Sydney and Melbourne together hold roughly 69.85% of national installed megawatts and storage petabytes. Sydney, the Asia-Pacific region’s third-largest data-center cluster, had 768 MW live with a vacancy of 9% at the end of 2024, supported by 987 MW under construction and a future-pipeline potential of more than 2 GW. Demand concentration stems from superior fibre density, subsea cable landings, and the presence of in-country cloud on-ramps. Melbourne ranks eighth regionally and leverages renewable-energy incentives and cool ambient temperatures for free-air cooling windows exceeding 1,800 hours annually, contributing to lower effective-kilowatt rates for storage arrays austrade.gov.au. The Australia data center storage market size inside Victoria is projected to reach USD 842.6 million by 2031 if current capex pipelines hold.
Brisbane and Perth form emerging second-tier nodes. Queensland’s government-sponsored 400 MWh battery and 500 MW solar-plus-storage build unlocks low-carbon power purchase agreements attractive to data-center operators. Western Australia’s mining automation clusters demand edge nodes that can operate amid dust, heat, and limited grid reliability, leading to ruggedized direct-attached NVMe deployments cooled via sealed conduction plates rather than raised-floor air. These micro-sites usually operate below 200 kW yet require enterprise-grade reliability because AI engines control autonomous haul trucks worth USD 3 million apiece.
Canberra specialises in government and defence workloads, where the Digital Transformation Agency’s certification constraint narrows the supplier field. As a result, premium rates per kilowatt are sustainable, and higher tiers of redundancy (N+2 or 2N) are standard. The Australia data center storage market share attributable to Canberra is small in volume but lucrative in margin terms.
Regional Australia faces fibre-backhaul delays; microwave and low-Earth-orbit satellite links partially mitigate gaps but do not replace fibre’s economics for bulk data replication. Government co-funded dark-fibre trunk projects slated for 2026-2028 may unlock latent demand for distributed replicas of object stores supporting agriculture-IoT, environmental monitoring, and smart-grid analytics.
Competitive Landscape
Competitive intensity is moderate, with the top five vendors controlling an estimated 55–60% of petabyte shipments. Dell Technologies leverages its AI Focus Partner Network to embed VxRail and PowerStore nodes adjacent to GPU racks, reporting 20% YoY PowerStore revenue growth in Australia after pivoting to partner-first execution . NetApp exploits its Google Distributed Cloud alliance for regulated industries, providing ONTAP data-fabric consistency between on-prem arrays and sovereign regions, thus addressing hybrid compliance hurdles. HPE emphasizes GreenLake consumption billing to defray capex objections, bundling Aruba edge-switching for 5G micro-front nodes.
Hitachi Vantara posts 27% QoQ storage growth following the Virtual Storage Platform One launch, aided by commercial linkages with NVIDIA for DGX clusters. Start-ups targeting the Australia data center storage market include software-defined pioneers offering erasure-coded object pools tunable for 14 nines of durability at half the floor-space of triple-replica SAN clouds. Channel partners report rising RFP weightings assigned to energy performance, with buyers awarding up to 10% score uplift for evidence of under-1.5 PUE deployments and low-carbon supply-chain disclosures. Edge-oriented players focusing on roll-in/roll-out rugged flash with onboard AIOps are carving niches in mining and defense.
Overall, price/performance differentiation alone is insufficient; providers must demonstrate in-country support desks, crypto-key escrow inside Australian jurisdiction, and transparent emissions footprints to satisfy evolving procurement rubrics. White-space remains in regional managed-services models that bundle connectivity, managed backup, and skills outsourcing for mid-market enterprises unable to hire scarce SAN engineers.
Australia Data Center Storage Industry Leaders
Dell Technologies Inc.
Hewlett Packard Enterprise Company
NetApp, Inc.
Pure Storage, Inc.
Huawei Technologies Co., Ltd.
- *Disclaimer: Major Players sorted in no particular order

Recent Industry Developments
- January 2025: NextDC plans an 80 MW Melbourne facility, deepening regional capacity and storage demand
- February 2025: NetApp broadens Google Cloud collaboration to deliver sovereign compliant storage for regulated sectors.
- February 2025: Goodman Group raises AUD 2.54 billion to fund data-center builds that now represent 40% of its USD 13 billion pipeline.
- March 2025: Australian Government publishes the Data and Digital Government Strategy outlining 2030 digital-service objectives
- May 2025: Seagate unveils 100 TB disk roadmap, underscoring continued investment in high-capacity drives


Research Methodology Framework and Report Scope
Market Definitions and Key Coverage
Our study defines the Australia data-center storage market as the value of new on-premise or colocation-deployed disk, flash, and hybrid arrays, plus storage-focused converged and software-defined nodes that are installed in enterprise, hyperscale cloud, edge, and wholesale facilities located within Australia. Capacities are captured at factory gate and converted to USD at the prevailing annual average rate.
Scope Exclusion: External drive sales for consumer PCs and removable archival media are out of scope.
Segmentation Overview
- By Storage Technology
- Network Attached Storage (NAS)
- Storage Area Network (SAN)
- Direct Attached Storage (DAS)
- Object and Tape Storage
- By Storage Type
- Traditional HDD Arrays
- All-Flash Arrays (AFA)
- Hybrid Storage
- By Data Center Type
- Colocation Facilities
- Hyperscalers/Cloud Service Providers
- Enterprise and Edge
- By End User
- IT and Telecommunication
- BFSI
- Government and Public Sector
- Media and Entertainment
- Healthcare and Life Sciences
- Manufacturing
- By Form Factor
- Rack-mounted
- Blade and Modular
- Disaggregated / Composable
- By Interface
- SAS / SATA
- NVMe
- Fibre Channel and iSCSI
Detailed Research Methodology and Data Validation
Primary Research
Mordor analysts interview data-center operators, procurement heads at banks, telecom carriers, and defense agencies across Sydney, Melbourne, Brisbane, and Perth. These conversations validate power-to-capacity ratios, refresh cycles, and typical all-flash premiums that secondary material cannot quantify, and they flag edge-case demand from AI pilots in remote mining sites.
Desk Research
Our team first gathers baseline shipment and pricing clues from open data issued by the Australian Bureau of Statistics, the Australian Communications and Media Authority, and customs import records, which reveal quarterly petabyte inflows. We then cross-check utilization signals in green-energy filings, state planning approvals, and telecommunications association white papers to understand facility buildouts.
Patent analytics from Questel, company 10-Ks, investor decks, and Factiva news feeds help us map technology transitions such as NVMe adoption and flash price erosion, while IMTMA and Asia Metal provide regional component cost trends. This list is illustrative; many additional public and subscription sources underpin our desk work.
Market-Sizing & Forecasting
A top-down construct starts with modeled rack additions derived from new build MW announcements, which are then multiplied by verified storage-per-rack norms by facility class. Select bottom-up checks, supplier roll-ups, and sampled ASP x volume quotes tighten totals. Key model inputs include average rack density, flash-to-disk mix shift, hyperscaler share of new halls, dollar per GB trajectories, regulatory data sovereignty spending, and energy cost curves. Multivariate regression aligns these drivers with historical uptake, and a scenario band refines the 2025-2030 outlook.
Data Validation & Update Cycle
Outputs pass anomaly scans against shipment databases, analyst peer review, and a senior sign-off. Models refresh annually; mid-cycle updates trigger when exchange swings, policy shifts, or greater than 5 MW facility announcements materially move the baseline.
Why Mordor's Australia Data Center Storage Baseline Commands Confidence
Published figures often diverge because firms pick different hardware boundaries, currency treatments, and refresh cadences. Our disciplined scope, driver set, and yearly rebuild mean buyers see a number anchored to observable racks and realistic ASPs.
Core gap drivers include some publishers bundling software and services, others limiting coverage to hyperscale builds, and a few locking exchange rates at survey start rather than annual averages, which inflates totals when the AUD weakens.
Benchmark comparison
| Market Size | Anonymized source | Primary gap driver |
|---|---|---|
| USD 2.97 B (2025) | Mordor Intelligence | - |
| USD 2.36 B (2024) | Regional Consultancy A | Excludes edge micro-sites and NVMe price uplift |
| USD 110.52 B (2024) | Global Consultancy B | Bundles servers, networking gear, and managed services into "storage" |
These contrasts show that Mordor's bottom-checked, hardware-only lens offers a balanced, reproducible baseline that decision-makers can trace back to clear variables.


Key Questions Answered in the Report
What is the current value of the Australia data center storage market?
The Australia data center storage market is valued at USD 3.06 billion in 2026 and is projected to rise to USD 3.57 billion by 2031.
Which storage technology leads in market share?
Storage Area Networks lead with 44.73% share in 2025, reflecting their continued role in mission-critical, high-performance workloads.
Why is NVMe adoption accelerating?
NVMe’s low-latency protocol aligns with AI/ML and real-time analytics workloads, pushing its shipment CAGR to 6.98% as flash prices fall toward parity with enterprise disks.
Which end-user vertical is growing the fastest?
Healthcare & life sciences is the fastest-growing vertical, expanding at an 8.01% CAGR due to digital health records, imaging, and AI-driven diagnostics.
How do government data-sovereignty rules influence storage buying?
Regulations mandate that sensitive and critical datasets remain within Australian jurisdiction, steering enterprises toward local data-center footprints and vendors able to prove sovereign control and NABERS-rated efficiency.
What is the main barrier to wider flash adoption among SMEs?
Upfront capital expenditure—including controller redundancy and software licensing—remains prohibitive despite improving $/GB economics, delaying flash migrations for mid-market firms.
Page last updated on:


