Australia Data Center Construction Market Size and Share
Market Overview
| Study Period | 2020 - 2031 |
|---|---|
| Forecast Data Period | 2026 - 2031 |
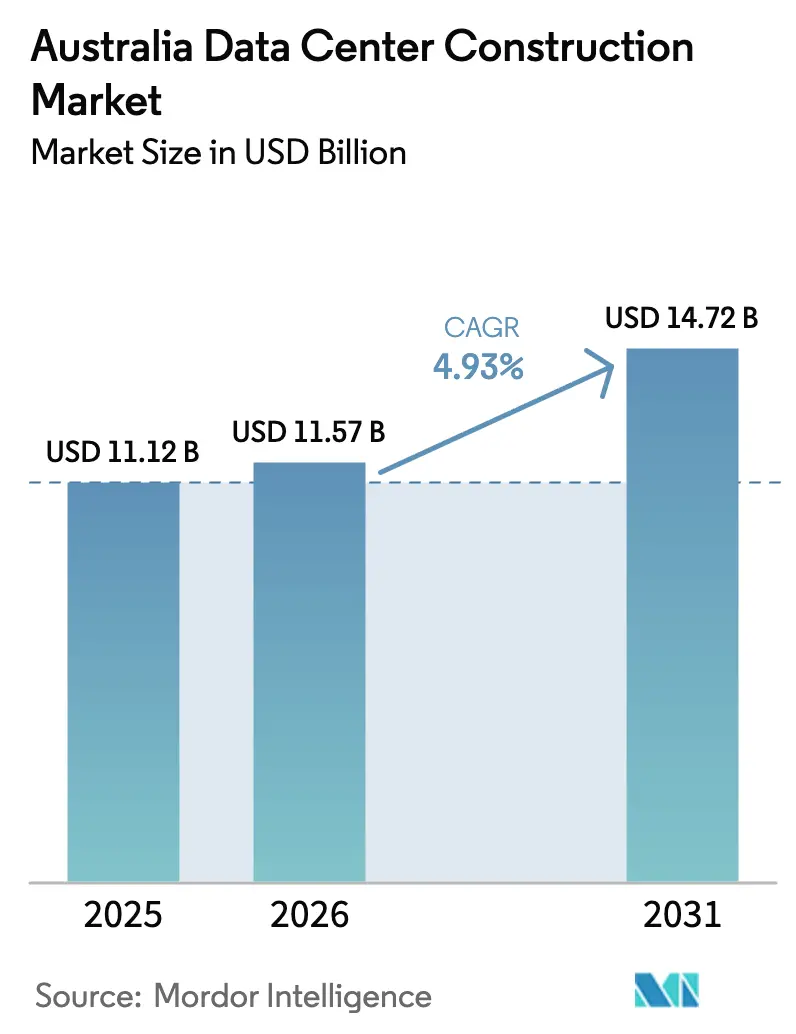
| Base Year Market Size (2025) | USD 11.12 Billion |
| Market Size (2026) | USD 11.57 Billion |
| Market Size (2031) | USD 14.72 Billion |
| Growth Rate (2026 - 2031) | 4.93% CAGR |
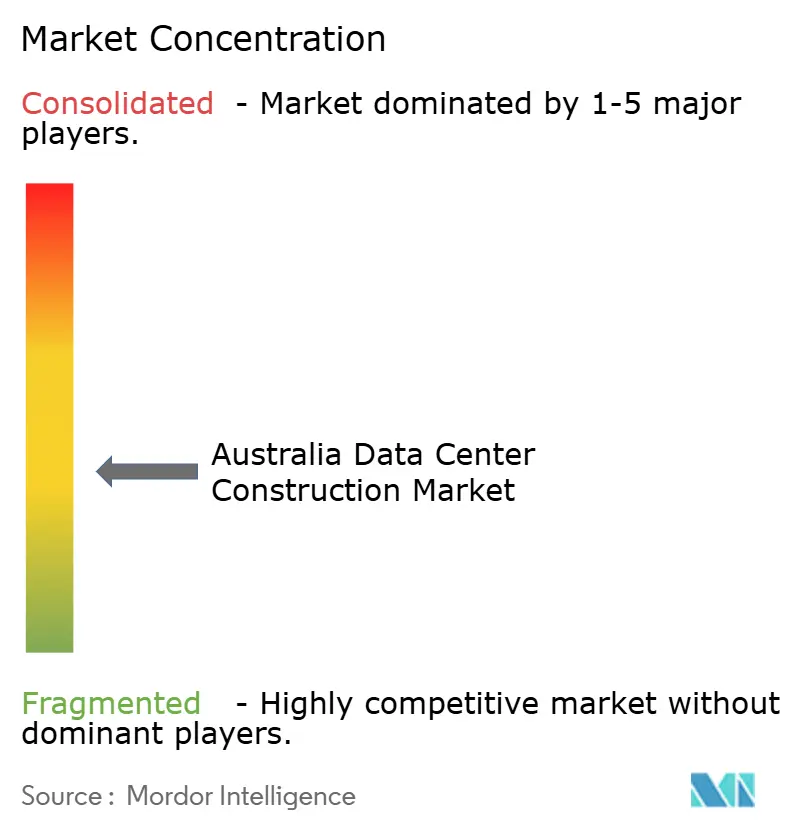
| Market Concentration | Medium |
Major Players *Disclaimer: Major Players sorted in no particular order Image © Mordor Intelligence. Reuse requires attribution under CC BY 4.0. | |
Australia Data Center Construction Market Analysis by Mordor Intelligence
The Australia data center construction market size is projected to be USD 11.12 billion in 2025, USD 11.57 billion in 2026, and reach USD 14.72 billion by 2031, growing at a CAGR of 4.93% from 2026 to 2031. The measured expansion is underpinned by hyperscale capital commitments that tilt spending toward fewer, very large campuses, reinforcing supply-side discipline even as demand for AI-ready capacity accelerates. Government-backed renewable-energy incentives, powered-shell design adoption, and rising rack densities collectively reshape project economics, pushing turnkey contractors to integrate liquid-cooling expertise and modular builds. Competitive strategies now hinge on locking in long-lead electrical equipment, securing grid allocations ahead of rivals, and offering tenants sub-18-month delivery windows. These factors allow well-capitalized developers to preserve margins despite double-digit construction-cost inflation and tightening zoning rules in Sydney and Melbourne. The Australia data center construction market, therefore, evolves from volume-driven enterprise builds to a capital-intensive, hyperscale-first landscape that prizes speed-to-market and energy efficiency.
Key Report Takeaways
- By tier type, tier 3 captured 56.84% of the Australia data center construction market share in 2025, while tier 4 facilities are forecast to post a 5.46% CAGR through 2031.
- By size, hyperscale campuses commanded 60.13% of the Australia data center construction market size in 2025 and are projected to grow at a 5.78% CAGR to 2031.
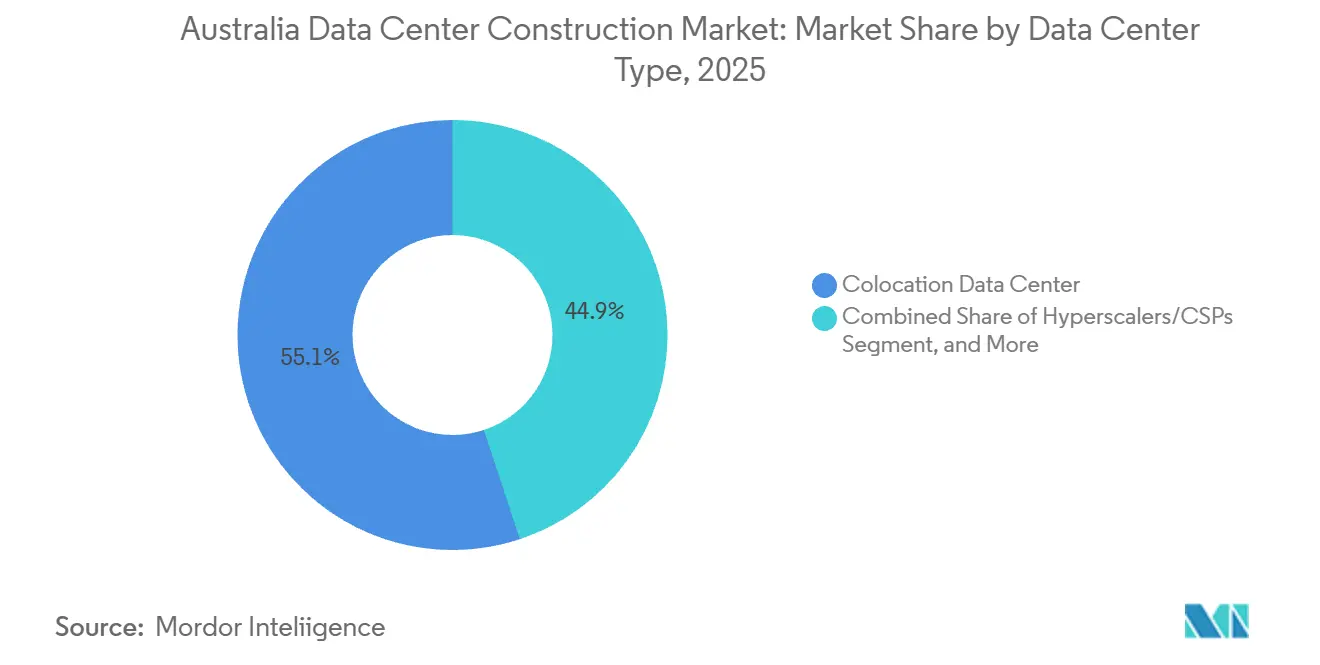
- By data center type, colocation providers held 55.08% of the Australia data center construction market share in 2025; hyperscalers and cloud providers will expand at a 5.82% CAGR during the same period.
- By infrastructure, electrical infrastructure accounted for 39.82% of market share in 2025, while mechanical systems are expected to record a 6.12% CAGR between 2026 and 2031, outpacing other spend categories.
Note: Market size and forecast figures in this report are generated using Mordor Intelligence’s proprietary estimation framework, updated with the latest available data and insights as of January 2026.
Australia Data Center Construction Market Trends and Insights
Drivers Impact Analysis*
| Driver | (~) % Impact on CAGR Forecast | Geographic Relevance | Impact Timeline |
|---|---|---|---|
| Surge in Hyperscale and Cloud Provider Investment | +1.8% | Global, concentrated in Sydney and Melbourne | Medium term (2-4 years) |
| Low-Latency Edge Demand in Sydney and Melbourne | +0.9% | Sydney, Melbourne, with spillover to Brisbane | Short term (≤ 2 years) |
| Government Renewable-Energy Incentives for Green DCs | +0.7% | National, strongest in Victoria and Queensland | Long term (≥ 4 years) |
| AI/HPC Rack-Density Boom Raising New-Build Demand | +1.2% | Global, early adoption in major metros | Medium term (2-4 years) |
| Powered-Shell Leasing Model Shortens Time-To-Market | +0.4% | National, emerging in secondary markets | Short term (≤ 2 years) |
| Repurposing Retired Coal-Plant Sites into DC Campuses | +0.3% | New South Wales, Victoria, Queensland | Long term (≥ 4 years) |
| Source: Mordor Intelligence | |||
Surge in Hyperscale and Cloud Provider Investment
AWS committed AUD 20 billion (USD 13.2 billion) through 2029 for new Sydney and Melbourne availability zones, setting a precedent for multi-year, multi-region builds that absorb grid headroom before rivals can mobilize.[1]AWS to Invest AUD 20 Billion in Australia,” About Amazon, aboutamazon.com.auMicrosoft added a fourth Australian cloud region in 2025 and earmarked capacity increases to 150 MW by 2027, reinforcing the winner-takes-most dynamic. Developers that pre-secure easements and substation upgrades effectively ring-fence metro markets for up to seven years. Colocation operators therefore pivot to powered-shell models, illustrated by Macquarie Data Centers’ 47 MW IC3 Super West project that allows tenant fit-outs during core construction.
AI/HPC Rack-Density Boom Raising New-Build Demand
Rack densities for NVIDIA H100 and AMD MI300 GPU clusters now exceed 100 kW, five times traditional enterprise loads, accelerating demand for chilled-water loops and direct-to-chip cooling. AirTrunk’s 354 MW MEL2 campus integrates rear-door heat exchangers and redundant cooling distribution units that legacy air-cooled halls cannot retrofit cost-effectively.[2]MEL2 Melbourne Campus Development,” AirTrunk, airtrunk.com Upgrading an existing 10 MW facility to liquid cooling costs roughly 60% of a greenfield build while yielding only half the usable density, driving hyperscalers toward purpose-built campuses.
Low-Latency Edge Demand in Sydney and Melbourne
Financial-services, gaming, and AR workloads require sub-5 ms round-trip times, prompting Telstra to deploy micro data centers in 15 retail sites across both cities in 2025.[3]Edge Computing Network Expansion,” Telstra, telstra.com.au Optus extended AWS Local Zones to Brisbane and Perth, lowering latency for regional users. Although individual builds are small at 2-5 MW, premium rents of AUD 300-400 (USD 210-280) per kW monthly create attractive unit economics that complement hyperscale campuses in outer suburbs.
Government Renewable-Energy Incentives for Green DCs
The Commonwealth’s Capacity Investment Scheme underwrites 32 GW of dispatchable renewables, trimming power-purchase costs for data centers willing to locate near renewable-energy zones. New South Wales’ Grid Enhancing Technologies grants further subsidize transmission upgrades for facilities tapping wind and solar farms. Opex savings of AUD 2-3 (USD 1.4-2.1) million annually for a 50 MW site enhance project IRRs, yet the 200-300 km distance from fiber hubs forces developers to weigh latency against energy cost.
Restraints Impact Analysis*
| Restraint | (~) % Impact on CAGR Forecast | Geographic Relevance | Impact Timeline |
|---|---|---|---|
| Land Scarcity and Zoning Limits in Tier-1 Metros | -1.1% | Sydney, Melbourne primary impact | Medium term (2-4 years) |
| Grid Connection Delays and Limited Power Availability | -0.8% | National, acute in established markets | Long term (≥ 4 years) |
| Shortage of Specialized Trades Inflates Build Costs | -0.6% | National, concentrated in major metros | Short term (≤ 2 years) |
| New Critical-Infrastructure Cyber Rules Escalate Capex | -0.4% | National, all critical infrastructure | Medium term (2-4 years) |
| Source: Mordor Intelligence | |||
Grid Connection Delays and Limited Power Availability
AEMO’s 2025 Integrated System Plan forecast congestion in Sydney’s western suburbs and Melbourne’s north until at least 2028, delaying connection approvals for 50 MW loads. TransGrid confirmed that 12 queued projects totaling 800 MW await transformer deliveries that will not materialize before 2027. Hyperscalers with balance-sheet heft sidestep the queue by financing dedicated spurs and take-or-pay generation, sidelining mid-tier players that cannot commit to 100 MW uplifts.
Land Scarcity and Zoning Limits in Tier-1 Metros
New South Wales capped individual data center parcels in Macquarie Park and Eastern Creek at 10 hectares to preserve industrial stock for manufacturing. Victoria’s Plan Melbourne policies restrict greenfield approvals, pushing developers toward brownfield conversions that add 6-12 months to timelines. Industrial land in western Sydney traded at AUD 600-800 (USD 420-560) per m² in 2025, a 60% increase over 2023, eroding returns for speculative builds.
*Our forecasts treat driver/restraint impacts as directional, not additive. The impact forecasts reflect baseline growth, mix effects, and variable interactions.
Segment Analysis
By Tier Type: Redundancy Premiums Drive Tier 4 Growth
In 2025, Tier 3 facilities dominated the Australia data center construction market, securing a 56.84% share. Meanwhile, Tier 4 facilities are projected to achieve a 5.46% CAGR from 2026 to 2031. Tier 4 capacity is forecast to expand as hyperscalers and financial institutions internalize the cost of downtime. The Australia data center construction market size for Tier 4 deployments will therefore rise faster than the broader market, while Tier 3 continues to dominate on an installed-base basis. NEXTDC’s M3 achieved Tier IV Gold certification in 2024, demonstrating dual utility feeds and N+1 cooling that meet CPS 230 operational resilience mandates. Enterprises willing to accept planned downtime remain in Tier 3, yet regulatory pressure from APRA nudges mission-critical workloads toward fully fault-tolerant designs.
Pricing differentials narrow as liquid-cooling costs compress; a 15-minute outage in a Tier 3 hall could cost a fintech platform up to AUD 1 million (USD 0.7 million) in lost transactions, negating rent savings. Consequently, Tier 3 operators face a strategic choice: retrofit to Tier 4 at roughly USD 20-30 million per 10 MW module or cede high-margin demand to rivals. Over 60% of AirTrunk’s 2025 leasing inquiries already specified Tier IV requirements, signaling a structural upgrade cycle.


By Data Center Size: Hyperscale Economies Marginalize Mid-Tier Builds
Hyperscale campuses captured 60.13% of 2025 revenue and will log a 5.78% CAGR to 2031, reinforcing the Australia data center construction market’s flight to very large projects. CDC’s 504 MW Marsden Park investment achieves USD 4,000 per kW build costs versus USD 5,300 per kW for 20 MW sites, demonstrating scale economies. Medium builds remain viable in Brisbane, Perth, and Adelaide, but lack access to 330 kV transmission and therefore top out at 10-20 MW.
Liquid-cooling-first designs deepen hyperscale moats, as greenfield campuses integrate chilled-water loops into the structural slab and 480-V distribution to minimize copper losses. Retrofitting medium sites trims usable white space by up to 20% and extends upgrade timelines to two years, further tilting economics toward large-scale new builds.
By Data Center Type: Hyperscalers Internalize Capacity
Hyperscalers and cloud providers are projected to grow at 5.82% annually, gradually eroding colocation’s 55.08% share of the Australia data center construction market. AWS’ AUD 20 billion (USD 13.2 billion) Australian investment favors owner-operated facilities, dropping unit cost from AUD 200-250 (USD 140-175) per kW in retail colo to AUD 120-150 (USD 84-105) in self-build scenarios. Microsoft purchased a 15-hectare Melbourne parcel for a 150 MW campus, reinforcing the shift to vertical integration.
Colocation specialists pivot toward hybrid-cloud enterprises needing low-latency interconnection. NEXTDC’s Cloud Connect fabric links more than 30 on-ramps, delivering sub-5 ms access to public clouds for regulated workloads. Edge and enterprise builds remain modest, as few corporate balance sheets can stomach USD 50-100 million for a 5-10 MW self-build.
By Infrastructure: Mechanical Spend Surges on Cooling Upgrades
Electrical infrastructure accounted for 39.82% of market share in 2025, whereas mechanical systems will register a 6.12% CAGR between 2026 and 2031, surpassing electrical growth yet remaining second in absolute spend. Liquid-cooling retrofits comprise up to half of mechanical capex for new hyperscale halls, with AirTrunk allocating AUD 800 million (USD 560 million) of its AUD 5 billion (USD 3.5 billion) MEL2 budget to chiller capacity and chilled-water piping. Standardized electrical designs moderate price escalation, but generator and transformer lead times still stretch beyond 18 months.
The services sub-segment grows in lockstep with mechanical complexity. Schneider Electric noted that 70% of its 2025 Australian projects involved liquid-cooling design services. Prefabricated power rooms and modular white-space kits reduce schedule risk by up to 30%, a compelling proposition for hyperscalers who demand occupied space within 12-18 months.
Geography Analysis
Sydney and Melbourne collectively captured nearly three-quarters of 2025 spend, cementing their status as the gravitational centers of the Australia data center construction market. Western Sydney suburbs such as Macquarie Park and Eastern Creek benefit from existing 330 kV lines and proximity to the Sydney-Singapore cable system, enabling hyperscale builds to tap multi-terabit connectivity. Melbourne’s northern corridor, from Laverton to Derrimut, offers sub-10 ms latency to the CBD, attracting colocation providers that monetize premium interconnect demand.
Second-tier metros, namely Brisbane, Perth, and Adelaide, are expected to grow at roughly 6-7% CAGR. NEXTDC’s B2 Brisbane expansion to 22 MW targets resources and agriculture clients, while Perth hosts edge nodes serving mining analytics workloads. Adelaide’s sovereign requirements sustain demand for Tier 3-plus facilities cleared by the Australian Signals Directorate.
The Australian Capital Territory remains a niche sovereign enclave, with federal workloads requiring strategic-level security, whereas Tasmania’s cool climate and hydroelectric surplus position it for future AI training campuses if Bass Strait transmission upgrades proceed. Latency constraints limit Tasmania to batch-processing, yet 500-MW-plus potential loads could materialize once grid interconnects improve.
Competitive Landscape
The Australia data center construction market exhibits moderate fragmentation. NEXTDC leverages public-equity access to fund speculative builds, launching a 550 MW S7 Sydney campus in 2025 without anchor tenants. AirTrunk, backed by Macquarie Asset Management, pre-builds powered shells that compress tenant ramp-up cycles, while CDC specializes in wholesale halls of 10-50 MW for single tenants unable to self-build.
Private equity interest intensified after Partners Group’s 2024 purchase of GreenSquareDC and pledge of AUD 1.2 billion (USD 0.84 billion) for expansion. Telstra and Optus dominate micro-edge deployments by leveraging telecom real estate. Equinix and Global Switch focus on interconnection-rich sites inside Sydney and Melbourne, extracting revenue from cross-connects rather than raw capacity. Competitive weapons revolve around construction speed, renewable energy sourcing, and compliance posture, especially in light of the Security of Critical Infrastructure Act’s risk-management mandates.
Technology adoption patterns reveal that operators embracing modular construction and prefabricated mechanical systems trim build schedules by up to 30%, a benefit documented across Schneider Electric’s 2025 Australian project portfolio. Compliance with ISO 27001 information security and ISO 50001 energy management standards is now table stakes for winning enterprise and government tenants, especially after the Security of Critical Infrastructure Act imposed mandatory risk-management programs on facilities above 25 MW. Liquid cooling expertise adds another edge, as Vertiv reports that hyperscale campuses integrating chilled-water rear-door heat exchangers can run 150 kW racks without efficiency penalties. Supply-chain resilience has also become a differentiator, with developers that lock in transformer and generator orders 18 months ahead shielding project timelines from global equipment shortages.
Australia Data Center Construction Industry Leaders
NEXTDC Ltd
AirTrunk Operating Pty Ltd
FDC Construction and Fitout
Multiplex Constructions Pty Ltd
CPB Contractors Pty Ltd
- *Disclaimer: Major Players sorted in no particular order

Recent Industry Developments
- July 2025: Microsoft Azure opened its fourth Australian region in Melbourne, adding 48 MW of initial capacity and outlining a pathway to 150 MW as enterprise cloud demand climbs.
- March 2025: Telstra expanded its edge-computing network in Sydney and Melbourne, installing micro data centers in 15 retail locations to enable sub-5-millisecond latency for AR, gaming, and IoT workloads.
- January 2025: NEXTDC commenced construction on its 550 MW S7 Sydney campus, initiating a multi-phase build program scheduled to deliver hyperscale and enterprise capacity through 2029.
- December 2024: AirTrunk secured approval for its 354 MW MEL2 Melbourne campus, with initial power-on slated for mid-2026.


Research Methodology Framework and Report Scope
Market Definitions and Key Coverage
Our study defines the Australia data center construction market as every green-field or brown-field project that delivers the physical shell plus its critical electrical, mechanical, and general-build packages required for a facility to reach Tier I-IV certification and enter commissioning. This spans colocation, self-built hyperscaler campuses, enterprise builds, and edge sites larger than 250 kW IT load.
Scope exclusion: Fit-out refurbishments that only replace IT racks, software, or cabling without structural or utilities work are outside the modeled spend.
Segmentation Overview
- By Tier Type
- Tier 1 and 2
- Tier 3
- Tier 4
- By Data Center Size
- Small
- Medium
- Large
- Hyperscale
- By Data Center Type
- Colocation Data Center
- Hyperscalers/Cloud Service Provider (CSPs)
- Enterprise and Edge Data Center
- By Infrastructure
- Electrical Infrastructure
- Power Distribution Solution
- Power Backup Solutions
- Mechanical Infrastructure
- Cooling Systems
- Racks and Cabinets
- Servers and Storage
- Other Mechanical Infrastructure
- General Construction
- Services - Design and Consulting, Integration, Support and Maintenance
- Electrical Infrastructure
Detailed Research Methodology and Data Validation
Primary Research
Mordor analysts interviewed construction contractors, specialist MEP engineers, utility planners, and data-center executives across Sydney, Melbourne, Brisbane, and Perth. Conversations tested secondary findings, clarified run-rate cost per megawatt, and captured sentiment on grid-connection delays and edge site economics, which sharpened the model assumptions.
Desk Research
We began with public datasets such as the Australian Bureau of Statistics building approvals, the Clean Energy Regulator's renewable-power registry, NABERS energy-rating disclosures, and Uptime Institute Tier filings, which together sketch the national project pipeline and prevailing design standards. Trade association portals, such as Communications Alliance for submarine cable updates and Master Builders Australia for labor-cost indices, helped us price labor and specialty materials. Company filings on D&B Hoovers, press archives on Dow Jones Factiva, and state land-registry documents were then used to cross-check site investment values, capacity, and delivery schedules. These illustrative sources are not exhaustive; many additional references were consulted for verification and clarification.
Market-Sizing & Forecasting
A top-down reconstruction of national construction expenditure, rooted in project CAPEX disclosures, historical build-rate (MW added each year), and average cost per MW, set the first cut. Results were stress-tested with selective bottom-up checks; for example, rolling up six leading contractor revenues and multiplying sampled average selling prices by white-space volume. Key variables inside the model include 1) hyperscale investment pipeline announced through 2030, 2) rack-density trends driving electrical and cooling intensity, 3) grid-connection lead times, 4) state construction-cost index inflation, and 5) enforcement of data-sovereignty policy that shapes edge demand. A multivariate regression with scenario analysis projects the impact of these drivers on annual spend; gaps created by incomplete contractor data were bridged using three-year moving averages validated during expert calls.
Data Validation & Update Cycle
Every draft output passes two analyst reviews where variance against historical spend, MW additions, and NABERS upgrade rates is flagged. Where mismatches exceed ten percent, stakeholders from the original interviews are re-contacted. Reports refresh once a year, and we push interim updates when material events, such as large campus announcements, grid reforms, or cost spikes, arise.
Why Our Australia Data Center Construction Baseline Stands Up to Scrutiny
Published estimates often diverge because firms track different spend buckets, convert currencies on varying dates, or freeze models for years.
Key gap drivers in rival studies include limiting scope to shell-only costs, omitting developer contingency budgets, or using global cost curves unsuited to Australia's labor premiums and renewable-energy mandates.
Benchmark comparison
| Market Size | Anonymized source | Primary gap driver |
|---|---|---|
| USD 11.12 bn (2025) | Mordor Intelligence | - |
| USD 6.81 bn (2024) | Regional Consultancy A | Tracks announced CAPEX only and excludes mechanical retrofit services |
| USD 3.10 bn (2023) | Global Consultancy B | Uses partial Tier III sample and applies generic APAC cost multipliers |
These comparisons show that when scope, pricing granularity, and refresh cadence are fully aligned, as in Mordor's model, the resulting baseline remains the most transparent and repeatable reference for decision-makers.


Key Questions Answered in the Report
What is the projected value of the Australia data center construction market by 2031?
It is expected to reach USD 14.72 billion, expanding at a 4.93% CAGR.
Which tier segment is set to grow the fastest in upcoming years?
Tier 4 builds are forecast to grow at a 5.46% CAGR as hyperscalers seek fault-tolerant uptime.
Why are hyperscale projects concentrating in Sydney and Melbourne?
The two metros offer fiber density, subsea cable routes, and 330 kV transmission access, creating network and power synergies that justify large campuses.
How are renewable-energy incentives influencing site selection?
Federal and state programs lower power costs for facilities co-located with wind or solar farms, encouraging developers to evaluate sites outside traditional metro cores.
What strategic shift are colocation providers making to stay competitive?
Many are adopting powered-shell models that allow hyperscale tenants to install equipment in parallel with construction, trimming delivery times to 12 - 18 months.
How does liquid cooling affect construction budgets?
Liquid-cooling infrastructure can account for up to 50% of mechanical capex in new hyperscale halls but is essential for supporting 100 kW-plus GPU racks efficiently.
Page last updated on:


