Australia Data Center Networking Market Size and Share
Market Overview
| Study Period | 2020 - 2031 |
|---|---|
| Forecast Data Period | 2026 - 2031 |
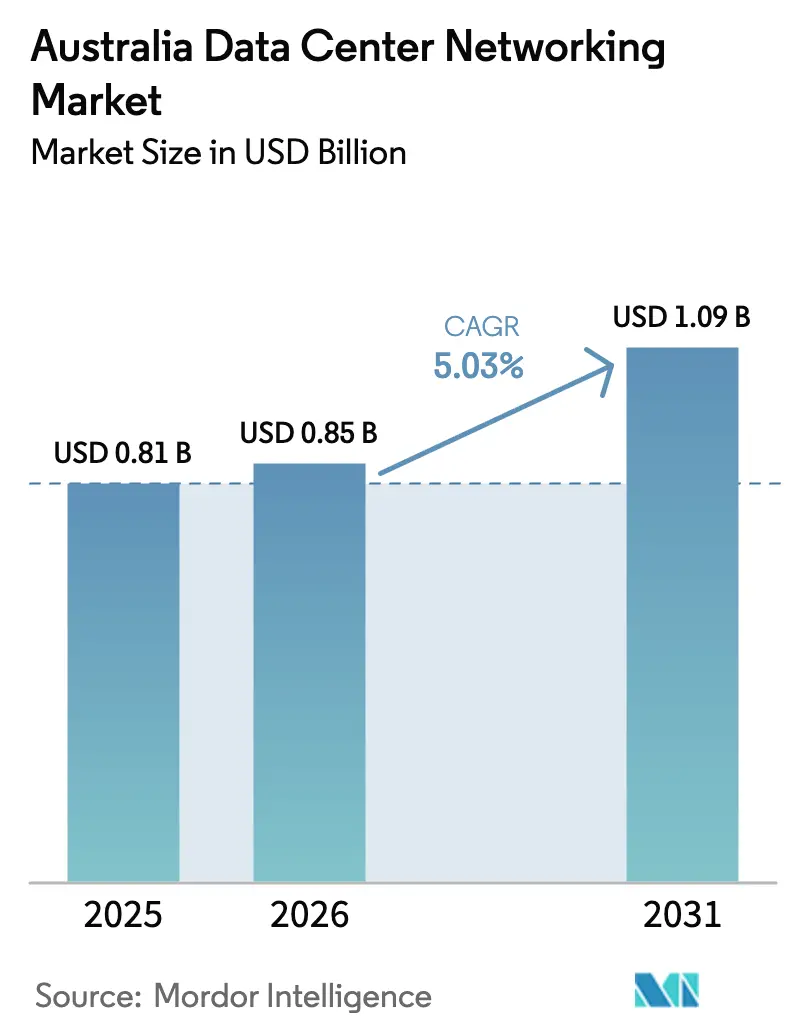
| Base Year Market Size (2025) | USD 0.81 Billion |
| Market Size (2026) | USD 0.85 Billion |
| Market Size (2031) | USD 1.09 Billion |
| Growth Rate (2026 - 2031) | 5.03% CAGR |
| Market Concentration | Medium |
Major Players *Disclaimer: Major Players sorted in no particular order Image © Mordor Intelligence. Reuse requires attribution under CC BY 4.0. | |
Australia Data Center Networking Market Analysis by Mordor Intelligence
The Australia data center networking market size was valued at USD 0.81 billion in 2025 and estimated to grow from USD 0.85 billion in 2026 to reach USD 1.09 billion by 2031, at a CAGR of 5.03% during the forecast period (2026-2031). Growth now centers on supporting artificial-intelligence training clusters, sovereign-cloud mandates, and ultra-low-latency connectivity for mission-critical workloads rather than on first-wave cloud migration. Government programs such as the USD 2 billion contract for an AWS top-secret cloud underline how national-security objectives steer procurement toward high-bandwidth, heavily segmented fabrics. Hyperscaler build-outs by NEXTDC, Equinix, and Stack Infrastructure, combined with projected household device proliferation, accelerate investment in 400 GbE and 800 GbE switching to pre-empt future east-west traffic surges. Financial-services AI workloads already process hundreds of billions of data points daily, signalling a long-term shift toward non-blocking, leaf-spine architectures.
Key Report Takeaways
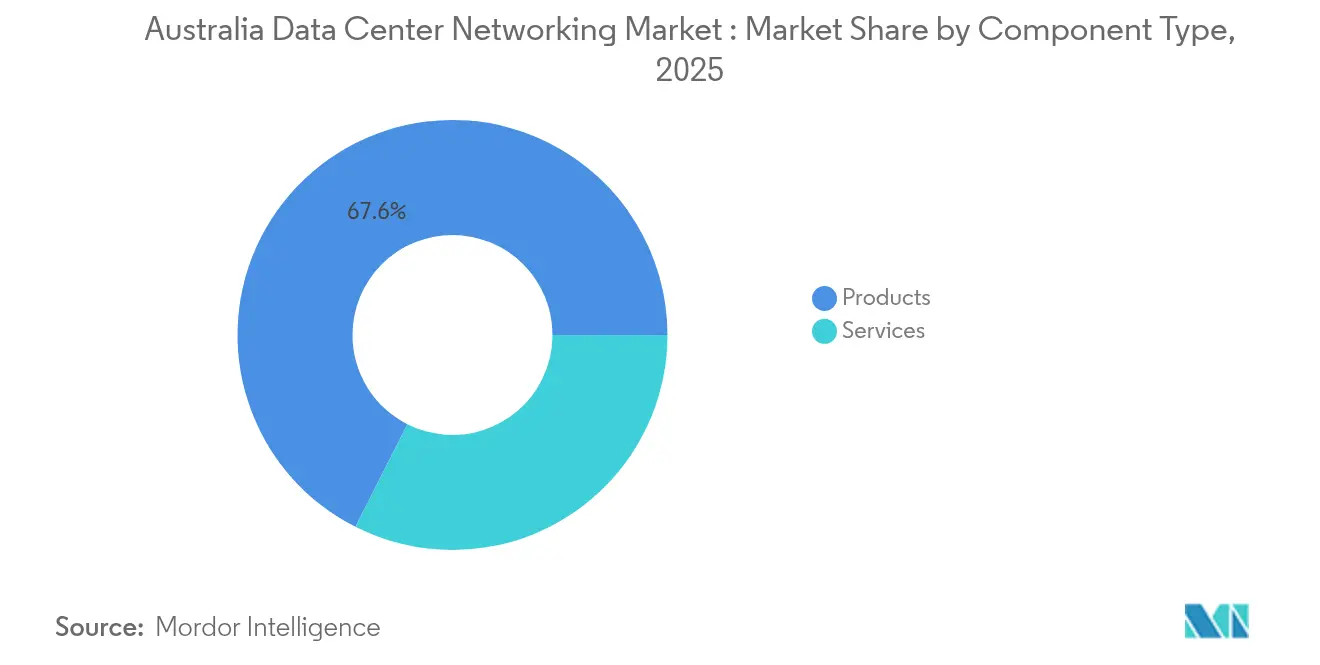
- By component, Products held 67.55% of the Australia data center networking market share in 2025, while Services are projected to rise at a 7.72% CAGR through 2031.
- By end-user, IT & Telecommunications led with 36.12% revenue share in 2025; Healthcare & Life Sciences is forecast to expand at a 6.18% CAGR to 2031.
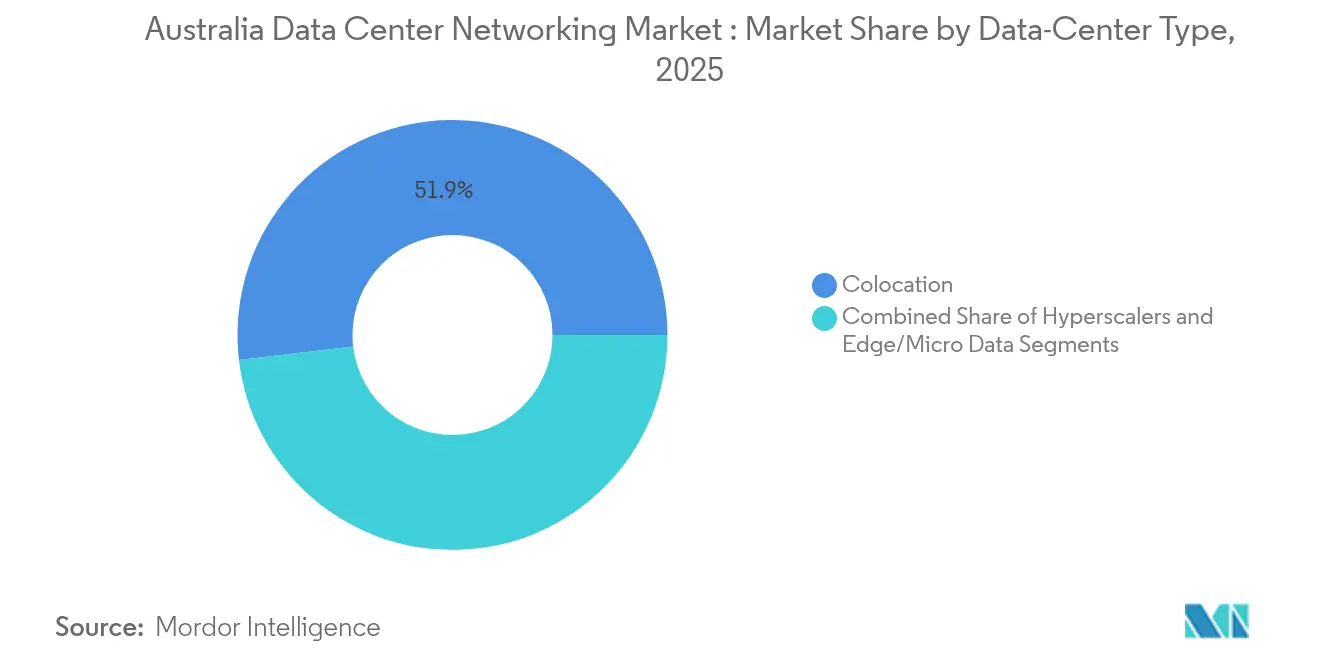
- By data-center type, Colocation facilities accounted for 51.85% of the Australia data center networking market size in 2025, whereas the Hyperscaler/Cloud Service Provider segment is poised for a 8.92% CAGR up to 2031.
- By bandwidth, the 50-100 GbE category retained 35.92% share of the Australia data center networking market size in 2025, while the greater than 100 GbE segment is projected to grow at 9.21% CAGR through 2031.
Note: Market size and forecast figures in this report are generated using Mordor Intelligence’s proprietary estimation framework, updated with the latest available data and insights as of 2026.
The competitive field in Australia extends beyond its borders, connecting regional dynamics to a global strategic environment. Our market research on global data center networking industry outlines that broader, worldwide structure.
Australia Data Center Networking Market Trends and Insights
Drivers Impact Analysis*
| Driver | (~) % Impact on CAGR Forecast | Geographic Relevance | Impact Timeline |
|---|---|---|---|
| Rapid rollout of hyperscale and cloud facilities | +1.2% | Australia-wide, concentrated in Sydney, Melbourne | Medium term (2-4 years) |
| Surge in AI/ML-driven East-West traffic inside Australian data centres | +0.9% | Major metros with hyperscale presence | Short term (≤ 2 years) |
| Migration from 10/25 GbE to 100/400 GbE switching fabrics | +0.7% | Tier-1 cities, expanding to regional centers | Medium term (2-4 years) |
| Government incentives for sovereign data-residency and digital-economy targets | +0.6% | National, with concentration in Canberra, Sydney | Long term (≥ 4 years) |
| Growing adoption of software-defined, open networking (SONiC/Net-Ops) | +0.4% | Enterprise and hyperscale deployments nationwide | Medium term (2-4 years) |
| Edge-colocation build-outs around Tier-2 Australian cities | +0.3% | Perth, Adelaide, Brisbane, Darwin | Long term (≥ 4 years) |
| Source: Mordor Intelligence | |||
Rapid rollout of hyperscale and cloud facilities
Operators are shifting from capacity-led builds to capability-driven designs that prioritise interconnection density. NEXTDC’s 550 MW Sydney land bank and Equinix’s AUD 240 million twin-city expansion highlight a push toward leaf-spine topologies optimised for 400 GbE fabric. Stack Infrastructure’s AUD 1.3 billion fund-raising signals global capital’s confidence that Australia data center networking market growth will pivot on these hyperscale builds.
Surge in AI/ML-driven east-west traffic
Cisco’s Nexus HyperFabric AI platforms are arriving in Sydney labs to handle RDMA over Converged Ethernet traffic, where microsecond latency swings stall model training.[1]Cisco, “Nexus HyperFabric AI Solution Brief,” cisco.com Financial giants such as Commonwealth Bank run 2,000 models over 157 billion data points, pushing sustained east-west loads that demand non-blocking 400 GbE switching. Facilities certified under NVIDIA’s DGX-Ready program, including NEXTDC’s, show how purpose-built cold-aisle containment and low-jitter fabrics become competitive differentiators.
Migration from 10/25 GbE to 100/400 GbE fabrics
Wholesale carrier Devoli and Juniper Networks built Australia’s first end-to-end 400 G backbone, a ten-fold capacity uplift positioning the firm for 800 GbE scalability[2]Juniper Networks, “Devoli Launches 400 G Backbone,” juniper.net. Dell Technologies’ Enterprise SONiC Distribution lets operators uncouple network operating systems from merchant-silicon hardware, avoiding refresh traps as Australia data center networking market transitions to 400 GbE.
Government incentives for sovereign data-residency
The Defence Department’s move from Global Switch to locally-owned Canberra Data Centres underscores how policy anchors load in Australian-controlled real estate, demanding micro-segmented 100 GbE fabrics capable of inline inspection. The Digital Transformation Agency’s hosting strategy obliges agencies to split workloads across hybrid clouds while enforcing zero-trust networking.
Restraints Impact Analysis*
| Restraint | (~) % Impact on CAGR Forecast | Geographic Relevance | Impact Timeline |
|---|---|---|---|
| High capex for 400 GbE/800 GbE optics in a small-volume market | -0.8% | Australia-wide, particularly affecting smaller operators | Short term (≤ 2 years) |
| Limited pool of specialised data-centre network engineers | -0.6% | National, acute in regional areas | Medium term (2-4 years) |
| Energy-price volatility impacting TCO models | -0.4% | National, varying by state energy policies | Medium term (2-4 years) |
| Slow standardisation of single-pair Ethernet for DCIM links | -0.2% | Primarily affecting new facility deployments | Long term (≥ 4 years) |
| Source: Mordor Intelligence | |||
High capex for 400 GbE/800 GbE optics
A smaller national procurement base keeps per-port prices high because Australian buyers cannot unlock the scale discounts enjoyed in North America or China. Supply-chain lags still affect 80% of global switch makers, with tariffs adding further price pressure for the Australia data center networking market
Limited pool of specialised network engineers
Infrastructure Australia projects a 93,000-person shortfall across technical trades by 2028, directly constraining deployment velocity for software-defined fabrics. Scarcity is more acute in Tier-2 cities, delaying regional edge-colocation schedules even when capital is available.[3]Infrastructure Australia, “Infrastructure Workforce Forecast 2025-2030,” infrastructureaustralia.gov.au
*Our forecasts treat driver/restraint impacts as directional, not additive. The impact forecasts reflect baseline growth, mix effects, and variable interactions.
Segment Analysis
By Component: Services Accelerate Despite Product Dominance
Products accounted for 67.55% of the Australia data center networking market share in 2025, anchored by high-density leaf-spine switches, routers, and optical interconnects demanded by hyperscale halls. The installed hardware base is expanding as national capacity grows from 1,350 MW in 2024 to 3,100 MW by 2030, underpinning predictable refresh cycles. Services, however, post the fastest 7.72% CAGR to 2031. Tight labour supply and the sophistication of open-networking stacks make integration and lifecycle management a recurring spend priority.
Managed network services providers are bridging Australia data center networking industry skills gaps by offering 24×7 telemetry, intent-based configuration, and automated compliance reporting. Demand for design consulting and training likewise accelerates as organisations grapple with SONiC roll-outs and GPU cluster cabling that deviate from legacy topologies. Thus, expenditure shifts from one-off capital equipment to continual operating outlays attached to multi-year service agreements.


By End-User: Healthcare Velocity Contrasts IT Dominance
IT & Telecommunications retained 36.12% of segment revenue in 2025, driven by operators running both wholesale infrastructure and consumer connectivity products. Telcos leverage their national fibre backbones to market low-latency cross-connect fabrics within carrier-neutral sites, reinforcing their role as anchor tenants for wholesale networking gear.
Healthcare & Life Sciences registers a 6.18% CAGR, the fastest among verticals, as genomic testing and digital pathology create sustained 100 GbE east-west loads. QIAGEN’s Melbourne build for clinical next-generation sequencing mirrors rising sovereign-data expectations in the sector. Financial services retain steady outlays, evidenced by the Commonwealth Bank example above, while government workloads gain momentum under cyber-security mandates that elevate segmentation and encryption needs.
By Data-Center Type: Hyperscaler Momentum Challenges Colocation Leadership
Colocation captured 51.85% of the Australia data center networking market size in 2025, benefiting from network-effect economics around interconnection hubs. Providers like NEXTDC and Equinix distribute the cost of 400 GbE fabrics across dozens of tenants, keeping port pricing competitive and allowing rapid turn-up of cross-connects.
Hyperscaler and cloud-service-provider builds post a 8.92% CAGR through 2031, the fastest of all facility types, propelled by AWS’s USD 2 billion top-secret cloud, Google’s Melbourne cloud region, and Microsoft’s Canberra Azure Government zone. Their designs embrace liquid-cooled GPUs connected via 800 GbE, setting new baselines for port-to-rack density that traditional colocation halls now emulate. Edge/micro-data-center roll-outs in mining towns like Newman broaden geographic dispersion but remain niche in revenue contribution.
By Bandwidth: Migration Patterns Signal Infrastructure Evolution
The 50-100 GbE tier retained 35.92% of 2025 revenue, making it the functional baseline across enterprise and many colocated racks. Operators extend asset life by upgrading optics within the same switch line-cards, delaying wholesale chassis swaps. Yet, the greater than 100 GbE segment is advancing at 9.21% CAGR, reflecting capex front-loading for AI clusters.
Devoli’s 400 G backbone illustrates how wholesale carriers prepare for 800 GbE interfaces by first standardising coherent-optic roadmaps. Meanwhile, ≤10 GbE and 25-40 GbE links shrink rapidly outside of out-of-band management networks and edge appliances. Users therefore plan hybrid fabrics where legacy SAN traffic coexists with 400 GbE east-west flows until full application refactoring completes.
Geography Analysis
Sydney retains primacy as the nation’s digital-traffic core, hosting multiple cable landing stations and the largest contiguous block of hyperscale hall capacity. Equinix extended its SY series sites with 4,175 AI-ready cabinets during 2025, ensuring direct cloud on-ramps and sub-millisecond metro access. Melbourne follows with a projected 45% interconnection bandwidth CAGR to 2026, driven by spill-over demand and state-level incentives for fintech and creative-media workloads.
Tier-2 cities demonstrate sharper percentage growth, albeit off smaller bases. NEXTDC inaugurated Adelaide’s first Tier IV facility in mid-2024 to serve aerospace and defence clients who need five-nines uptime. Perth gains strategic value through Zscaler’s point-of-presence inside Equinix, bolstering cybersecurity posture for mining and LNG operators. Darwin’s AUD 80 million expansion supports northern defence logistics and cross-border traffic into Southeast Asia.
Regional micro-centres arise along supply-chain corridors such as the Pilbara, where edge racks collect IoT telemetry before relaying to Perth 100 GbE aggregation points. However, capital recovery remains challenging because lower rack densities dilute economies of scale. As a result, most high-port-count spine switches still deploy in Sydney and Melbourne, reinforcing their market gravity.
Mordor Intelligence tracks the data center networking market across other major regions such as Middle East, Asia, and Europe, with additional country-level coverage spanning Thailand, Singapore, Saudi Arabia, Hong Kong, Germany, and United Kingdom, each reflecting localized structural drivers, restraints and more.
Competitive Landscape
Competition is moderately concentrated, with global switch incumbents deepening AI-centric portfolios while local integrators monetise services gaps. Arista Networks led global data-center switching revenue at USD 7 billion in 2024, up 19.5% year-over-year, and its EOS AI Agent co-engineering with NVIDIA resonates with hyperscalers seeking deterministic micro-burst handling.[4]Arista Networks, “Q1 2025 Results – Data Center Switching,” arista.com Cisco retains a broad account presence through Nexus, ACI, and silicon-one roadmaps but faces pricing pressure where open-networking alternatives gain acceptance.
Juniper Networks’ imminent USD 14 billion merger with HPE promises tighter integration between routing silicon and HPE GreenLake edge-to-cloud services, potentially altering preferred-vendor matrices for government frameworks. Dell Technologies leverages Enterprise SONiC to capture organisations prioritising vendor diversity. Rising service-provider entrants specialise in managed fabrics, using white-box hardware backed by local SLA guarantees to differentiate against multinational OEMs.
Technology alliances shape purchase decisions. Arista and Microsoft optimise 800 GbE line-cards for Azure Canberra, while Cisco teams with NVIDIA on in-switch telemetry for AI congestion avoidance. Meanwhile, domestic fibre operators bundle dark-fibre routes with leaf-spine hardware, offering turnkey latency-bounded links that appeal to high-frequency trading desks.
Australia Data Center Networking Industry Leaders
Cisco Systems Inc.
Arista Networks Inc.
Juniper Networks Inc.
Dell Technologies Inc.
Hewlett Packard Enterprise Company
- *Disclaimer: Major Players sorted in no particular order

Recent Industry Developments
- June 2025: Equinix completed the acquisition of three Manila data centers, strengthening its Asia-Pacific reach that benefits cross-border Australian interconnectivity
- May 2025: Stack Infrastructure secured AUD 1.3 billion for Australian hyperscale expansion
- April 2025: DXN signed a contract to supply prefabricated data centers to satellite ground-station operators, supporting edge networking use cases
- March 2025: Partners Group acquired GreenSquareDC, reflecting private-equity appetite for secondary-city capacity.
- February 2025: QIAGEN opened a Melbourne data center for bioinformatics workloads
- December 2024: Blackstone closed a USD 16.2 billion purchase of AirTrunk, the region’s largest data-center deal


Research Methodology Framework and Report Scope
Market Definitions and Key Coverage
According to Mordor Intelligence, the Australia data center networking market covers revenue from switches, routers, SAN fabrics, application-delivery controllers, network-security appliances, SDN controllers, optical interconnects, and the related integration, support, and managed network services installed within colocation, hyperscale, and edge data centers across Australia. Values are expressed in constant 2024 USD and track end-customer spend inside the data-center campus only.
Scope exclusion: equipment that serves enterprise campus LANs or carrier wide-area backbones outside a data-center boundary is not counted.
Segmentation Overview
- By Component
- Products
- Ethernet Switches
- Routers
- Storage Area Network (SAN)
- Application Delivery Controllers (ADC)
- Network Security Appliances
- Software-Defined Networking (SDN) Controllers
- Optical Interconnects
- Services
- Installation and Integration
- Training and Consulting
- Support and Maintenance
- Managed Network Services
- Products
- By End-User
- IT and Telecommunications
- Banking, Financial Services and Insurance (BFSI)
- Government and Defense
- Media and Entertainment
- Healthcare and Life Sciences
- Manufacturing and Industrial
- Other End-Users
- By Data-Center Type
- Colocation
- Hyperscalers/Cloud Service Providers
- Edge/Micro Data Centers
- By Bandwidth
- Less than or equals to 10 GbE
- 25–40 GbE
- 50–100 GbE
- Greater than 100 GbE
Detailed Research Methodology and Data Validation
Primary Research
Mordor analysts interviewed data-center architects, colocation procurement heads, network integrators, and product managers in Sydney, Melbourne, and Perth. These conversations validated live rack counts, typical port densities, upgrade cycles to 100 GbE, and prevailing service mark-ups, letting us refine assumptions and close data gaps.
Desk Research
Our team built a baseline using public sources such as Australian Bureau of Statistics ICT accounts, Australian Communications and Media Authority traffic studies, the federal Digital Infrastructure Register, International Trade Center customs data for HS 8517 codes, and technical papers from the Cloud Infrastructure Association of Australia. Company 10-Ks, vendor list prices, project tenders, and facility announcements were screened through D&B Hoovers and Dow Jones Factiva to map installed racks, pricing shifts, and upcoming capacity. The sources named are illustrative rather than exhaustive; many additional references informed data gathering and verification.
Market-Sizing & Forecasting
The baseline is estimated through a top-down rack pool multiplied by network cost per rack model, followed by bandwidth-mix and refresh-cycle adjustments. Supplier revenue roll-ups and sampled deal sizes act as bottom-up checkpoints. Core drivers include new hyperscale MW additions, share of 100 GbE ports, switch ASP erosion, colocation rack utilization, and managed service penetration. Forecasts employ multivariate regression tied to capacity build-outs and cloud-spend indicators, with scenario analysis gauging power-cost shocks.
Data Validation & Update Cycle
Outputs pass anomaly flags, year-on-year variance checks, and reconciliation with import statistics and vendor disclosures. Models refresh annually, with interim updates triggered by major facility announcements or regulatory shifts. A final analyst sweep precedes each publication.
Why Our Australia Data Center Networking Baseline Commands Credibility
Published figures often diverge because firms define component boundaries differently, apply distinct port-price curves, or lock forecasts to one scenario.
Mordor's study focuses strictly on in-data-center hardware plus linked services, updates port-speed mix yearly, and applies Reserve Bank of Australia average exchange rates. Other publishers may aggregate WAN routing, campus LAN spend, or quote investment value, leading to higher or lower totals.
Benchmark comparison
| Market Size | Anonymized source | Primary gap driver |
|---|---|---|
| USD 0.81 Bn (2025) | Mordor Intelligence | - |
| USD 0.34 Bn (2024) | Regional Consultancy A | Hardware only; omits services and optical links |
| USD 1.20 Bn (2024) | Global Consultancy B | Bundles enterprise campus gear with data-center spend |
| USD 26.45 Bn (2025) | Industry Tracker C | Counts full networking CAPEX across Asia-Pacific, not Australia-only revenue |
These contrasts show that once scope and geography are normalized, Mordor's number sits logically between hardware-only and overly broad valuations, giving decision-makers a balanced, transparent baseline tied to verifiable rack counts and repeatable steps.


Key Questions Answered in the Report
How big is the Australia Data Center Networking Market?
The Australia Data Center Networking Market size is expected to reach USD 0.85 billion in 2026 and grow at a CAGR of 5.03% to reach USD 1.09 billion by 2031.
What is the current value of the Australia data center networking market?
The market is valued at USD 0.85 billion in 2026 and projects to USD 1.09 billion by 2031 at a 5.03% CAGR.
Which component segment is expanding fastest?
Services grow at an 7.72% CAGR as operators outsource integration, management, and training on AI-centric fabrics.
Why are 100 GbE links gaining traction in Australia?
AI training clusters and hyperscale spine-leaf architectures demand non-blocking 400 GbE and 800 GbE switching before traffic peaks.
Which end-user vertical shows the highest growth rate?
Healthcare & Life Sciences posts a 6.18% CAGR due to genomic analytics and data-sovereignty mandates.
How concentrated is vendor competition?
Five global OEMs together hold roughly 60% share, yielding a moderate concentration score of 6.
What restrains faster market expansion?
High per-port costs for 400 GbE optics and a shortage of specialised data-centre network engineers weigh on near-term growth.
Page last updated on:


