
Market Overview
| Study Period | 2020 - 2031 |
|---|---|
| Forecast Data Period | 2026 - 2031 |
| Base Year Market Size (2025) | USD 67.71 Billion |
| Market Size (2026) | USD 74.92 Billion |
| Market Size (2031) | USD 115.97 Billion |
| Growth Rate (2026 - 2031) | 9.13 % |
| Market Concentration | Medium |
Major Players *Disclaimer: Major Players sorted in no particular order Image © Mordor Intelligence. Reuse requires attribution under CC BY 4.0. | |
Australia ICT Market Analysis by Mordor Intelligence
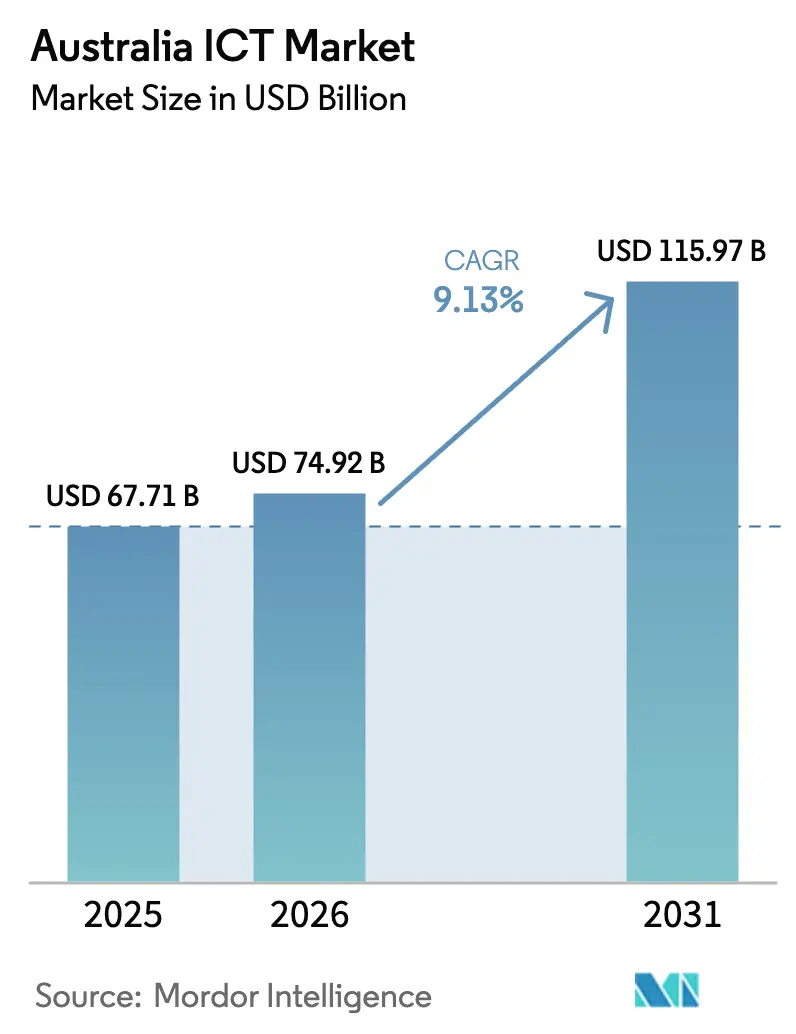
The Australia ICT Market size was valued at USD 67.71 billion in 2025 and is estimated to grow from USD 74.92 billion in 2026 to reach USD 115.97 billion by 2031, at a CAGR of 9.13% during the forecast period (2026-2031). Robust public-sector digital mandates, sovereign-cloud requirements, and expanding hyperscale footprints are reinforcing domestic data-center builds and accelerating cloud migration. Enterprise spending is further buoyed by the intensified Notifiable Data Breaches regime, which has redirected budgets toward managed security and zero-trust architectures. Telco 5G stand-alone cores now enable network slicing, unlocking edge-computing use cases in mining, logistics, and healthcare. In parallel, the Moon to Mars initiative is driving demand for high-performance computing that ripples through storage and networking suppliers. Counterbalancing these tailwinds, a widening talent gap and regional broadband inequalities threaten to slow project delivery and cloud-based collaboration.
Key Report Takeaways
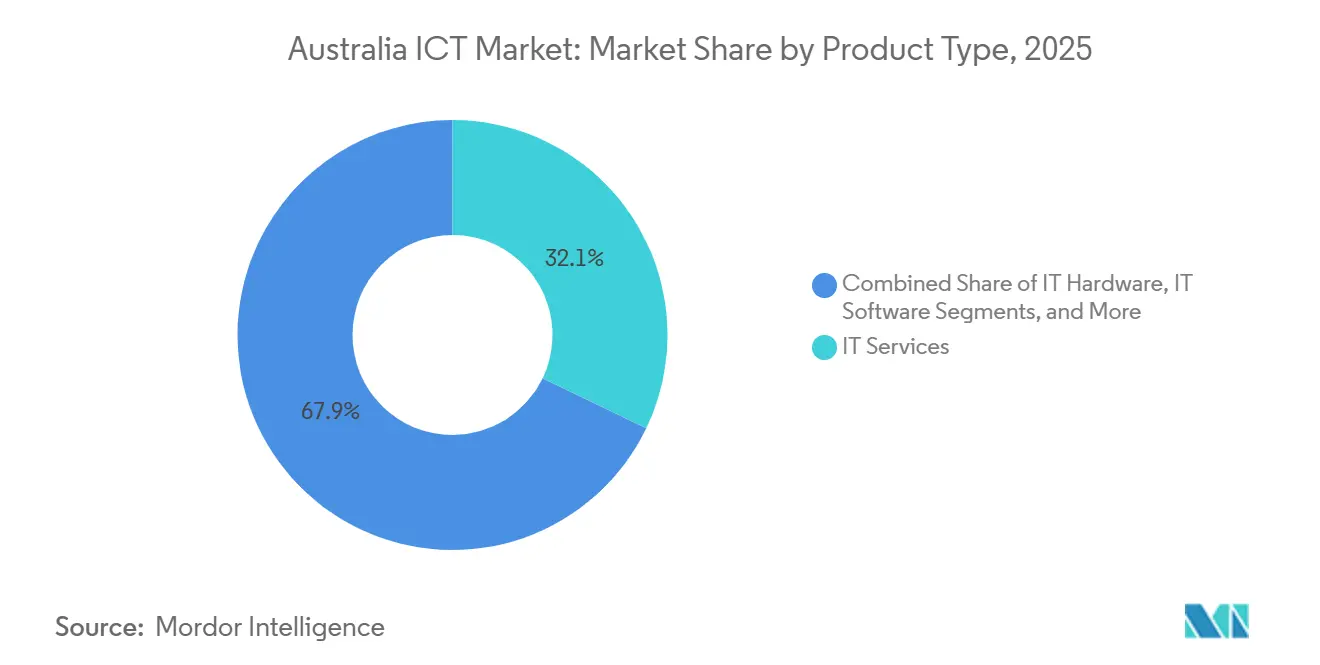
- By product type, IT Services led with 32.13% revenue share in 2025, while Cloud and Platform Services is advancing at a 10.74% CAGR through 2031.
- By enterprise size, Large Enterprises held 57.46% of the Australia ICT market share in 2025, whereas SMEs are set to grow at 10.11% annually to 2031.
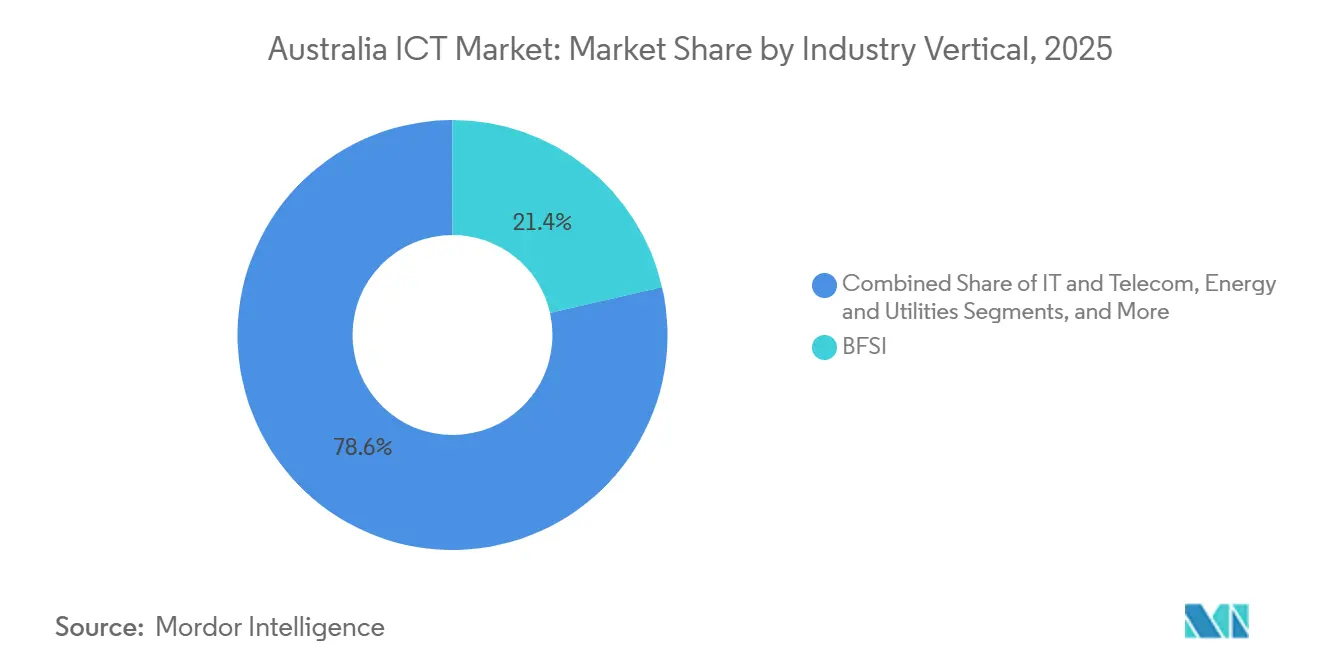
- By industry vertical, BFSI captured 21.43% of 2025 spend, but Healthcare and Life Sciences is expanding at a 10.92% CAGR through 2031.
Note: Market size and forecast figures in this report are generated using Mordor Intelligence’s proprietary estimation framework, updated with the latest available data and insights as of 2026.
Australia ICT Market Trends and Insights
Drivers Impact Analysis*
| Driver | (~) % Impact on CAGR Forecast | Geographic Relevance | Impact Timeline |
|---|---|---|---|
| Accelerated Government Digital Transformation Programs | +2.1% | National, concentrated in Australian Capital Territory, New South Wales, Victoria | Medium term (2-4 years) |
| Rapid Cloud Computing Adoption Across Enterprises | +2.4% | National, with early gains in Sydney, Melbourne, Brisbane | Short term (≤ 2 years) |
| Expansion of 5G Networks Enabling Next-Gen Applications | +1.8% | National, urban centers in New South Wales, Victoria, Queensland leading | Medium term (2-4 years) |
| Rising Cybersecurity Threats Boosting Security Spend | +1.6% | National, heightened focus in BFSI and Government sectors | Short term (≤ 2 years) |
| Australia's Emerging Space Industry Driving HPC Demand | +0.7% | South Australia, Australian Capital Territory, Western Australia | Long term (≥ 4 years) |
| Data Sovereignty Mandates Fueling Local Data Center Investment | +1.5% | National, concentrated in New South Wales, Victoria, Australian Capital Territory | Medium term (2-4 years) |
| Source: Mordor Intelligence | |||
Accelerated Government Digital Transformation Programs
Whole-of-government targets require 80% of unclassified workloads to operate in IRAP-assessed clouds by June 2027, channeling AUD 1.2 billion (USD 809 million) toward SaaS licenses and API gateways in the 2025-26 federal budget.[1] Federal and state agencies are consolidating 147 procurement contracts into a single framework that favors ISO 27001-certified vendors, thereby elongating multi-year transformation pipelines. Services Australia’s myGov re-platforming exemplifies identity federation spanning 32 portals, and state-level digital restart funds replicate this model for land-title and court systems. The result is sustained demand for change-management consultants and UX designers, roles historically under-resourced in public projects.
Rapid Cloud Computing Adoption Across Enterprises
APRA’s revised CPS 234 compels quarterly penetration tests and seven-year log retention, encouraging FSIs to shift core apps into multi-AZ cloud patterns. AWS added 50 MW in its fourth Sydney zone in 2025, while Google Cloud committed AUD 2 billion (USD 1.35 billion) to Melbourne data halls powered entirely by wind energy. Mid-market adoption is visible; 62% of manufacturers with 50-500 employees had at least one cloud ERP module live in 2025, up from 41% in 2023, citing faster time-to-value. Yet identity management across AWS, Azure, and Google now absorbs up to 40% of cloud-ops budgets, making policy automation a new spending hotspot.
Expansion of 5G Networks Enabling Next-Gen Applications
Telstra finalized its 5G stand-alone core in June 2025, unlocking network slicing for mining and logistics, where latency-sensitive control loops govern autonomous haul trucks. Optus followed with millimeter-wave cells in Sydney’s CBD, enabling 4.5 Gbps peaks for AR retail showcases. ACMA’s 26 GHz spectrum auction spurred private 5G builds; BHP’s Olympic Dam network integrated 1,200 IoT sensors and cut downtime 18% within six months. Edge partnerships, such as AWS Wavelength in Telstra cores, now deliver sub-10 ms latency for gaming and telemedicine.
Rising Cybersecurity Threats Boosting Security Spend
Cybercrime reports hit 94,000 in FY 2024-25, up 23% year-on-year, and new privacy penalties rise to the greater of USD 33.7 million or 30% of turnover. Managed security contracts rose 34% for NTT Ltd., underscoring a pivot from product to service-led defense. The ASD partnership program now exchanges classified indicators for vendor telemetry, tightening patch cycles. Zero-trust adoption accelerated 47% of ASX 200 firms using microsegmentation in 2025, up from 29% in 2023, reflecting board-level prioritization.
Restraints Impact Analysis*
| Restraint | (~) % Impact on CAGR Forecast | Geographic Relevance | Impact Timeline |
|---|---|---|---|
| Acute Shortage of Advanced IT Talent | -1.4% | National, most severe in cybersecurity and cloud architecture roles | Short term (≤ 2 years) |
| Legacy Infrastructure Complexity in Large Enterprises | -0.9% | National, concentrated in BFSI, Government, Energy sectors | Medium term (2-4 years) |
| High Broadband Costs in Remote Regions | -0.5% | Northern Territory, Western Australia, Queensland regional areas | Long term (≥ 4 years) |
| Stringent E-waste Regulations Increasing Compliance Cost | -0.3% | National, affecting IT Hardware and Infrastructure segments | Medium term (2-4 years) |
| Source: Mordor Intelligence | |||
Acute Shortage of Advanced IT Talent
ICT unemployment stood at 1.8% in December 2025, well below the national rate of 3.9%, highlighting structural scarcity.[2]Australian Bureau of Statistics, “Labour Force Survey December 2025,” abs.gov.au Cybersecurity analysts earn a median AUD 135,000 (USD 91,000), yet roles remain vacant for 14 weeks on average. Visa backlogs hinder offshore recruitment, and although universities are scaling cybersecurity cohorts by 40%, graduations will not bridge the gap before 2028. Cost escalation and project delays are already evident as integrators over-commit on delivery timelines.
Legacy Infrastructure Complexity in Large Enterprises
Mainframe estates with COBOL codebases exceeding 10 million lines still process billions of transactions monthly, exemplified by Commonwealth Bank’s z/OS core. Regulatory stress-test mandates discourage rip-and-replace migrations, funneling budgets into middleware for incremental modernization. Hybrid integration raises licensing costs and adds failure points, complicating root-cause analysis during outages.
*Our forecasts treat driver/restraint impacts as directional, not additive. The impact forecasts reflect baseline growth, mix effects, and variable interactions.
Segment Analysis
By Product Type: Services Anchor Spend, Cloud Platforms Drive Momentum
IT Services captured a 32.13% slice of 2025 spending as enterprises leaned on integrators for multi-cloud navigation and regulatory alignment. Within IT Services, managed security and business process outsourcing are converging, with providers knitting threat intelligence into HR and finance workflows, elevating stickiness among mid-market clients. IT Services are forecast to post the fastest CAGR of 10.74% to 2031, driven by cloud and platform services fueled by consumption-based economics and a maturing ecosystem of PaaS abstractions that trim infrastructure overhead. Selective hardware refresh persists when performance gains are material, such as Cisco’s silicon photonics switches that reduce power by 40%, yet overall hardware budgets flatten as device-as-a-service shifts capex to opex.
Hyperconverged infrastructure now dominates new storage procurement, with Dell reporting 38% of Australian storage revenue in fiscal 2025 derived from VxRail and PowerFlex. Security spend remains the outlier, outpacing overall Australia ICT market size growth as essential-eight compliance drives upgrades to EDR and SIEM platforms.[3]Dell Technologies, “Australia VxRail Revenue Share,” dell.com Communication services revenue is migrating from voice to SD-WAN and unified comms, and telcos are bundling these with sovereign-cloud connectivity to defend margins. Consulting benches stay busy with generative-AI pilots, yet routine integration is commoditizing under AI-assisted tooling.



By Enterprise Size: Large Enterprises Command Budgets, SMEs Accelerate Adoption
Large Enterprises accounted for 57.46% of 2025 outlays, with investment focused on governance, master data management, and robust API gateways. Their complex estates elevate demand for Australia ICT market size-linked integration budgets and professional services retainer models. SMEs, aided by 50% migration subsidies, are projected to compound at 10.11% annually to 2031. Turnkey SaaS bundles cloud accounting, inventory, and payroll, lower entry barriers, and vendors like Xero report double-digit subscriber growth as average revenue per user rises with module attach.
Security postures diverge sharply; large firms allocate 8-12% of ICT budgets to cybersecurity, often staffing internal SOCs, whereas SMEs lean on managed detection and response subscriptions priced under AUD 15,000 (USD 10,110) per month. Telstra’s Essential Cyber package exemplifies security subscriptions tailored for SMEs. 34% of ASX 200 companies piloted large-language-model assistance in 2025, versus 9% of SMEs, but falling model-training costs should narrow this divide.
By Industry Vertical: BFSI Still Dominant, Healthcare Surges
BFSI retained 21.43% of 2025 spend for mandatory compliance tooling, fraud analytics, and mobile-banking upgrades. Yet Healthcare and Life Sciences is the standout growth area, expanding at a 10.92% CAGR under the My Health Record interoperability mandate, which requires FHIR-compliant APIs by December 2026. In mining-centric states, energy and utilities channel funds into grid digitization and distributed energy resource management, aligning with the Integrated System Plan. Retail and logistics sectors adopt warehouse robotics and AI-driven last-mile routing, curbing labor costs and boosting delivery predictability.
Manufacturing’s Industry 4.0 shift embeds IoT sensors and predictive analytics across production lines, cutting unplanned downtime and sharpening maintenance cycles. Government workloads constitute high-value demand for identity assurance and case-management systems, while oil and gas players deploy digital twins to optimize offshore production. These varied but convergent vertical demands ensure the Australia ICT market remains resilient against cyclical shocks.
Geography Analysis
New South Wales led national spend in 2025, powered by Sydney’s finance headquarters, hyperscale data-centers, and dense startup corridor. The state’s AUD 1.5 billion (USD 1.06 billion) Digital Restart Fund funds mainframe replacement and microservice adoption, catalyzing long-tail opportunities for local integrators. Victoria follows closely; Melbourne hosts sovereign-cloud regions for AWS, Microsoft, and Google, and combined hyperscale investment topped AUD 7 billion (USD 4.92 billion) from 2024-2026. Victoria’s green power commitments help firms meet net-zero targets without purchasing offsets.
Queensland harnesses the 2032 Brisbane Olympics as a springboard for smart-city infrastructure and 5G-enabled public transport. Western Australia’s mining automation drives roughly 40% of the state's ICT outlays, focusing on private 5G and edge analytics to support autonomous haulage. South Australia is emerging as a space-tech hub, anchored by the Australian Space Agency, attracting HPC vendors and communications startups. Tasmania leverages its cool climate and renewable energy to attract data center operators such as CDC to Hobart for low-PUE colocation.
Australian Capital Territory’s spend is government-centric, consolidated through DTA’s cloud framework that favors IRAP-Protected suppliers. Northern Territory trails due to sparse fiber, yet Darwin’s subsea-cable landing stations tighten latency to Southeast Asia, enabling real-time replication for disaster recovery. Despite progress, regional connectivity gaps remain, NBN’s fixed-wireless tier delivers median 48 Mbps to 1.2 million premises, limiting cloud-CAD and high-definition video. The government’s Regional Connectivity Program funds fiber to 400 towns, yet timelines extend to 2028, prolonging the digital divide.
Regulatory Landscape
Australia's ICT regulatory environment is shaped by whole-of-government digital assurance and standards regimes that affect procurement, cloud architecture, and data residency decisions. The Digital Transformation Agency (DTA) oversees the Digital and ICT Investment Oversight Framework and publishes the Major Digital Projects Report 2026, which points to government emphasis on cyber security, ERP, and legacy modernisation as major investment themes.
Cloud governance and data-sharing standards are also tightening implementation requirements across agencies and regulated industries. Effective 1 July 2026, the Whole-of-Government Cloud Computing Policy mandates cloud as the default consideration for new ICT investments by Non-Corporate Commonwealth Entities, which supports demand for IRAP-aligned cloud services and audit-ready controls. The Data Standards Body (DSB) sets technical standards for the Consumer Data Right (CDR) and the Digital ID system, while Standards Australia develops Australian Standards and represents Australia in ISO and IEC, shaping compliance baselines for cyber, data-centre, and emerging technology practices.
Value Chain Analysis
Australia's ICT value chain includes global hardware and software OEMs, hyperscale and sovereign cloud infrastructure operators, telecommunications carriers, and a services layer of systems integrators, managed service providers, and managed security service providers. Public-sector and regulated-industry procurement heavily influences demand, and DTA oversight frameworks and IRAP-aligned cloud requirements translate into downstream needs for architecture, migration, identity, and security operations, with carriers supporting cloud and edge deployments through national and regional connectivity.
Industry coordination and capability development run in parallel with commercial delivery. The Australian Information Industry Association (AIIA) convenes working groups on standards, national security, and cyber resilience to connect vendors to policy and compliance priorities, while the Australian Computer Society (ACS) supports professional standards and digital skills development that feed the services and delivery workforce. Standards Australia also underpins interoperability and compliance expectations across the chain, and data-centre-oriented standards that address self-provisioned power, connection-cost responsibility, and water efficiency influence infrastructure siting, design, and long-term operating economics for colocation and cloud facilities.
Competitive Landscape
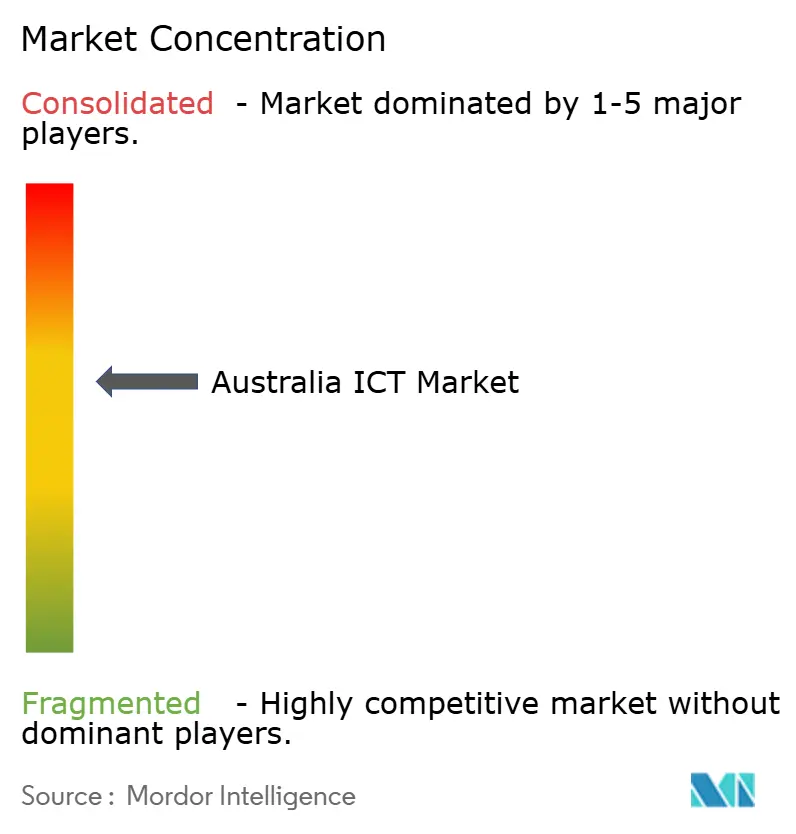
The Australia ICT market is moderately concentrated; the top 10 players command a major share of revenue, leaving a vibrant tail of niche vendors. Telstra combines ubiquitous connectivity with managed cloud and security services, leveraging its Digicel Pacific acquisition to bundle subsea capacity with edge nodes, yet margin pressure grows as hyperscalers negotiate direct peering. AWS, Microsoft, and Google compete on sovereign-cloud credibility; Microsoft’s pledge to store government data exclusively in IRAP zones forces rivals to match residency and compliance assurances.
Indian integrators Infosys, Wipro, and Tata Consultancy Services undercut on price while embedding AI co-pilots in modernization projects, compressing delivery timelines but commoditizing integration labor. Incumbents such as Accenture and DXC counter with industry-specific playbooks and change-management depth. Edge computing, private 5G, and quantum-safe cryptography surface as white-space segments; ASD’s 2025 quantum-resistant roadmap sparks early consulting engagements as agencies prepare algorithm migrations.
Telstra bought Versent to deepen professional services, NTT acquired Nexon for security scale, and Cisco-Accenture co-develop SD-WAN patterns for retail. Vertical SaaS specialists achieve 60-70% gross margins by fusing workflow expertise with narrow domains livestock management or hospital rostering that hyperscalers overlook. Collectively, these dynamics ensure sustained innovation and price competition across the Australia ICT market.
Australia ICT Industry Leaders
Telstra Corporation Limited
Microsoft Corporation
IBM Corporation
Amazon Web Services Inc.
Alphabet Inc.
- *Disclaimer: Major Players sorted in no particular order

Market Opportunities and Future Outlook
Sovereign-ready cloud, security, and AI infrastructure represent a clear whitespace where policy signals and capital commitments are converging. Effective 1 July 2026, the Whole-of-Government Cloud Computing Policy reinforces cloud-first decisioning for new ICT investments by Non-Corporate Commonwealth Entities, putting emphasis on providers and integrators that can demonstrate IRAP alignment, robust logging, and identity controls. The Major Digital Projects Report 2026 also highlights cyber security and legacy modernisation, supporting multi-year programs across application rationalisation, data governance, and managed security operations.
AI compute, skills, and safety frameworks create adjacent opportunities across data centres, platforms, and assurance services. Microsoft announced an A$25 billion investment through the end of 2029 to expand Azure AI supercomputing, cloud infrastructure, and cybersecurity capabilities in Australia, which increases demand across colocation, networking, and specialist implementation partners. On the policy side, the Australian Government has indicated development of an AI framework that incorporates legislated Australian Standards for AI, with a National Cabinet review scheduled for August 2026, supporting demand for AI governance tooling, model risk management, and compliance services for public agencies and regulated private-sector adopters.
Recent Industry Developments
- July 2026: Macquarie Technology Group exercised a $240 million call option for a 3.4ha site in Macquarie Park, Sydney, to develop an engineering and data center campus as part of a $3 billion expansion project. The move expands onshore data center capacity and sovereign capacity within Australia. It strengthens sovereign cloud and onshore compute capacity within Australia’s ICT landscape.
- July 2026: NRFC and Macquarie Technology Group announced a $200 million hybrid note investment to support sovereign cloud, cybersecurity, and data facility infrastructure. The financing supports sovereign cloud and secure data facilities. It enhances local hyperscale readiness and sovereign cybersecurity capabilities.
- June 2026: Google and Telstra announced a partnership to expand Australia’s digital infrastructure reach, including Google leasing capacity on Telstra’s Aura Network and Telstra leasing capacity on Google’s subsea cable systems. The partnership expands hyperscale and edge ready connectivity. It accelerates cloud and edge compute deployment in the Australian market.


Research Methodology Framework and Report Scope
Market Definition and Coverage
For this methodology, the Australia ICT market is measured as the total value of ICT products and services sold and consumed in Australia across business and public-sector use cases, captured in revenue terms for the defined year.
Scope exclusions: We exclude informal or non-commercial activity and do not treat general office supplies as ICT spend unless they are sold as ICT hardware, software, telecom, or related IT services.
Segmentation Overview
- By Product Type
- IT Hardware
- Computer Hardware
- Networking Equipment
- Peripherals
- IT Software
- IT Services
- IT Consulting and Implementation
- IT Outsourcing (ITO)
- Business Process Outsourcing (BPO)
- Managed Security Services
- Cloud and Platform Services
- IT Infrastructure
- IT Security/Cybersecurity
- Communication Services
- IT Hardware
- By Enterprise Size
- Small and Medium-sized Enterprises
- Large Enterprises
- By Industry Vertical
- Government and Public Administration
- BFSI
- IT and Telecom
- Energy and Utilities
- Retail, E-commerce, and Logistics
- Manufacturing and Industry 4.0
- Healthcare and Life Sciences
- Oil and Gas
- Other Industry Verticals
Data Sources, Market Sizing, and Validation
Desk Research
Desk research is used to set the base structure of the model and to anchor the totals to repeatable public indicators. We rely on official series and sector publications that describe the size and direction of telecom and digital activity, and then map them into ICT revenue pools.
Common reference points include public statistics and methods from sources such as the Australian Bureau of Statistics (industry performance, satellite account concepts, and trade in services updates), the Australian Communications and Media Authority (telecom indicators), the Department of Home Affairs (cyber and breach reporting context), and standards and advisories from the Australian Cyber Security Centre. We also review annual reports and investor materials, reputable business press, patent databases for technology direction, and paid subscriptions that help with company financials, news screening, and import export shipment level checks when hardware flows need to be sense-checked. These desk sources are illustrative only, since many other public documents are also reviewed to collect, cross-check, and clarify data points.
Primary Interviews and Surveys
Primary work is used to test assumptions that are hard to confirm from public sources alone, especially pricing moves, buying cycles, and how spending shifts between telecom, software, and services. We speak with a balanced mix of operators, systems integrators, distributors, enterprise IT leaders, and public-sector stakeholders across Australia so the model reflects both supply-side and demand-side reality, and then we re-check any big gaps spotted during desk work.
Distribution of primary research fieldwork respondents
| Company type | Respondent position |
|---|---|
| Top tier: 33% | CXOs: 13% |
| Mid tier: 51% | Functional/Unit leaders: 29% |
| Smaller Players: 16% | Managers: 58% |
Market-Sizing & Forecasting
Sizing starts from a top-down build that reconstructs national ICT spend by aligning public macro and sector signals to the defined ICT buckets in the study, and then rolling them into a single value for Australia. After that, selective bottom-up approximations are used as a reality check, such as sampled supplier revenues, channel feedback on unit volumes, and a small set of ASP times volume calculations for major hardware and service lines.
Key inputs used in the model include enterprise IT budget direction, telecom subscriber and usage trends, cloud and data-center related capacity additions (as spend signals rather than physical capacity totals), software and services price progression, and the pace of cybersecurity compliance activity that shifts spending mixes. Where the bottom-up view is incomplete, gaps are handled with conservative penetration assumptions that are validated through interviews and then tied back to observable indicators like reported segment revenue mixes and procurement patterns.
For forecasting, scenario analysis is applied so a base case is built first and then stress-tested with slower and faster adoption paths that are linked to variables like project pipelines, price inflation in services, and public-sector program timing. Assumptions are reviewed with respondents so the forecast reflects how buyers and providers expect budgets to move, not just a straight-line trend.
Data Validation & Update Cycle
Validation is done through several rounds of checks so the numbers stay consistent with what the market can realistically absorb. We compare the final market totals against independent signals, such as published industry revenue series, telecom activity metrics, and the implied per-enterprise spend levels for key customer groups, and then investigate any outliers before sign-off.
If a major variance appears, the model is reopened, the input assumptions are traced back to the source, and selected experts are re-contacted to confirm whether the change is real or driven by timing, currency conversion, or reporting scope. Reports are refreshed annually, and interim updates are triggered when material events occur, such as regulatory changes, step-changes in cloud infrastructure rollout, or large telecom pricing moves. Before delivery, an analyst completes a final pass so clients receive an up-to-date view for the current release.
Mordor Intelligence's Australia Ict Market Size Versus Other Published Estimates
Published numbers for Australia ICT often do not match because the word ICT is used differently across sources, and because some estimates are closer to a budget view than a revenue-market view. Differences also show up when the base year is not aligned, when currency assumptions are not stated clearly, and when telecom is treated as a full value pool versus a partial one.
Some external figures present total national IT spending, which typically folds in a broader basket of technology and communication outlays, including budget items that may not map cleanly to defined ICT revenue categories. For Mordor Intelligence, the total is counted only when it fits the report scope across IT hardware, software, services, and telecom for Australia, and the year values are refreshed with the latest available inputs before forecasts are extended.
Benchmark comparison
| Source | Market Size | Gaps in Research Methodology |
|---|---|---|
| Mordor Intelligence | USD 67.71 B (2025) | |
| Global Advisory A | USD 95.55 B (2025) | Reported as total IT spending and includes a broader budget basket across hardware, software, IT services, and telecommunications, so it can capture non-market allocations and timing effects that are not treated as ICT market revenue in this scope. |
| Industry Media B | USD 86.45 B (2024) | Uses a different base year and a headline spending total that can mix enterprise budget intentions with realized supplier revenues, and it may apply a simplified currency and inflation treatment when rolling forward the annual value. |
The spread in the table is mainly explained by scope breadth and what is treated as realized market value versus planned spend. By keeping the counted categories explicit, aligning the year definition, and then cross-checking with independent indicators and interview feedback, the resulting estimate stays traceable to clear inputs and can be replicated when new data arrives.


Key Questions Answered in the Report
What is the projected value of the Australia ICT market in 2031?
The market is forecast to reach USD 115.97 billion by 2031, growing at a 9.13% CAGR from 2026.
Which segment shows the fastest growth within national ICT spending?
Cloud and Platform Services lead with a 10.74% CAGR forecast through 2031.
Why are SMEs increasing their ICT budgets more rapidly than large enterprises?
Government co-investment grants subsidize up to 50% of cloud migration costs, accelerating SME adoption of SaaS and security subscriptions.
How does 5G deployment influence enterprise technology strategies in Australia?
Stand-alone 5G cores and millimeter-wave rollouts enable low-latency edge applications, prompting investments in private networks for mining, logistics, and AR retail.
What are the primary challenges restraining ICT growth across Australia?
A shortage of advanced IT talent and the complexity of legacy mainframe infrastructures slow transformation timelines and raise project costs.
Which state currently accounts for the largest share of ICT expenditure?
New South Wales holds the largest share, underpinned by Sydney’s financial services and dense hyperscale data-center footprint.
Page last updated on:


 Your data is secure and never sold or shared.


