Market Overview
| Study Period | 2020 - 2031 |
|---|---|
| Forecast Data Period | 2026 - 2031 |
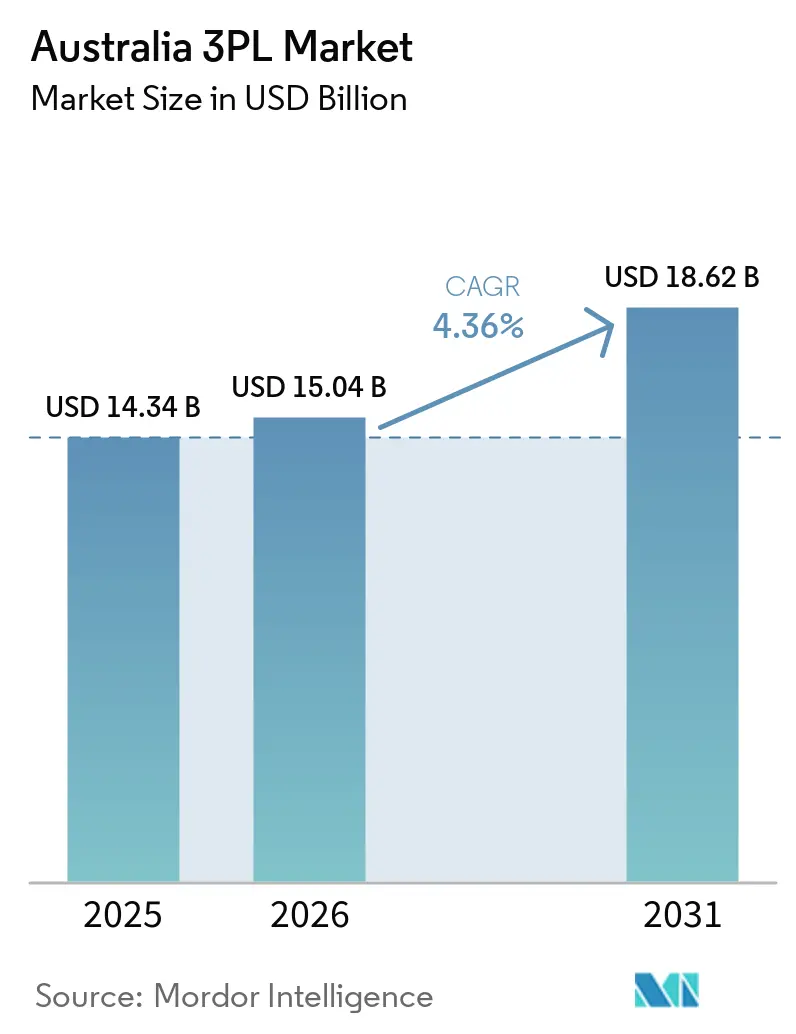
| Base Year Market Size (2025) | USD 14.34 Billion |
| Market Size (2026) | USD 15.04 Billion |
| Market Size (2031) | USD 18.62 Billion |
| Growth Rate (2026 - 2031) | 4.36% CAGR |
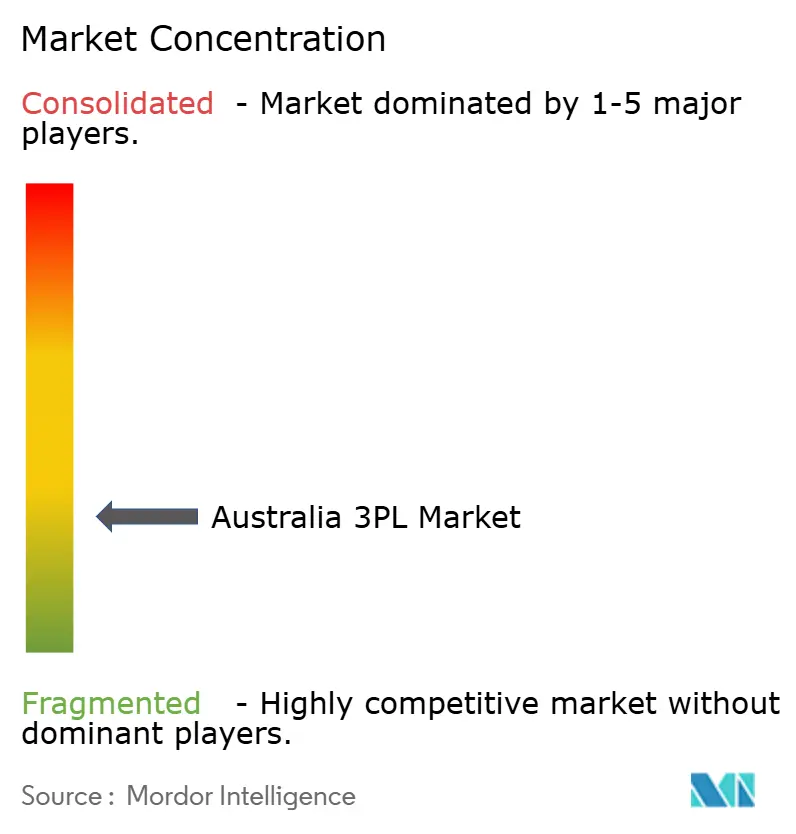
| Market Concentration | Low |
Major Players *Disclaimer: Major Players sorted in no particular order Image © Mordor Intelligence. Reuse requires attribution under CC BY 4.0. | |
Australia 3PL Market Analysis by Mordor Intelligence
The Australia 3PL Market size was valued at USD 14.34 billion in 2025 and is estimated to grow from USD 15.04 billion in 2026 to reach USD 18.62 billion by 2031, at a CAGR of 4.36% during the forecast period (2026-2031). Momentum stems from post-pandemic reshoring that redirects freight away from port-centric corridors to regional hubs, coupled with federal rail revitalization that will shorten Melbourne-Brisbane lead times by up to 10 hours. Mandatory Scope-3 disclosure rules now in force for large entities strengthen outsourcing demand for emission-tracked logistics, while retail-media monetization turns delivery networks into data-driven advertising platforms. Ongoing volatility in international container rates encourages dynamic pricing clauses that protect 3PL margins, and AI-enabled load-matching trims empty mileage, improving cost-to-serve on long-haul lanes.
Key Report Takeaways
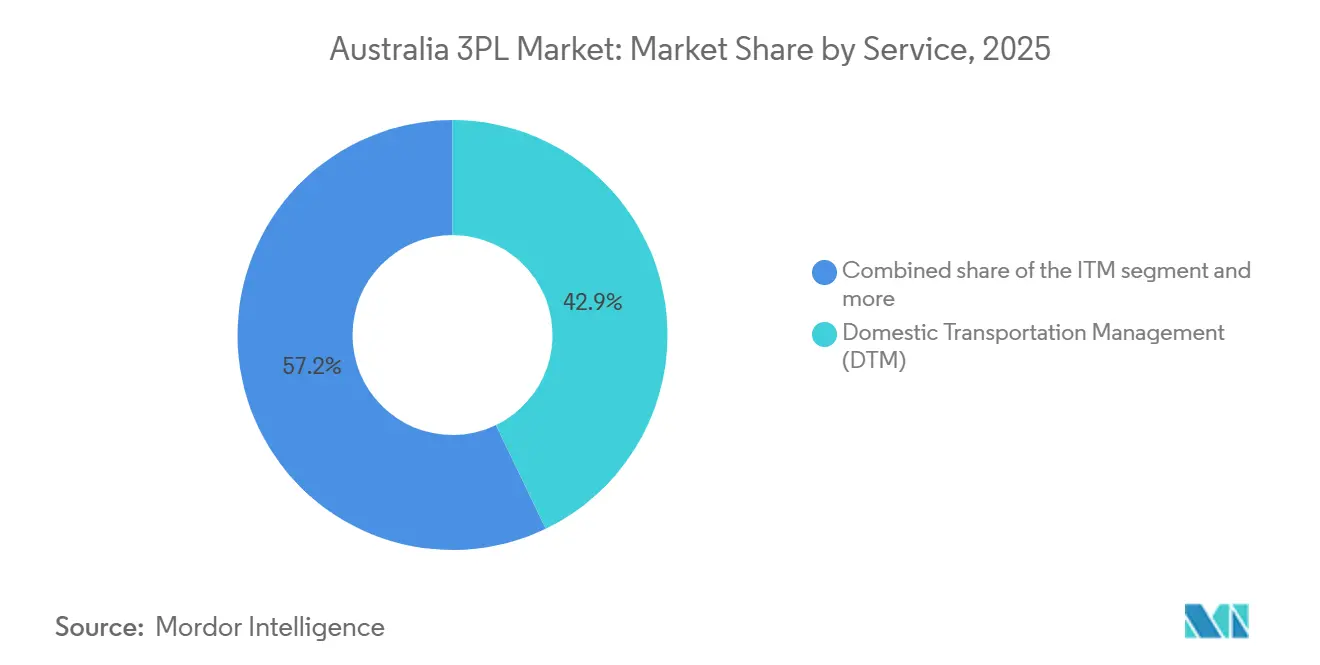
- By service, domestic transportation management captured 42.85% of the Australia 3PL Market share in 2025, and value-added warehousing & distribution is forecast to expand at a 5.47% CAGR through 2031.
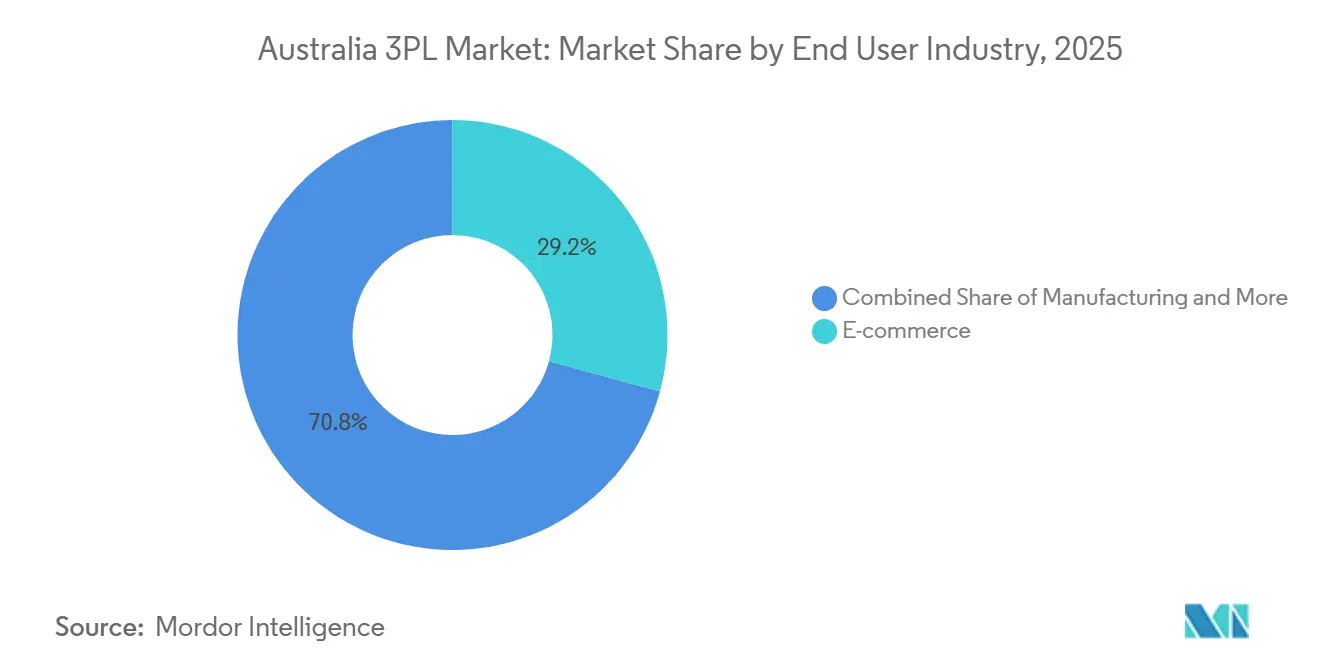
- By end user, retail & e-commerce captured 29.23% of the Australia 3PL Market size in 2025, and life sciences & healthcare is forecast to expand at a 6.23% CAGR through 2031.
- By logistics model, asset-light captured 52.06% of the Australia 3PL Market share in 2025, and hybrid is forecast to expand at a 4.86% CAGR through 2031.
- By region, New South Wales captured 28.11% of the Australia 3PL Market size in 2025, and Queensland is forecast to expand at a 5.02% CAGR through 2031.
Note: Market size and forecast figures in this report are generated using Mordor Intelligence’s proprietary estimation framework, updated with the latest available data and insights as of 2026.
Australia 3PL Market Trends and Insights
Drivers Impact Analysis*
| Driver | (~) % Impact on CAGR Forecast | Geographic Relevance | Impact Timeline |
|---|---|---|---|
| Post-pandemic reshoring driving regional DC build-outs | +0.9% | Victoria, NSW, Queensland | Medium term (2-4 years) |
| Mandatory Scope-3 emissions reporting spurring green 3PL outsourcing | +0.7% | National | Short term (≤ 2 years) |
| Retail-media monetization opening 3PL data-as-a-service revenue | +0.5% | Sydney, Melbourne metros | Long term (≥ 4 years) |
| Federal rail-revitalization grants are unlocking intermodal growth | +0.6% | Inland Rail corridor | Medium term (2-4 years) |
| Cell-ag & meal-kit boom accelerating cold-chain demand | +0.4% | Major metros | Medium term (2-4 years) |
| AI-enabled dynamic load matching reduces deadhead kilometers | +0.3% | National | Short term (≤ 2 years) |
| Source: Mordor Intelligence | |||
Post-Pandemic Reshoring Drives Regional DC Build-Outs
The National Reconstruction Fund’s AUD 15 billion (USD 10.4 billion) injection into advanced manufacturing motivates shippers to locate distribution centers within 50 kilometers of new inland production sites, lowering line-haul costs and enabling just-in-time workflows. Certification under the Australian Made Campaign further deepens demand for transparent, shorter supply chains. As single-site metro warehouses give way to multi-node regional networks, mid-tier providers with legacy sheds in secondary cities secure new contracts at the expense of port-focused incumbents.
Mandatory Scope-3 Emissions Reporting Spurs Green Outsourcing
From FY 2025-26, large entities must quantify upstream and downstream logistics emissions under the Australian Sustainability Reporting Standards, spurring a flight to 3PL partners that offer ISO 14064-verified carbon accounting. Operators respond by electrifying fleets and deploying solar-powered warehouses to comply with the Safeguard Mechanism’s emissions caps. Providers that deliver auditable footprint reports command premium rates and stickier contracts[1]Clean Energy Regulator, “About the Safeguard Mechanism,” CLEANENERGYREGULATOR.GOV.AU.
Retail-Media Monetization Opens Data-as-a-Service Revenue
E-commerce now equals 18% of Australian retail spend, creating millions of delivery touchpoints that 3PLs can commercialize via targeted inserts, product samples, and anonymized route analytics. Building these data platforms requires investment in privacy compliance and customer-data infrastructure, giving scale players a head start. Additionally, 3PLs can leverage these touchpoints to deepen customer engagement, optimize last-mile efficiency, and develop predictive demand models. Smaller players may struggle to compete without similar technology adoption, highlighting the growing importance of data-driven logistics strategies in capturing market share.
Federal Rail-Revitalization Grants Unlock Intermodal Growth
The AUD 14.5 billion (USD 10 billion) Inland Rail will cut Melbourne-Brisbane transits by 10 hours and remove 200,000 annual truck trips, trimming per-unit freight costs by 30% and reducing 750,000 tCO₂-e each year. Rail-connected distribution centers and container handling capabilities are therefore rising on 3PL capex agendas. Beyond cost savings, this shift is expected to drive investments in multimodal infrastructure, improve supply chain reliability, and enable faster, more sustainable delivery solutions. 3PLs that integrate rail-linked hubs early will gain a strategic advantage in servicing high-volume corridors and meeting growing sustainability mandates.
Restraints Impact Analysis*
| Restraint | (~) % Impact on CAGR Forecast | Geographic Relevance | Impact Timeline |
|---|---|---|---|
| Heavy-vehicle driver shortage from an aging workforce | -0.6% | National, acute regional | Short term (≤ 2 years) |
| Cybersecurity vulnerabilities in warehouse control systems | -0.3% | Major metros | Medium term (2-4 years) |
| Volatile container shipping rates are undermining contract pricing | -0.5% | International gateways | Short term (≤ 2 years) |
| Fragmented last-mile regulations across local councils | -0.2% | Sydney, Melbourne, Brisbane | Long term (≥ 4 years) |
| Source: Mordor Intelligence | |||
Heavy-Vehicle Driver Shortage From Aging Workforce
Median driver age is 48, with only 4% female participation, and retirements now outpace new entrants by 4,600 roles annually, eroding road-freight capacity. Larger fleets lure talent with higher wages and newer equipment, accelerating consolidation. This widening talent gap is putting pressure on smaller operators, driving investments in automation, route optimization, and driver retention programs. It also underscores the strategic value of workforce planning and diversity initiatives for 3PLs aiming to maintain service levels and long-term operational resilience[2]Jobs and Skills Australia, “Truck Drivers,” JOBSANDSKILLS.GOV.AU .
Cybersecurity Vulnerabilities in Warehouse Control Systems
IoT-rich facilities expose attack surfaces that ransomware gangs exploit, driving cyber-insurance premiums up 50-100% and compelling providers to fund security operations centers that small rivals cannot match. Beyond insurance costs, this trend is pushing 3PLs to adopt advanced threat detection, employee training programs, and network segmentation to protect sensitive supply chain data. Firms that can scale these cybersecurity investments gain a competitive edge, reassuring clients and mitigating operational disruptions in an increasingly digital logistics landscape.
*Our forecasts treat driver/restraint impacts as directional, not additive. The impact forecasts reflect baseline growth, mix effects, and variable interactions.
Segment Analysis
By Service: Warehousing Integration Reshapes Value Proposition
By service, domestic transportation management captured 42.85% of the Australia 3PL Market share in 2025, and value-added warehousing & distribution is forecast to expand at a 5.47% CAGR through 2031. Growth in value-added services reflects strong client demand for integrated kitting, labeling, and direct-to-consumer fulfillment solutions.
While domestic transportation management remains the largest segment, margin pressures from driver shortages are driving investment in route optimization and alternative-fuel fleets. International transportation management remains smaller due to limited direct lanes, but is benefiting from free-trade expansions. Adoption of predictive analytics via the National Freight Data Hub is enabling smarter modal orchestration and more efficient supply chain planning.


By End User: Healthcare Specialization Commands Premium Pricing
By end user, retail & e-commerce captured 29.23% of the Australia 3PL Market size in 2025, and life sciences & healthcare is forecast to expand at a 6.23% CAGR through 2031. Growth in life sciences reflects rising demand for GDP-validated cold chains to meet stringent regulatory requirements. Retail & e-commerce remains the largest segment but faces cost pressures from same-day and last-mile delivery services.
Manufacturing logistics benefits from reshoring initiatives, while automotive supply chains pivot to comply with battery and EV regulations. Consumer goods increasingly leverage retail-media solutions, and technology & electronics players require reverse-logistics partners to meet stewardship and recycling obligations. At the same time, rising demand volatility and shorter product lifecycles are pushing logistics providers to offer more flexible, tech-enabled solutions, including real-time visibility and agile inventory management.
By Logistics Model: Hybrid Approaches Balance Control and Flexibility
By logistics model, asset-light captured 52.06% of the Australia 3PL market share in 2025, while hybrid models are projected to expand at a CAGR of 4.86% through 2031. Asset-light models continue to be widely preferred due to their flexibility, scalability, and lower capital requirements, enabling shippers to quickly adjust to demand fluctuations without heavy infrastructure investments.
However, hybrid configurations are gaining momentum as customers increasingly seek a balance between flexibility and control, particularly in critical segments such as cold-chain and pharmaceuticals, where capacity assurance and service reliability are essential. This shift is further supported by the growing use of digital twins, advanced analytics, and real-time visibility tools, which help optimize both owned and outsourced assets, enhance network planning, and improve operational resilience.[3]National Freight Data Hub, “nfdh | National Freight Data Hub,” DATAHUB.FREIGHTAUSTRALIA.GOV.AU.
Geography Analysis
By region, New South Wales captured 28.11% of the Australia 3PL Market in 2025, while Queensland is forecast to grow at a 5.02% CAGR through 2031. Limited rail capacity at Port Botany and low industrial-land availability are pushing warehouses into Western Sydney, increasing last-mile costs. Firms are investing in consolidation hubs, automation, and fleet optimization to maintain efficiency.
Queensland’s growth is driven by Inland Rail’s faster Melbourne-Brisbane transit and the Port of Brisbane’s Vision 2060 expansion. Available industrial land and modern distribution centers support e-commerce and retail logistics. Infrastructure upgrades position Queensland as a key gateway for domestic and international flows.
Victoria, Western Australia, South Australia, and smaller jurisdictions play specialized roles. Victoria faces truck congestion near Melbourne’s port, Western Australia relies on Kwinana Port, and South Australia focuses on renewable-manufacturing logistics. Tasmania, the Northern Territory, and the ACT require tailored multimodal solutions under the National Remote and Regional Transport Strategy[4]Transport and Infrastructure Council, “National Remote and Regional Transport Strategy,” DIPL.NT.GOV.AU .
Competitive Landscape
The Australia 3PL market shows low concentration, with the top five players accounting for roughly 45-55% of the total share. Large integrated providers such as Toll Group, DHL Group, and Linfox dominate through extensive networks and end-to-end capabilities, while smaller, specialized firms continue to compete effectively in segments like cold-chain and mining logistics. Scale and network density remain critical advantages, enabling route optimization, cost efficiencies, and consistent service reliability across geographies.
At the same time, competition is increasingly shaped by qualitative factors such as sustainability commitments, adoption of emissions-tracking technologies, and gradual electrification of fleets, which are becoming key differentiators in customer selection. Companies are also leveraging advanced analytics, AI-driven load matching, and data monetization opportunities to enhance operational efficiency and create additional value streams.
Ongoing challenges such as driver shortages and rising cyber risks further highlight the importance of strong workforce strategies and robust digital security capabilities. Overall, providers that effectively combine scale with innovation and sustainability-focused practices are better positioned to strengthen their competitive standing over the long term.
Australia 3PL Industry Leaders
Toll Holdings Limited
Linfox Pty Ltd
DHL Supply Chain (Australia)
DSV
Mainfreight Australia
- *Disclaimer: Major Players sorted in no particular order

Recent Industry Developments
- June 2025: Toll completed the Transolve Global acquisition, boosting international freight forwarding reach.
- June 2025: BHP and Aurizon inked a USD 1.5 billion coal-logistics deal in Queensland.
- May 2025: Lindsay Australia bought SRT Logistics, securing Tasmanian coverage.
- April 2025: DSV closed its USD 23.6 billion purchase of DB Schenker, doubling local scale.


Australia 3PL Market Report Scope
By Service
| Domestic Transportation Management (DTM) | Roadways |
| Railways | |
| Airways | |
| Waterways | |
| International Transportation Management (ITM) | Roadways |
| Railways | |
| Airways | |
| Waterways | |
| Value-Added Warehousing & Distribution (VAWD) |
By End User
| Automotive |
| Energy & Utilities |
| Manufacturing |
| Life Sciences & Healthcare |
| Technology & Electronics |
| E-commerce |
| Consumer Goods & FMCG |
| Food & Beverages |
| Others |
By Logistics Model
| Asset-Light (Management-Based) |
| Asset-Heavy (Own Fleet & Warehouses) |
| Hybrid |
By Region (State / Territory)
| New South Wales |
| Victoria |
| Queensland |
| Western Australia |
| South Australia |
| Tasmania |
| Northern Territory |
| Australian Capital Territory |
| Other Territories |
| By Service | Domestic Transportation Management (DTM) | Roadways |
| Railways | ||
| Airways | ||
| Waterways | ||
| International Transportation Management (ITM) | Roadways | |
| Railways | ||
| Airways | ||
| Waterways | ||
| Value-Added Warehousing & Distribution (VAWD) | ||
| By End User | Automotive | |
| Energy & Utilities | ||
| Manufacturing | ||
| Life Sciences & Healthcare | ||
| Technology & Electronics | ||
| E-commerce | ||
| Consumer Goods & FMCG | ||
| Food & Beverages | ||
| Others | ||
| By Logistics Model | Asset-Light (Management-Based) | |
| Asset-Heavy (Own Fleet & Warehouses) | ||
| Hybrid | ||
| By Region (State / Territory) | New South Wales | |
| Victoria | ||
| Queensland | ||
| Western Australia | ||
| South Australia | ||
| Tasmania | ||
| Northern Territory | ||
| Australian Capital Territory | ||
| Other Territories | ||


Key Questions Answered in the Report
How large will Australia’s 3PL sector be by 2031?
It is projected to reach USD 18.62 billion by 2031, expanding at a 4.36% CAGR from 2026.
Which service segment is growing fastest?
Value-Added Warehousing & Distribution leads with a 5.47% CAGR through 2031.
Why is Queensland the fastest-growing state for logistics?
Inland Rail infrastructure cuts up to 10 hours off Melbourne-Brisbane runs, driving a 5.02% CAGR for Queensland.
What regulation is shaping green logistics demand?
Mandatory Scope-3 emissions disclosure under Australian Sustainability Reporting Standards drives outsourcing to carbon-tracked 3PLs.
How are 3PLs monetizing last-mile data?
Providers sell targeted advertising and insights to brands, turning delivery networks into retail-media channels.
What is the main capacity constraint for road freight?
A nationwide driver shortage, with a median driver age of 48 and declining new entrants, reduces available trucking capacity.
Page last updated on:


