
Market Overview
| Study Period | 2020 - 2031 |
|---|---|
| Market Size (2026) | USD 90.06 Billion |
| Market Size (2031) | USD 120.79 Billion |
| Growth Rate (2026 - 2031) | 6.05 % |
| Fastest Growing Market | Middle East |
| Largest Market | Asia-Pacific |
| Market Concentration | Low |
Major Players *Disclaimer: Major Players sorted in no particular order Image © Mordor Intelligence. Reuse requires attribution under CC BY 4.0. | |
Valves Market Analysis by Mordor Intelligence
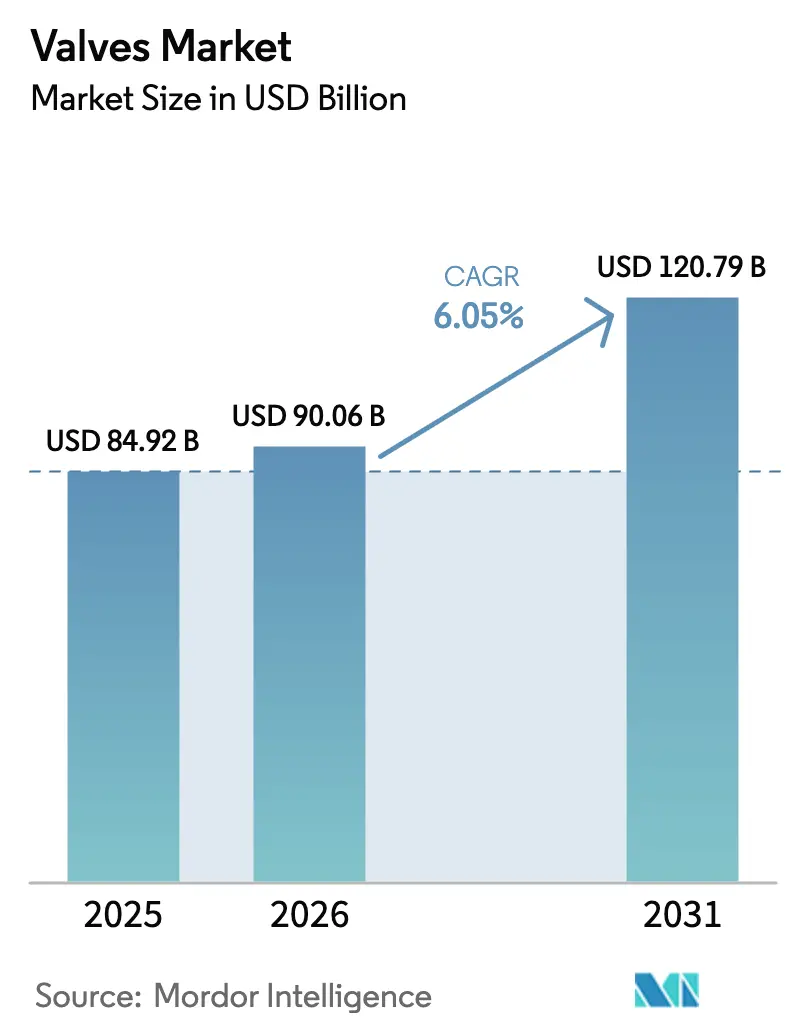
The Valves market size is expected to grow from USD 84.92 billion in 2025 to USD 90.06 billion in 2026 and is forecast to reach USD 120.79 billion by 2031 at 6.05% CAGR over 2026-2031. This market size growth trajectory is anchored in large‐scale infrastructure renovation, the global energy transition, and accelerating industrial automation that together sustain a healthy order pipeline for OEMs and aftermarket suppliers. Public water utilities in North America, provincial agencies in Canada, and urban development authorities in Asia Pacific are channeling multi-billion-dollar allocations into water distribution, wastewater treatment, and district cooling plants, all of which require increasingly sophisticated flow-control assemblies. Simultaneously, oil and gas operators are pairing conventional production projects with carbon-capture systems that mandate premium sealing technologies, while hydrogen developers and modular nuclear reactor consortia are issuing new specifications that favor advanced materials. Competitive intensity remains moderate, with incumbents using targeted acquisitions, regional manufacturing hubs, and digital platforms to defend share against new entrants focused on niche smart-valve solutions.
Key Report Takeaways
- By valve type, ball valves led with 37.10% of the Valves market share in 2025, whereas control valves are forecast to compound at 6.65% CAGR through 2031.
- By material, stainless steel accounted for 45.05% share of the Valves market size in 2025, while cryogenic alloys are expected to post the fastest 7.24% CAGR to 2031.
- By actuation, manual devices retained 54.20% share of the Valves market in 2025; smart electro-hydraulic systems show the highest 7.72% CAGR outlook.
- By end-user, oil and gas captured 26.88% share of the Valves market size in 2025 and hydrogen energy is advancing at a 6.88% CAGR toward 2031.
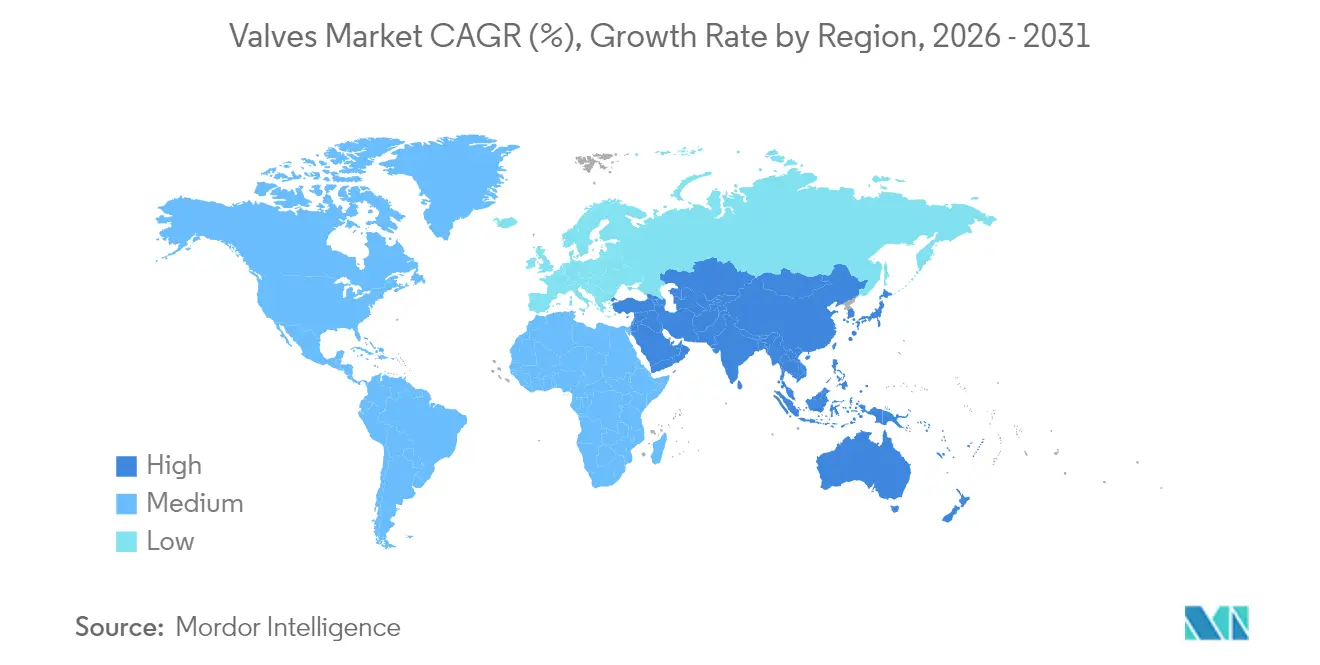
- By geography, Asia Pacific held 37.75% revenue share in 2025; the Middle East is projected to expand at a 7.19% CAGR through 2031.
Note: Market size and forecast figures in this report are generated using Mordor Intelligence’s proprietary estimation framework, updated with the latest available data and insights as of 2026.
Market Trends and Insights
Drivers Impact Analysis of Valves Market*
| Driver | (~) % Impact on CAGR Forecast | Geographic Relevance | Impact Timeline |
|---|---|---|---|
| Rise in infrastructure-related developments | +1.8% | Global - APAC and Middle East core | Medium term (2-4 years) |
| Growing energy projects in oil and gas sector | +1.5% | Middle East, North America, APAC | Medium term (2-4 years) |
| Investments in water and wastewater treatment | +1.2% | Global - early gains in North America and Europe | Short term (≤2 years) |
| Industrial automation and smart valves | +1.1% | North America and EU, spill-over to APAC | Long term (≥4 years) |
| Hydrogen economy build-out | +0.9% | EU, North America, select APAC markets | Long term (≥4 years) |
| Modular nuclear reactors | +0.6% | North America, EU, select APAC markets | Long term (≥4 years) |
| Source: Mordor Intelligence | |||
Rise in Infrastructure-Related Developments
Capital committed to repairing and expanding water networks, expressways, and district energy systems is pulling forward purchasing schedules for valves that deliver tight shut-off, cavitation control, and long service life. Pennsylvania American Water alone programmed USD 586 million in upgrades for 2024-2026, while Ontario approved CAD 970 million (USD 719 million) to reinforce municipal pipelines. Similar headline allocations are appearing in India’s Jal Jeevan Mission and Saudi Arabia’s National Water Strategy, prompting OEMs to localize assembly lines and raise stainless and ductile-iron casting capacities. Urban resilience mandates are also broadening specification sheets to include surge-proof butterfly valves and smart pressure-reducing valves that integrate seamlessly with district SCADA platforms.
Growing Energy Projects in Oil and Gas Sector
Upstream and midstream operators are concentrating capital on complex, high-pressure assets where fugitive-emission compliance and digital performance dashboards are non-negotiable. ADNOC’s decision to entrust Flowserve with dry-gas-seal systems for a 1.5 million ton-per-year carbon-capture installation underscores the premium placed on reliability and engineered sealing.[1]World Oil News Desk, “Flowserve wins ADNOC contract to deploy flow control tech for groundbreaking CCS project,” Worldoil.com As offshore production migrates toward deeper waters, ball and subsea gate valves rated above 15 000 psi are standardizing on all-metal seals and condition-monitoring sensors. Simultaneously, North American shale producers are retrofitting existing sites with low-bleed pneumatic controllers, propelling aftermarket demand for conversion kits and self-diagnosing actuators.
Investments in Water and Wastewater Treatment
Utility boards and industrial processors are modernizing treatment trains to satisfy stricter discharge permits and water-reuse mandates, which in turn elevate the need for corrosion-resistant alloys and precision control valves. Pennsylvania American Water’s multi-year USD 586 million program typifies the upswing in U.S. municipal spending, while European utilities are adopting membrane bioreactors that rely on finely tuned plug and diaphragm valves for chemical-dosing accuracy. Industrial facilities are paralleling municipal upgrades by installing zero-liquid-discharge systems, expanding the installed base for smart positioners capable of remote verification during regulatory audits.
Industrial Automation and Smart Valves
Manufacturers are embedding artificial-intelligence agents and edge-analytics hardware into control-loop components, converting once-manual assemblies into nodes on high-speed industrial networks. Emerson’s AVENTICS Series XV pneumatic valves exemplify this pivot, offering Ethernet-based protocols and universal thread designs for global adoption.[2]Eurotec Editorial, “New Emerson Pneumatic Valves Provide Greater Automation Flexibility,” Eurotec-online.com Predictive algorithms now anticipate stem-seal wear and actuator fatigue, cutting mean-time-to-repair and optimizing spares stocking. Standard bodies such as ISO and NAMUR continue to update connectivity guidelines, ensuring cross-vendor interoperability in brownfield and greenfield environments alike.
Restraints Impact Analysis of Valves Market*
| Restraint | (~) % Impact on CAGR Forecast | Geographic Relevance | Impact Timeline |
|---|---|---|---|
| Volatility in raw-material prices | -0.8% | Global - highest exposure in price-sensitive regions | Short term (≤2 years) |
| Lack of standardized global certification | -0.5% | Global - pronounced in emerging economies | Medium term (2-4 years) |
| Cyber-security risks in intelligent valves | -0.3% | North America and EU | Medium term (2-4 years) |
| Seal material supply-chain concentration | -0.4% | Global - acute in specialty PTFE grades | Short term (≤2 years) |
| Source: Mordor Intelligence | |||
Volatility in Raw-Material Prices
Stainless and alloy-steel indices vacillated sharply throughout 2024, challenging OEMs whose contracts feature multi-year delivery windows and capped escalation clauses. Producers responded by widening supplier pools, forward-buying billet, and substituting near-equivalent alloys, but these tactics inflate working-capital needs and introduce qualification lead times. Pricing turbulence hits entry-level butterfly and gate valves hardest because end-users resist pass-throughs, forcing manufacturers to absorb margin erosion until spot markets stabilize.
Lack of Standardized Global Certification
Fragmented compliance frameworks compel manufacturers to repeatlab tests for identical designs, elongating commercialization cycles and inflating engineering budgets. ISO 5640:2024 provides harmonized terminology, yet adoption across major notified bodies remains uneven, leaving exporters to navigate distinct fire-testing, fugitive-emission, and functional-safety regimes.[3]Victoria Bell, “Global Regulatory Challenges for Medical Devices: Impact on Innovation and Market Access,” MDPI.com Smaller firms often defer market entry where certification costs exceed potential revenues, inadvertently reducing purchasing options for buyers in emerging economies.
*Our forecasts treat driver/restraint impacts as directional, not additive. The impact forecasts reflect baseline growth, mix effects, and variable interactions.
Valves Market Segment Analysis
By Valve Type:
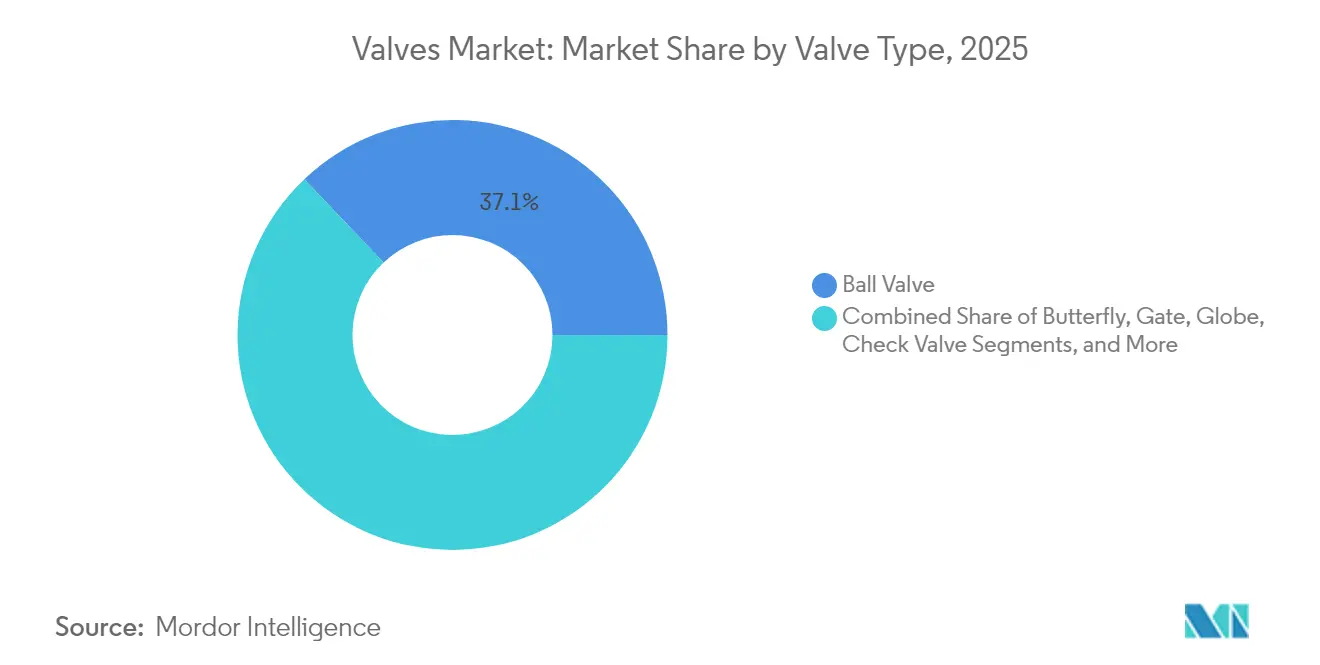
Control Valves Drive Automation TransitionBall valves retained the highest 37.10% valves market share in 2025 on the strength of their low-torque operation and multi-port versatility. Control valves are projected to lead growth at a 6.65% CAGR because continuous process industries increasingly specify digital positioners for tighter loop control. This preference lifts the valves market size allocation for advanced globe, V-port ball, and rotary plug designs in chemical and power plants. The integration of self-diagnostics into control-valve assemblies is helping operators cut unscheduled downtime, translating into measurable productivity gains.
Product innovation is visible across all major styles: butterfly valves are adopting triple-offset geometries to enhance zero-leak bi-directional sealing, while gate valves destined for subsea positions feature non-intrusive actuators to simplify maintenance. Flowserve’s European patent covering high-temperature packing materials demonstrates how R and D continues to push safe operating envelopes beyond 1 200°F. Meanwhile, check-valve makers are re-engineering disc profiles for lower pressure drop, responding to energy-efficiency targets in pipeline transport.



By Material:
Cryogenic Applications Accelerate Specialty AlloysStainless steel’s 45.05% presence in 2025 underlines its status as the default alloy for general service across refineries, desalination, and food processing installations. However, LNG export terminals and liquid hydrogen pilot plants are propelling a 7.24% CAGR in cryogenic alloys such as 9% nickel and austenitic-stainless variants, expanding the Valves market size for specialty forgings. Carbon-steel grades continue to compete in room-temperature water and non-corrosive gas lines where budget discipline dominates procurement decisions.
Additive manufacturing is gradually penetrating niche severe-service applications, with SAMSON earning the first EU certificate for pressure equipment produced via powder-bed fusion. This breakthrough allows intricate flow paths that reduce turbulence and erosion inside globe-valve bodies. Plastic valves, traditionally capped by temperature limits, are also progressing via new fluoropolymer blends that tolerate up to 120 °C, widening their remit in chlor-alkali and semiconductor wet benches.
By Actuation Type:
Smart Systems Transform Traditional OperationsManual hand-wheel and lever mechanisms still commanded 54.20% of 2025 shipments because many isolation points in water distribution, irrigation, and utility services remain price sensitive. Yet smart electro-hydraulic units combining piston force with electronic servo control are forecast to lift their slice of the Valves market share to capitalize on an 7.72% CAGR, spearheaded by offshore and mining clients seeking fail-safe functionality and remote diagnostics. Electric actuators gain momentum in life-science and data-center cooling systems where precise throttling offsets energy intensity.
Pneumatic platforms are not immune to digitalization: Emerson’s XV family now embeds EtherNet/IP and PROFINET nodes, slashing commissioning hours in modular skids. Retrofit solutions such as Imtex Controls’ SIL-3 smart PST devices enable brownfield plants to overlay partial-stroke testing onto legacy ESD valves without removing them from line, thereby lowering shutdown risk. Hydraulic cylinders are likewise adopting embedded pressure sensors to flag seal wear before catastrophic oil loss occurs.

By End-User Vertical:
Hydrogen Energy Reshapes Demand PatternsOil and gas dominated the 2025 customer mix with 26.88% share, a testament to ongoing wellhead, pipeline, and downstream maintenance cycles. However, project announcements for electrolyzers, ammonia crackers, and liquid-hydrogen storage spheres are steering a 6.88% CAGR for hydrogen deployments, swelling the Valves market size in cryogenic globe and high-integrity ball categories. Power-generation orders are increasingly diversified, covering supercritical coal upgrades, combined-cycle gas units, and geothermal brine control, each demanding distinct trim materials and coatings.
Chemical producers are pairing capacity debottlenecking with low-carbon mandates, illustrated by IMI’s scope on the first net-zero ethylene cracker where fugitive-emission class A stem seals are compulsory. Mining outfits in Australia and Latin America continue procuring slurry knife-gate valves with hardened seats to withstand 55% solids by weight. Food and beverage processors, driven by hygiene codes, are specifying polished stainless diaphragm valves, while pharma-biotech labs favor single-use plastic assemblies to accelerate changeovers.
Geography Analysis
APAC Valves Market
Asia Pacific maintained a commanding 37.75% Valves market share in 2025 on the back of aggressive infrastructure expansion in China and India, including water metros, mega-refineries, and semiconductor fabs. Regional governments allocate multi-year budgets to high-speed rail corridors and flood-control reservoirs, each generating high-volume requisitions for isolation and control devices. Japan’s nuclear restart program is also refreshing demand for Class-1 safety valves certified under the ASME BPVC, whereas South Korea’s smart-factory agenda boosts uptake of digitally native actuators. Australia’s LNG backfill projects and Indonesia’s nickel-processing plants further underpin regional volume.
Middle East Valves Market
The Middle East is projected to record the fastest 7.19% CAGR through 2031, energized by Saudi Arabia’s Vision 2030 diversification, Qatar’s LNG North Field expansion, and the United Arab Emirates’ renewable desalination investments. Emerson’s decision to establish a Saudi manufacturing hub signals the region’s pivot from import reliance toward localized supply that meets in-kingdom content quotas. Carbon-capture initiatives such as ADNOC’s 1.5 million tonnes per year project are specifying ultra-low-emission valve assemblies, opening premium opportunities for engineered packages from Flowserve and Velan.
North America and Europe Valves Market
North America combines mature installed bases with technology refresh cycles, particularly in shale gas gathering networks where ventless pneumatic controllers are retrofitted to curb methane intensity. Federal infrastructure grants under the U.S. Bipartisan Infrastructure Law accelerate municipal water replacement, keeping butterfly-valve and air-release product lines buoyant. Europe’s decarbonization roadmap channels funds to hydrogen corridors and CCS clusters, pushing cryogenic and high-alloy inquiries. Eastern European markets, rebuilding district heating grids, create incremental adoption of triple-eccentric butterfly valves with thermal-cycling durability.

Regulatory Landscape
Valve design, manufacturing, and market access are shaped by safety, emissions, and materials compliance requirements that vary by end use and region. In Europe, the Pressure Equipment Directive (PED) 2014/68/EU anchors conformity assessment for pressure-retaining components across power, process, and energy applications, while standards bodies such as ISO and NAMUR continue refining terminology and connectivity guidance that affects qualification of intelligent control valves and actuators.
Environmental and chemical compliance adds additional constraints, especially around fugitive-emission performance and substance restrictions. Measures targeting methane and other process emissions are pushing operators toward low-leakage packing, tighter shutoff, and in some cases electrification of actuation to avoid vented pneumatics. Supplier policies, including Alfa Laval's Restricted Substance List (aligned to EU REACH Annex XVII under EC 1907/2006), also shape elastomer selection, coatings, and documentation across global supply chains.
Value Chain Analysis
The valves value chain runs from raw materials (stainless steel, carbon/alloy steels, and specialty cryogenic alloys) through casting or forging, machining, surface treatment, assembly, and testing. Downstream, qualification and certification are key value-add steps, with channel partners such as EPCs, distributors, and OEM integrators relying on application-specific approvals.
Beyond hardware, differentiation is increasingly tied to automation integration and lifecycle service enablement. Actuation and controls suppliers embed electro-pneumatic hardware, including integrated I/P converters for precision control, and add digital layers such as IIoT condition monitoring. Flowserve's RedRaven valves monitoring approach, for example, connects installed assets to predictive maintenance workflows, supporting aftermarket diagnostics, retrofits, and spares planning alongside traditional repair and overhaul.
Competitive Landscape
The top five suppliers control roughly 35% of global revenues, reflecting a moderate concentration where scale advantages must coexist with diverse regional and application-specific challengers. Flowserve’s USD 290 million purchase of MOGAS in 2024 strengthened its severe-service lineup, particularly for metal-seated ball valves employed in delayed-coker and HP acid-gas facilities. Emerson secured a five-year global framework with Shell that positions it as main automation contractor across upstream and downstream capital projects, underscoring how digital ecosystems now shape procurement.[5]Reliable Plant Staff, “Emerson, Shell sign five-year global agreement for technologies and services,” Reliable Plant, reliableplant.com Parker Hannifin continues to cross-sell instrumentation valves into its filtration and fluid-connectors customer base, leveraging enterprise accounts for bundled solutions.
Smaller firms exploit agility by targeting high-growth niches like hydrogen refueling or single-use biotech equipment, often collaborating with additive-manufacturing specialists to shorten prototype cycles. OEMs universally invest in IoT suites that pair edge controllers with cloud analytics, aiming to monetize performance-as-a-service contracts. Service arms that provide field retrofits, predictive diagnostics, and seal refurbishment are transforming revenue mix, cushioning cyclical swings in original equipment demand. Barriers to entry remain high in nuclear and subsea qualifiers, where multi-year Type Test certifications and track records limit new participation.
Valves Industry Leaders
Emerson Electric Co.
Alfa Laval Corporate AB
Flowserve Corporation
Crane Company
Schlumberger N.V.
- *Disclaimer: Major Players sorted in no particular order

Valves Market Companies Covered in this Report
- Emerson Electric Co.
- Flowserve Corporation
- Schlumberger N.V.
- Alfa Laval AB
- Crane Company
- Rotork plc
- IMI plc
- SAMSON AKTIENGESELLSCHAFT
- KITZ Corporation
- Spirax-Sarco Engineering plc
- AVK Holding A/S
- Velan Inc.
- Metso Oyj
- Baker Hughes Company
- Parker Hannifin Corporation
- The Weir Group PLC
- OMB Valves S.p.A.
- Cla-Val Co.
- CIRCOR International Inc.
- Curtiss-Wright Corporation
- Neway Valve (Suzhou) Co., Ltd.

Market Opportunities and Future Outlook
Hydrogen, LNG, and other cryogenic service lines are widening the addressable need for top-entry, low-leakage control valves and validated cryogenic trims. In these applications, procurement decisions place emphasis on leakage performance and maintainability in cold-box and liquefaction duty cycles. Emerson's April 2026 introduction of a Fisher IC2 top-entry cryogenic control valve for hydrogen liquefaction and LNG applications points to continued supplier investment in this niche, reinforcing demand for specialty alloys, cryogenic testing capacity, and packaged control-valve assemblies.
Power and nuclear end markets also create pockets of opportunity for suppliers able to meet demanding qualification regimes and deliver complete engineered valve portfolios, including severe-service and safety-related scopes. Flowserve's June 2026 completion of its acquisition of Trillium Flow Technologies Valves Division reflects strategic repositioning toward nuclear and traditional power valve categories. Meanwhile, digital retrofit and monitoring programs, including non-proprietary protocol support such as OPC UA and MQTT in condition-monitoring offerings, align with brownfield demand where owners prioritize reliability, emissions compliance, and reduced downtime without full rip-and-replace projects.
Recent Industry Developments in Valves Market
- June 2026: Flowserve Corporation completed the acquisition of Trillium Flow Technologies Valves Division. The consolidation in flow-control for nuclear and power end markets strengthens Flowserve's portfolio and bidding power on large-scale projects. The expanded capabilities sharpen its competitive position in high end nuclear and power sector opportunities.
- April 2026: Emerson Electric Co. released Fisher SVX Steam Conditioning Valve for turbine bypass systems and power plants. The development enhances high-pressure, high-temperature valve capabilities for energy infrastructure. The expansion broadens Emerson's footprint in critical steam conditioning and power plant applications.
- January 2026: Crane Company completed the acquisition of optek-Danulat. The move strengthens cryogenic and process instrumentation capabilities. It adds specialty cryogenic measurement and processing capacity to Crane’s valve ecosystem.


Valves Market Report Scope and Research Methodology
Market Definition and Coverage
For this methodology, the valves market is defined as revenue earned from valves sold for controlling the flow and pressure of liquids and gases across industrial and utility systems, counted at the manufacturer level and reported in current USD.
Scope exclusions: We exclude actuators, sensors, and installation-only services unless they are bundled and priced as part of the valve product shipment.
Segments Covered in This Report
- By Valve Type
- Ball Valve
- Butterfly Valve
- Gate Valve
- Globe Valve
- Check Valve
- Plug Valve
- Control Valve
- Other Valve Types
- By Material
- Stainless Steel
- Carbon Steel
- Alloy Steel
- Cryogenic
- Plastic
- Other Materials
- By Actuation Type
- Manual
- Electric
- Pneumatic
- Hydraulic
- Smart (Electro-hydraulic)
- Other Actuation Types
- By End-User Vertical
- Oil and Gas
- Power Generation
- Chemical
- Water and Wastewater
- Mining
- Other End-User Verticals
- By Geography
- North America
- United States
- Canada
- Mexico
- South America
- Brazil
- Argentina
- Rest of South America
- Europe
- Germany
- United Kingdom
- France
- Italy
- Spain
- Russia
- Rest of Europe
- Asia Pacific
- China
- Japan
- India
- South Korea
- Australia and New Zealand
- Rest of Asia Pacific
- Middle East
- Saudi Arabia
- United Arab Emirates
- Turkey
- Rest of Middle East
- Africa
- South Africa
- Nigeria
- Egypt
- Rest of Africa
- North America
Data Sources, Market Sizing, and Validation
Desk Research
Desk research set the structure for the model and helped us avoid mixing valve demand with adjacent flow-control hardware. We used public references such as US Energy Information Administration (EIA) project and throughput statistics, Eurostat industrial production indices, UN Comtrade trade codes for relevant valve categories, and World Bank infrastructure and utility investment indicators to anchor demand signals in a directionally sound way.
To keep the assumptions practical, we also reviewed company annual reports and investor presentations, trade association material (for general valve and pump associations), and reputed industry press that tracks large projects in oil and gas, chemicals, water, and power. Where useful, paid subscriptions were used for company financials and news screening, patent searches on valve designs and materials, and shipment-level import-export checks in selected countries. These sources are illustrative and not exhaustive, and we consulted additional references to collect, validate, and clarify the data points used in the analysis.
Primary Interviews and Surveys
Primary work focused on validating what drives spending by valve type and where pricing has moved, particularly for severe service applications. We spoke with OEM and channel participants, EPC-facing stakeholders, and end users across oil and gas, power, chemicals, water and wastewater, and general industry, then rechecked assumptions region by region so the global picture stays consistent.
Distribution of primary research fieldwork respondents
| Company type | Respondent position | Region |
|---|---|---|
| Top tier: 32% | CXOs: 16% | APAC: 46% |
| Mid tier: 46% | Functional/Unit leaders: 37% | EMEA: 34% |
| Smaller Players: 22% | Managers: 47% | Americas: 20% |
Market-Sizing & Forecasting
The core sizing logic uses a top-down and bottom-up blend, where top-down demand pools are reconstructed from industry activity and asset spending, then reconciled with selective supply-side checks. In practice, we start from end-market capex and operating activity in water and wastewater networks, power generation, upstream and midstream oil and gas, chemicals, and general manufacturing, and then apply valve intensity and replacement cycles to convert activity into valve spending.
A few market fingerprints were used as repeatable inputs, including project commissioning timelines, maintenance turnaround frequency, the split between manual and automated actuation in new builds, the mix shift between commodity valves and severe service valves, and material preference changes tied to corrosion and temperature requirements. We also tracked pricing direction using sampled quote discussions, observed alloy and casting cost movements, and typical lead-time behavior, then converted these into ASP progressions that fit each region's demand profile. For forecasting, scenario analysis was used so growth reflects different paths for energy investment, water infrastructure budgets, and industrial production, and the chosen scenario is aligned to the most consistent expert consensus from interviews. When bottom-up signals are incomplete in smaller countries, we fill gaps using trade proxies and per-asset consumption ratios, followed by a reasonableness check against installed base and industrial output trends.
Data Validation & Update Cycle
Validation is done through triangulation across independent views of the same demand, so large variances get flagged early rather than being hidden inside totals. We compare model outputs with checkpoints such as regional industrial production, energy and utility project pipelines, trade flows for relevant valve categories, and company-reported order commentary, then review and correct anomalies with clear notes.
Before sign-off, the work goes through multi-step internal reviews that test arithmetic accuracy, assumption consistency across regions, and whether pricing and volume drivers move in the same direction as known market signals. If a major variance shows up, analysts re-contact select respondents to confirm whether it reflects a real market shift or a one-off data point. Reports are refreshed annually, with interim updates when material events occur, and a final pre-delivery pass is performed so clients receive the latest view.
Mordor Intelligence's Global Valves Market Size Measured Against Other Published Estimates
Published numbers for the valves market can look far apart even when the time period is similar, because each publisher draws the line differently on what counts as a valve sale and how pricing is treated. Differences usually come from scope inclusions, the way end-market demand is reconstructed, and how quickly assumptions get updated when industries change course.
The main gap comes from whether valve-adjacent hardware and services are bundled into the total, where Mordor Intelligence counts only valve product revenues and keeps actuators and installation outside the core value unless they are inseparable in the shipped price. Other common drivers are how severe service pricing is escalated (spot materials versus contract lag), whether aftermarket replacement cycles are modeled explicitly, and whether currency conversion is kept consistent across regions and years.
Benchmark comparison
| Source | Market Size | Gaps in Research Methodology |
|---|---|---|
| Mordor Intelligence | USD 84.92 B (2025) | |
| Global Consultancy A | USD 92.30 B (2025) | This estimate appears to fold in valve packages that include actuator and controls value in a wider flow-control basket, which lifts totals in automation-heavy end uses. |
| Trade Journal B | USD 79.10 B (2025) | This figure looks more conservative because it leans on industrial production proxies with limited normalization for project-driven demand and it applies flatter ASP movement across regions. |
The spread in the table mostly traces back to what is counted as a valve sale and how pricing and replacement demand are translated into revenue. By keeping the variables tied to observable industrial activity, project timing, and realistic ASP progression checks, the approach stays transparent and can be repeated when new public signals and interview inputs come in.


Key Questions Answered in the Report
What is the forecast value of the Valves market by 2031?
The Valves market is projected to reach USD 120.79 billion by 2031.
Which valve type is expected to grow fastest through 2031?
Control valves show the highest growth trajectory at a 6.65% CAGR.
Which region will record the quickest expansion in valve demand?
The Middle East leads with a projected 7.19% CAGR driven by energy diversification and carbon-capture investments.
Why are cryogenic alloys gaining share?
LNG and hydrogen projects require valves that maintain toughness at -196 °C, spurring a 7.24% CAGR in cryogenic materials.
How is industrial automation reshaping actuation choices?
Smart electro-hydraulic systems combining high force and digital connectivity are growing at an 7.72% CAGR as plants pursue predictive maintenance.
What factor most restrains short-term growth?
Volatile raw-material prices cut margins and delay project awards, subtracting an estimated 0.8% from the forecast CAGR.
Page last updated on:


 Your data is secure and never sold or shared.


