
Technology, Media and Telecom
5th MayPricing Strategy for Semiconductor Components
3 Min Read
The Slot Machine Market Report is Segmented by Product Type (Mechanical Reels, Video / Digital Reels, Multi-Game / Hybrid Cabinets, and Skill-Based and Arcade-Style Slots), Technology Platform (Standalone, Server-Based Gaming, Remote Game Server, and More), Payout and Payment Mechanism (Coin Operated, Ticket-In-Ticket-Out (TITO), Cashless Card / Mobile Wallet, and Cryptocurrency Enabled Slots), and Geography.
Market Overview
| Study Period | 2020 - 2031 |
|---|---|
| Market Size (2026) | USD 11.47 Billion |
| Market Size (2031) | USD 17.01 Billion |
| Growth Rate (2026 - 2031) | 8.18 % CAGR |
| Fastest Growing Market | Asia Pacific |
| Largest Market | North America |
| Market Concentration | Medium |
Major Players *Disclaimer: Major Players sorted in no particular order. Image © Mordor Intelligence. Reuse requires attribution under CC BY 4.0. |
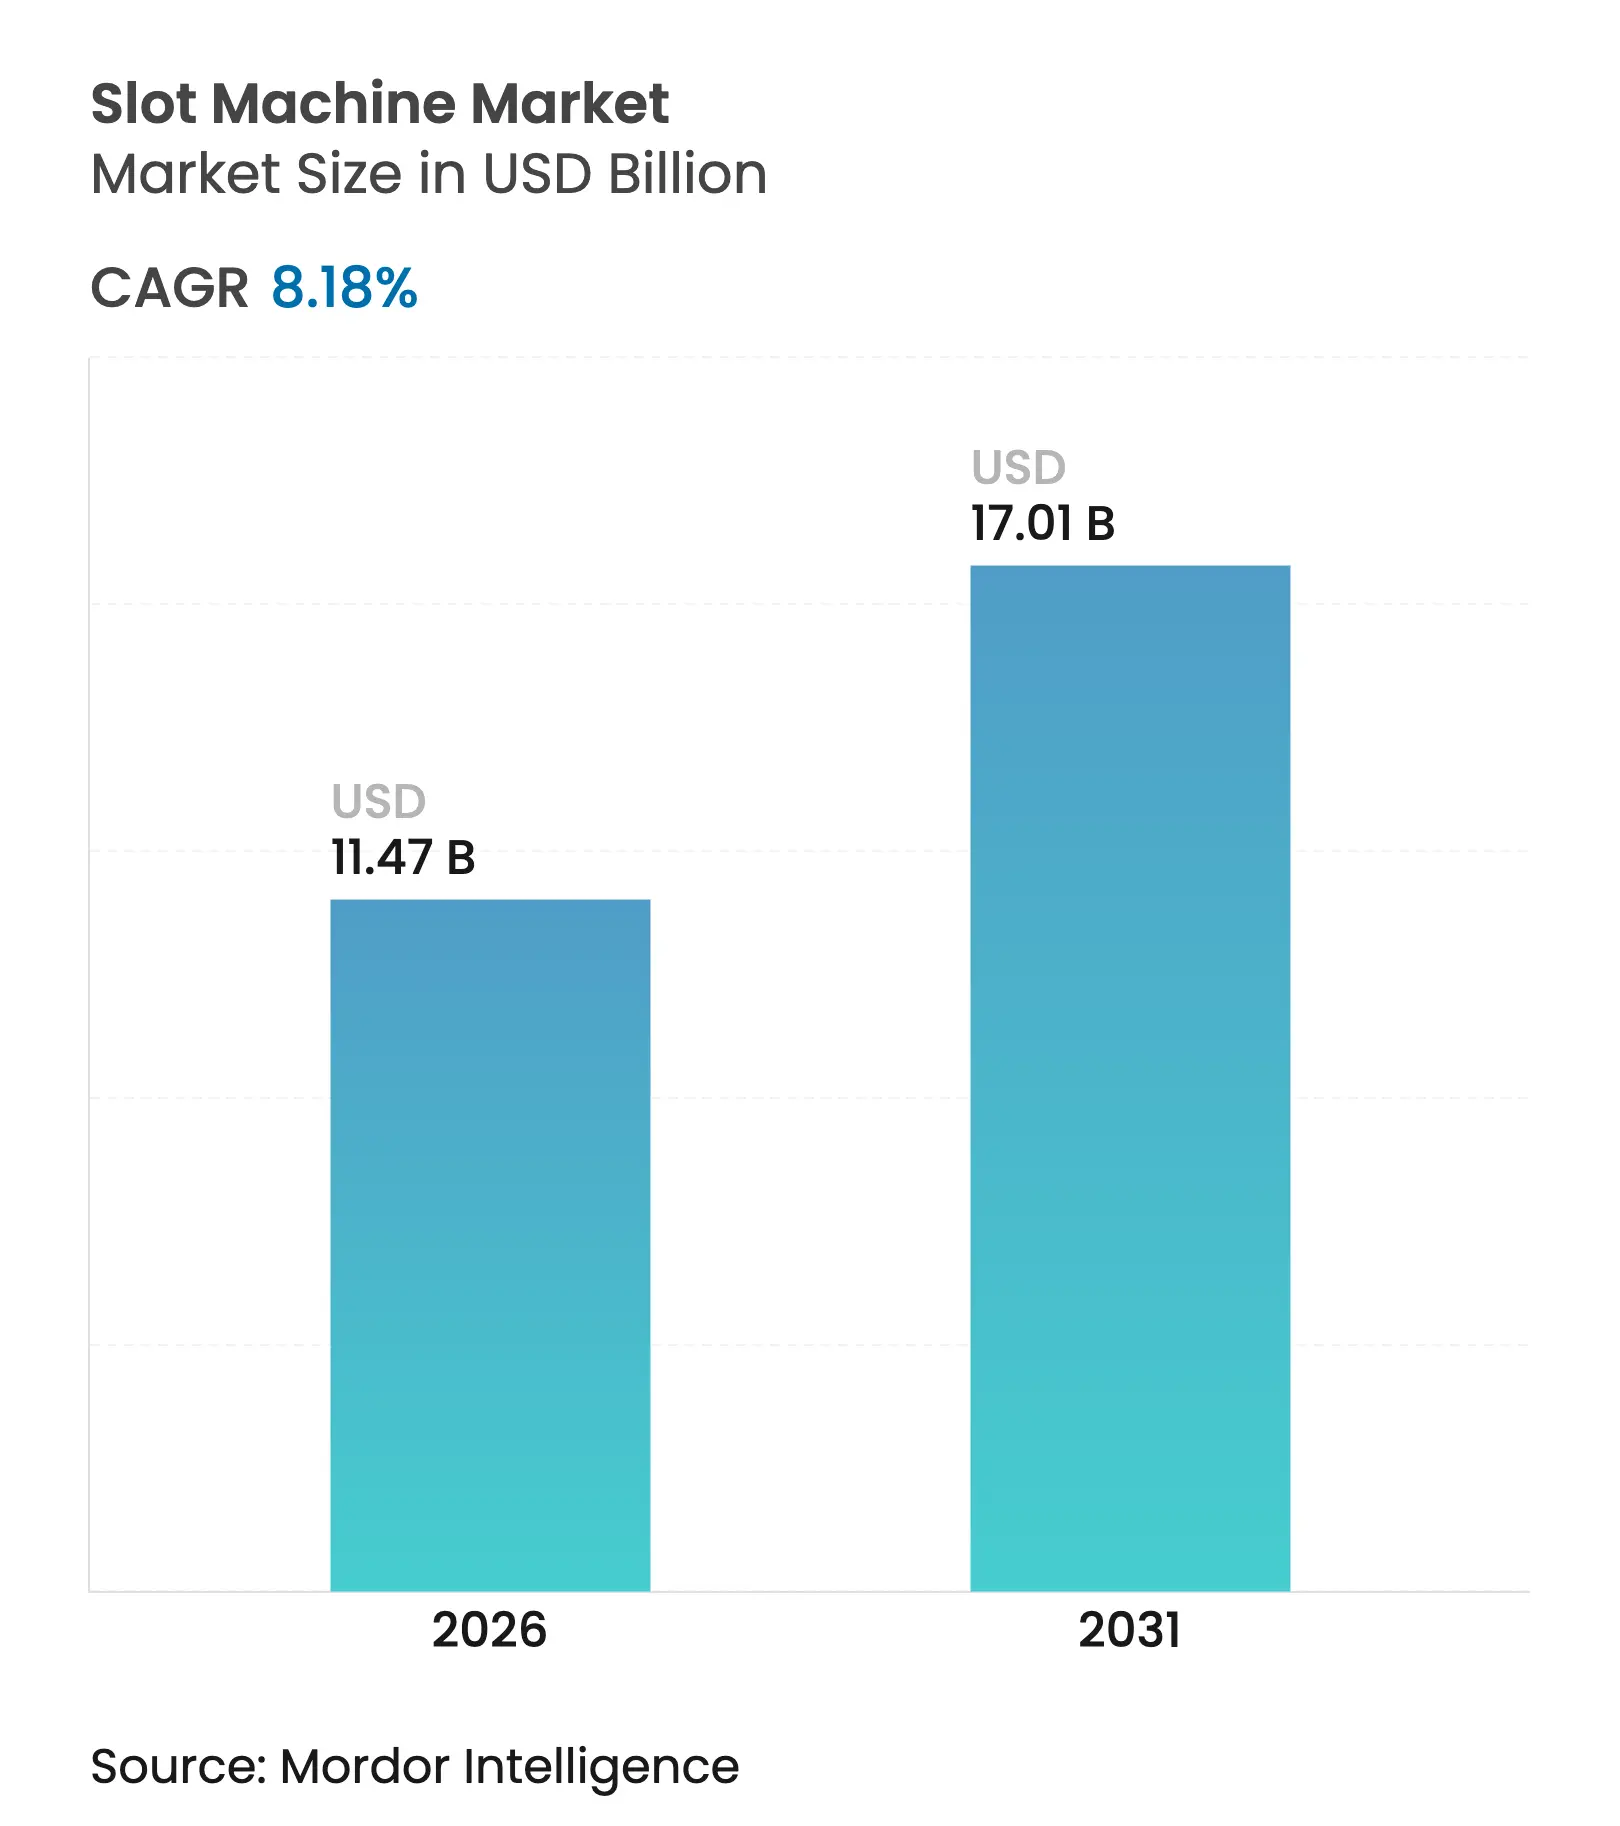
Slot machine market size in 2026 is estimated at USD 11.47 billion, growing from 2025 value of USD 10.60 billion with 2031 projections showing USD 17.01 billion, growing at 8.18% CAGR over 2026-2031. Growth stems from rising deployment of server-based gaming systems, rapid acceptance of cashless and cryptocurrency payments, and the steady expansion of regulated iGaming channels that allow manufacturers to monetize content across both physical and digital venues. The democratization of cloud infrastructure cuts operating costs for casino operators, while artificial-intelligence engines now personalize reel configurations to sustain player engagement. Consolidation among top suppliers is reshaping the competitive order, as new scale advantages help firms absorb higher compliance expenses and semiconductor constraints. Changes in player demographics reinforce the momentum because younger visitors show a clear preference for omnichannel experiences that blend on-premise slots with mobile wallets and online progression systems.
Key Report Takeaways
Note: Market size and forecast figures in this report are generated using Mordor Intelligence's proprietary estimation framework, updated with the latest available data and insights as of 2026.
Drivers Impact Analysis
| Driver | (~) % Impact on CAGR Forecast | Geographic Relevance | Impact Timeline | |||
|---|---|---|---|---|---|---|
Adoption of cashless
and TITO systems
Adoption of cashless
and TITO systems
| +1.8% | North America and Europe lead, global diffusion follows | Medium term (2-4 years) |
(~) % Impact on
CAGR Forecast
:
+1.8%
|
Geographic
Relevance
:
North America and
Europe lead, global diffusion follows
|
Impact Timeline
:
Medium term (2-4
years)
|
Surge in
server-based slot machines (SBG)
Surge in
server-based slot machines (SBG)
| +2.1% | North America and Asia-Pacific core, gradual European uptake | Long term (≥ 4 years) | |||
Expansion of
regulated iGaming markets
Expansion of
regulated iGaming markets
| +1.5% | Europe and North America drive, Asia-Pacific emerging | Medium term (2-4 years) | |||
AI-driven adaptive
game mechanics
AI-driven adaptive
game mechanics
| +1.2% | Global, premium installations first | Long term (≥ 4 years) | |||
Cryptocurrency
payment enablement
Cryptocurrency
payment enablement
| +0.9% | Varies by jurisdiction | Short term (≤ 2 years) | |||
ESG-compliant
modular cabinet demand
ESG-compliant
modular cabinet demand
| +0.4% | Europe and North America primarily | Long term (≥ 4 years) | |||
| Source: Mordor Intelligence | ||||||
Surge in server-based slot machines (SBG)
Server-based architecture lets operators push new titles, denominations, and payout tables to every connected cabinet in seconds, trimming floor re-configuration labor by up to 30% IGT. Real-time analytics from these networks give game designers granular visibility into session length, bet size, and churn, informing faster theme refresh cycles. Cloud variants of SBG lower on-premise hardware footprints and simplify jurisdictional compliance through centralized reporting. The roll-out demands robust cyber-resilience protocols, yet operators continue to invest because unified control markedly enhances floor yield and customer segmentation potential.
Adoption of cashless and TITO systems
Ticket-in-ticket-out modules such as Everi’s QuikTicket and IGT’s EZ Pay remove coin handling, reduce hopper maintenance, and shorten queue times. Guests at Yaamava’ Resort and Casino, for example, can load up to USD 2,000 onto a single transport ticket, speeding play cycles while feeding loyalty databases. Pandemic hygiene concerns accelerated contactless behavior, and regulators such as the Colorado Limited Gaming Control Commission now embed TITO safeguards into rulebooks. Operators view the systems as foundations for mobile-wallet integration that supports personalized offers and cross-property spend tracking.
Expansion of regulated iGaming markets
Legalization of online slots in additional U.S. states and continuing liberalization across Europe open dual-channel revenues that complement casino floors. Inspired Entertainment already manages more than 34,000 digital terminals through its server-based networks, demonstrating the scalability of omnichannel content distribution. New entrants partner with land-based brands to access captive loyalty pools, while existing manufacturers reuse cabinet mathematics inside certified random-number-generator games, slashing development costs and time to market. Emerging Asian jurisdictions observe these frameworks as they draft their own regulations, suggesting a widening global addressable base.
AI-driven adaptive game mechanics
Machine-learning engines analyze spin sequences in real time, adjusting volatility curves or triggering bespoke bonus games when engagement signals dip. These personalization layers increase time-on-device and help operators identify early indicators of problem play, supporting responsible-gaming mandates. Cabinets fitted with advanced graphics cards process predictive models locally, while cloud back ends aggregate wider behavioral data for model training. Suppliers expect AI to move beyond retention toward dynamic yield management, where stake limits and RTP settings flex with risk scoring under regulator-approved guardrails.
Restraint Impact Analysis
| Restraint | (~) % Impact on CAGR Forecast | Geographic Relevance | Impact Timeline | |||
|---|---|---|---|---|---|---|
Tightening license
and regulatory caps
Tightening license
and regulatory caps
| -1.4% | Global, intensity varies | Medium term (2-4 years) |
(~) % Impact on
CAGR Forecast
:
-1.4%
|
Geographic
Relevance
:
Global, intensity
varies
|
Impact Timeline
:
Medium term (2-4
years)
|
Higher AML
compliance and taxation costs
Higher AML
compliance and taxation costs
| -0.8% | Strongest in developed markets | Short term (≤ 2 years) | |||
Boomers ageing-out
vs slow millennial uptake
Boomers ageing-out
vs slow millennial uptake
| -1.1% | North America and Europe | Long term (≥ 4 years) | |||
Cyber-security risks
in networked SBG
Cyber-security risks
in networked SBG
| -0.6% | Global, focus on connected estates | Medium term (2-4 years) | |||
| Source: Mordor Intelligence | ||||||
Tightening license and regulatory caps
Japan’s Ministry of Internal Affairs and Communications convened expert panels in 2025 to explore ISP-level blocking of unauthorized online casinos, signaling stricter oversight even before land-based resorts open. Similar debates in other jurisdictions push compliance costs upward and lengthen approval cycles, which slows cabinet refresh programs. Fee structures that exceed USD 1 million per venue create barriers for small operators, encouraging further consolidation. Suppliers must navigate a complex mosaic of technical standards and responsible-gaming mandates, diverting capital toward legal and governance functions rather than pure R&D.
Higher AML compliance and taxation costs
Casinos handle high-velocity cash and digital flows, prompting regulators to increase reporting thresholds and mandate real-time monitoring of suspicious activity. Upgrades to transaction-monitoring software and expanded KYC processes add direct expense while lengthening onboarding for players. Several U.S. states raised gaming taxes in 2024, narrowing operator margins and reducing available budgets for new cabinet purchases. Manufacturers respond by bundling compliance modules inside management systems to preserve equipment sales, yet elevated cost of ownership tempers near-term order books.
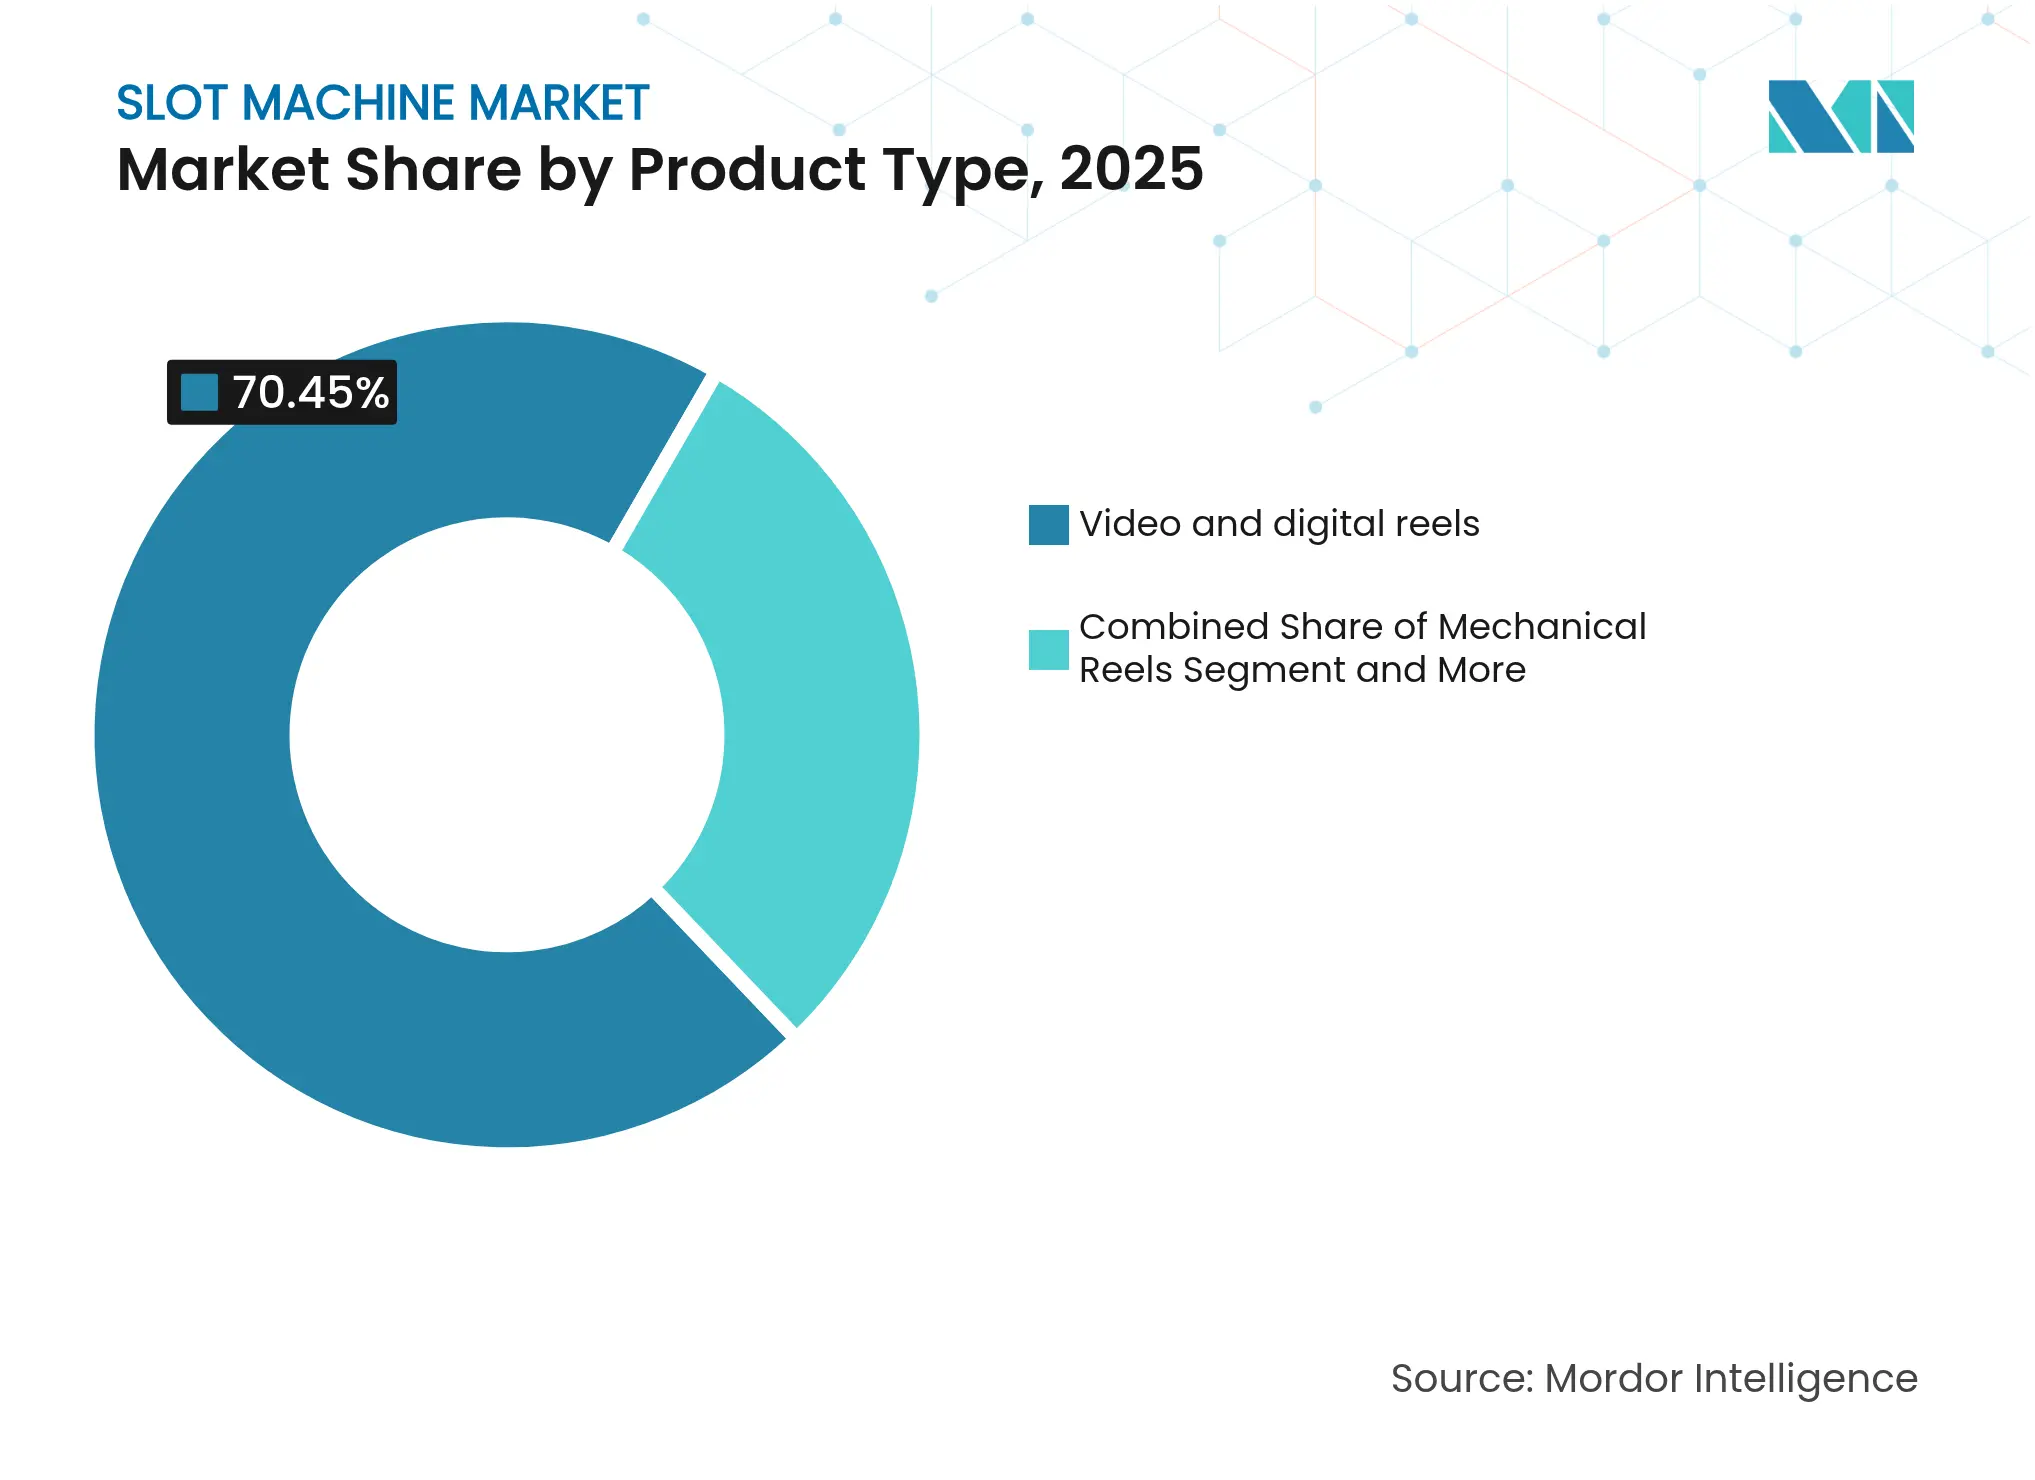
By Product Type: Digital content dominates cabinet mix
Video and digital reels accounted for 70.45% of slot machine market share in 2025, underscoring the decisive pivot away from mechanical hardware. The format supports multi-layer animations, progressive jackpots, and advanced math models that hold player attention longer than legacy stepper games. Multi-game hybrid cabinets leverage the same digital backbone to host diverse titles on a single footprint, and their 11.05% CAGR signals strong operator appetite for flexible floor planning. Mechanical reels survive in nostalgia zones, yet declining refresh investment keeps volumes low. Hybrid units help casinos tailor themes for segmented audiences without adding new cages or peripheral service points. Digital dominance also accelerates the transfer of math libraries into the online channel, strengthening content synergies across the slot machine market.
Manufacturers equip premium digital reels with 4K panels, immersive sound pods, and Bluetooth beacons that integrate with property mobile apps. These enhancements boost average bet size and open cross-promotion opportunities into sportsbook and table-game verticals. Aristocrat’s Phoenix Link exemplifies this strategy by layering Hold and Spin mechanics onto a recognizable reel format, maintaining familiarity while introducing fresh volatility curves. AI modules inside the code base observe each session and subtly modulate hit frequency to keep engagement within optimum bounds, another sign of technology shaping the future slot machine market.
Note: Segment shares of all individual segments available upon report purchase
By Technology Platform: Cloud control reshapes operations
Standalone legacy cabinets still represented 57.90% of slot machine market share in 2025, mainly because many tribal and regional venues have not yet amortized earlier investments. Nonetheless, cloud-based remote gaming servers are projected to grow at 20.10% CAGR, marking a shift toward centralized content distribution that reduces onsite maintenance. With servers hosted in secure data centers, operators upload approved games once and stream them to any linked cabinet, simplifying compliance audits and accelerating theme rotation. Real-time dashboards alert staff to performance anomalies or tampering attempts, enhancing security posture. This operating model improves total cost of ownership and supports sophisticated loyalty logic that synchronizes with sportsbooks and hotel management platforms.
Reelsoft’s Vision RGS demonstrates the possibilities, giving developers an agile framework for testing new return-to-player settings under regulator-approved sandboxes. The same framework exports those settings into certified online channels, reinforcing omnichannel brand identity. Virtual reality and augmented reality cabinets remain in pilot status, yet their progress hinges on broader consumer adoption of compatible headsets. Meanwhile, server-based hybrid estates bring the data fidelity necessary for AI engines, closing the loop between content creation, player analytics, and targeted marketing within the slot machine market.
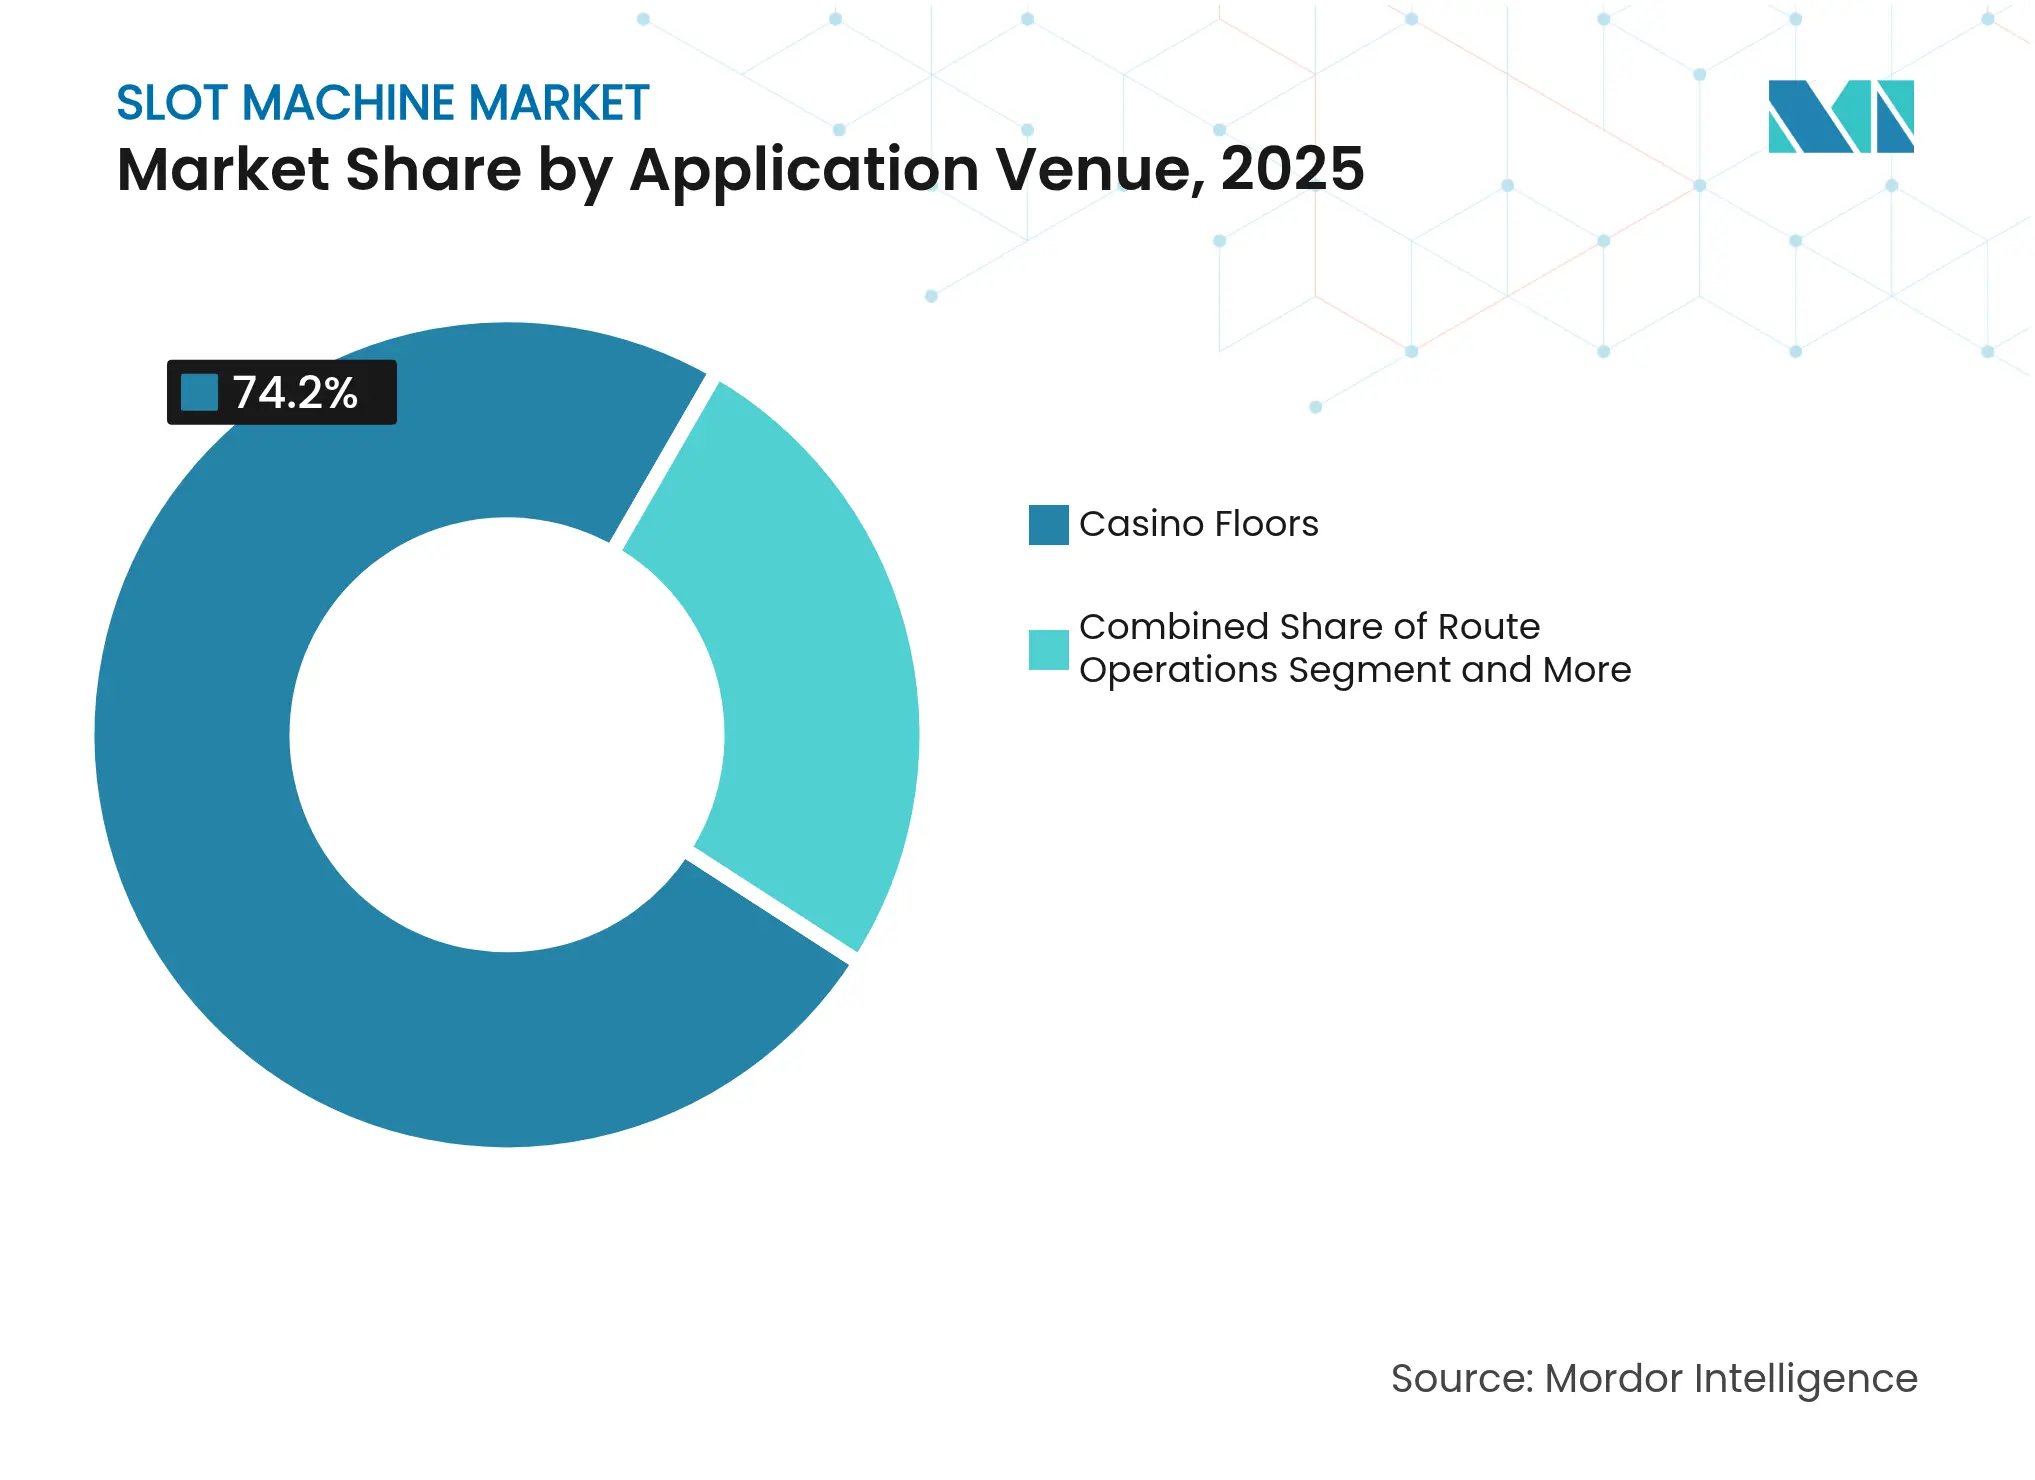
By Application/Venue: Digital channels challenge casino floors
Casino floors generated 74.20% of revenue in 2025 and remain core to the slot machine market size because on-premise spending still outperforms digital ARPU. Yet online RNG slots are gaining at 17.25% CAGR as more jurisdictions legalise regulated iGaming. Hybrid loyalty schemes now let guests earn tier credits on both physical spins and mobile sessions, encouraging cross-channel migration while broadening engagement windows beyond property walls. Cruise ships, route operations, and integrated resorts contribute steady but smaller volumes, their growth tied to tourism flows and local statutes.
Remote deployment models demand high uptime and swift content refresh cycles; cloud SBG architecture fits these requirements by delivering zero-touch updates over satellite or broadband links. Operators that bridge land-based and online portfolios hedge against macro shocks such as travel restrictions, reinforcing revenue durability. Younger demographics also display stronger affinity for online play, further solidifying the strategic need for an omnichannel footprint inside the slot machine market.
Note: Segment shares of all individual segments available upon report purchase
By Payout and Payment Mechanism: Cashless momentum accelerates
TITO modules held 73.80% share of the slot machine market size in 2025, reflecting broad adoption across mature gaming states and regulated European venues. They streamline accounting, curb shrinkage, and reduce physical contact with cash. Cryptocurrency-enabled cabinets, while still niche, are forecast to surge at 21.70% CAGR as regulators clarify digital-asset frameworks. Blockchain settlements offer instant transfer finality and immutable audit trails, attractive for both AML compliance and player privacy. Mobile wallets and house-branded cards sit between these poles, supplying a bridge technology that introduces cashless habits without full crypto adoption.
Fairspin’s blockchain platform shows how provably fair algorithms and tokenised loyalty assets can coexist with traditional payout math, appealing to tech-savvy audiences. TransAct Technologies reports that TITO ticket redemption kiosks now host integrated AML checks, easing the back-office workload linked with cash reporting. Each successive wave of payment innovation allows operators to tailor acquisition offers, convert data into personalized bonuses, and lengthen wallet share in the slot machine market.
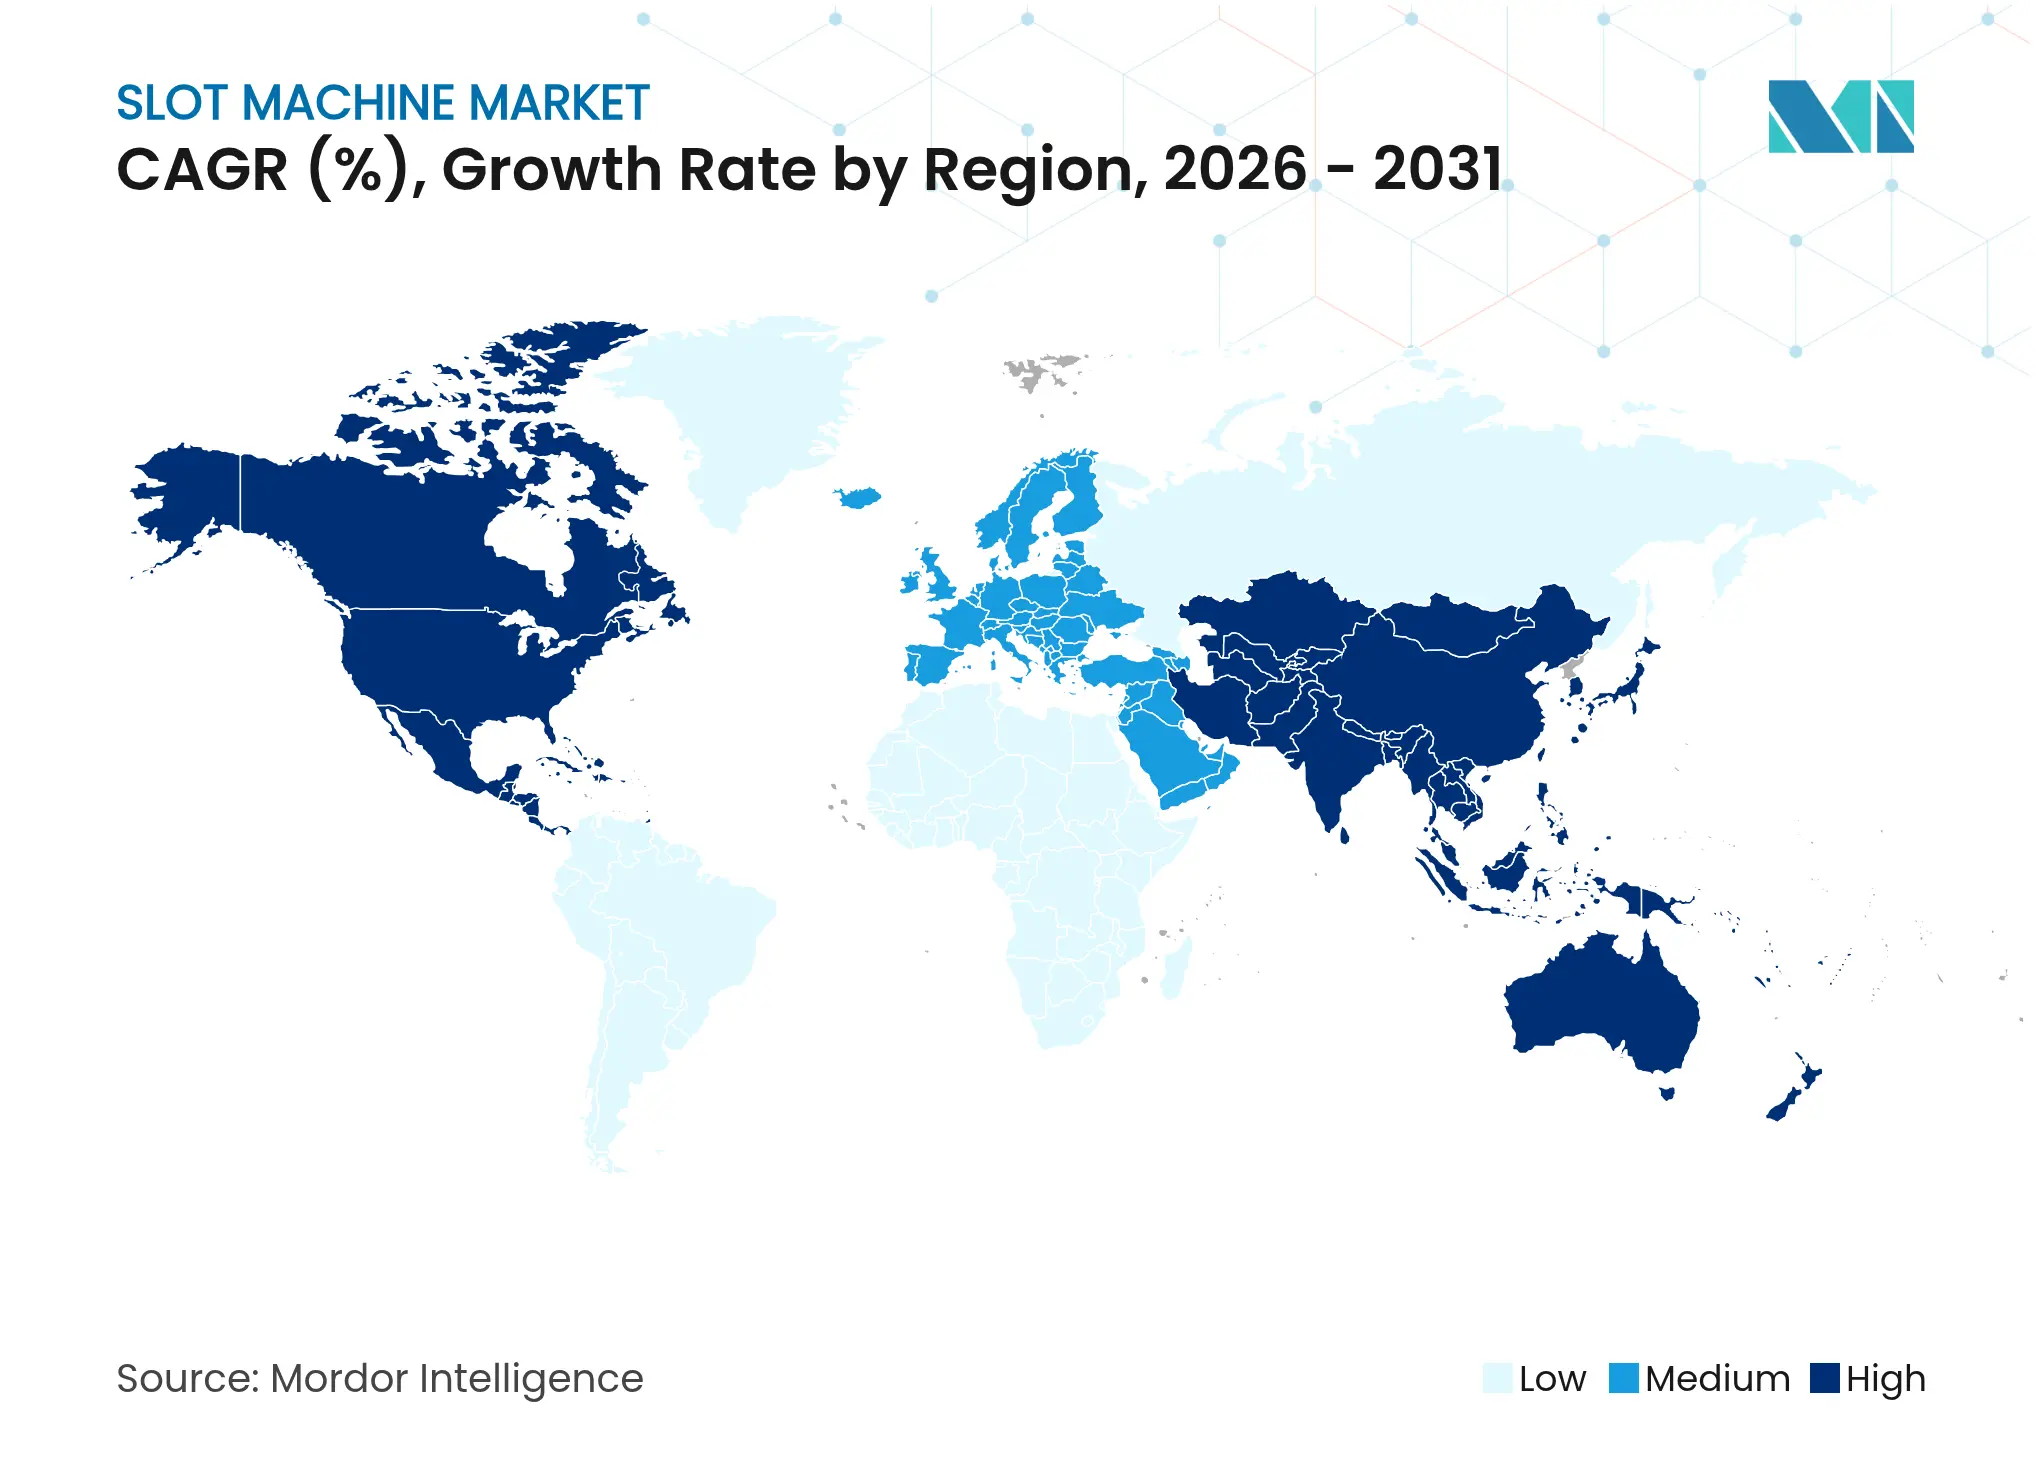
North America retained 37.95% slot machine market share in 2025 thanks to deep installed bases in Nevada and New Jersey as well as expanding tribal networks. Light and Wonder booked USD 3.2 billion in 2024 revenue and added over 850 gaming operations units in the region, illustrating the spending power of U.S. venues. State regulators provide stable technical standards that speed approvals for server-based updates, although semiconductor shortages inflated cabinet lead times and squeezed gross margins. Demographic studies reveal rising participation from Gen-Y visitors attracted to cashless play and integrated sportsbook touchpoints, motivating casinos to accelerate cloud migration and loyalty integrations.
Asia-Pacific is forecast to grow at 12.05% CAGR to 2031, the highest among all regions, propelled by rising disposable income and policy shifts that support integrated resorts. Lawmakers in Thailand are studying a multibillion-dollar resort blueprint that mirrors the Singapore model, while Japan finalized Osaka as its inaugural resort site with a planned opening at the end of the decade. Supply-chain proximity to component manufacturers reduces hardware costs for regional operators, yet geopolitical tension over intellectual-property rights keeps risk premiums elevated. The region’s mobile-first culture also boosts adoption of QR-based e-wallets, reinforcing the relevance of cashless cabinet ecosystems inside the slot machine market.
Europe displays mature yet resilient demand with distinct regulatory nuances country by country. NOVOMATIC lifted revenue from EUR 1,842.3 million in 2021 to EUR 2,859.9 million in 2022, driven by strong positions in Germany and Italy. The continent emphasizes ESG performance, spurring suppliers to adopt low-power LED displays and recycled plastics in cabinet design. Responsible-gaming directives enforce real-time loss limits and mandatory break reminders, features now embedded at firmware level. Many operators retrofit legacy estates with smart peripherals rather than full cabinet swaps, a trend that tempers unit volume but sustains high-margin parts and service revenue across the slot machine market.
Market Concentration
The slot machine market exhibits moderate concentration, with the top five manufacturers controlling well above half of global unit placements. Apollo Global Management’s USD 6.3 billion acquisition of International Game Technology’s gaming segment and Everi’s fintech arm in 2024 created a vertically integrated supplier that combines content, hardware, and payments. Aristocrat generated USD 6.3 billion in the latest fiscal year, crediting premium link series and international share gains for revenue momentum. Light and Wonder deepened diversification by acquiring Grover Gaming’s charitable-gaming assets for USD 850 million, entering a cash-flow-rich niche with cross-selling potential.
Competition now turns on the ability to package AI personalization, cybersecurity, and cashless payments as standard cabinet features rather than optional modules. Firms that master cloud SBG frameworks capture high-margin service contracts, creating recurring revenue streams allied to content royalties. Intellectual property disputes have intensified; Light and Wonder and Aristocrat remain in U.S. litigation over source-code ownership, underscoring the strategic value of proprietary math libraries. Second-tier specialists in blockchain integration or real-time threat monitoring often partner with tier-one suppliers, embedding their modules in return for distribution reach. ESG credentials, including lower energy draw and recyclable cabinet panels, contribute to bid scoring during European tender rounds. Over the next five years, further consolidation is likely as compliance spending rises, and scale economics favor multi-vertical portfolios within the slot machine market.

*Disclaimer: Major Players sorted in no particular order
1. INTRODUCTION
2. RESEARCH METHODOLOGY
3. EXECUTIVE SUMMARY
4. MARKET LANDSCAPE
5. MARKET SEGMENTATION
6. COMPETITIVE LANDSCAPE
7. MARKET OPPORTUNITIES AND FUTURE OUTLOOK
Slot machines are widely recognized gambling devices found in casinos, arcades, and online platforms. Players interact with these electronic or mechanical games by inserting a coin, token, or credit and then pulling a lever or pressing a button. The aim is to match symbols on spinning reels—displayed either on a screen or a physical drum—in specific patterns, which can lead to monetary rewards or prizes.
The study tracks the revenue accrued through the sale of slot machines by various players across the globe. it also tracks the key market parameters, underlying growth influencers, and major vendors operating in the industry, which supports the market estimations and growth rates over the forecast period. The study further analyses the overall impact of COVID-19 aftereffects and other macroeconomic factors on the market. The report’s scope encompasses market sizing and forecasts for the various market segments.
The slot machine market is segmented by product (mechanical and digital), application (casino and others), and geography (North America, Europe, Asia Pacific, Middle East and Africa, and Latin America). The market sizes and forecasts regarding value (USD) for all the above segments are provided.
Pricing Strategy for Semiconductor Components
3 Min Read
Accelerating Additive Manufacturing Adoption in India
3 Min Read
When decisions matter, industry leaders turn to our analysts. Let’s talk.