
Athletic Footwear Market Analysis by Mordor Intelligence
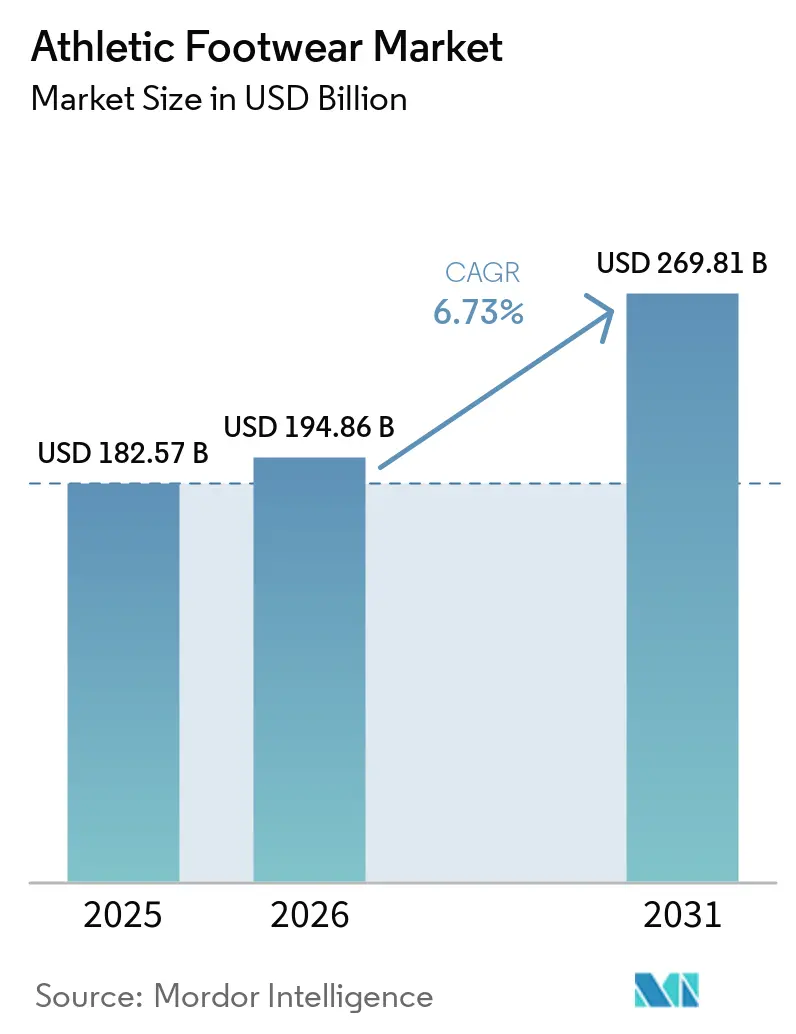
The athletic footwear market size is expected to grow from USD 179.4 billion in 2026 to USD 187.7 billion in 2027 and is forecast to reach USD 232.6 billion by 2032 at 4.38% CAGR over 2027-2032.
Rising women's sports participation in Spain and funding for multi-sport facilities in the United Kingdom can broaden the potential user base for performance footwear. Running-shoe demand and cushioning preferences give suppliers a reason to differentiate the sporting experience. Coordinated physical and digital selling can then connect those propositions with consumers through stores and remote orders. Material-cost volatility and unsuccessful enforcement against counterfeits can limit the earnings available from that demand.
Key Report Takeaways
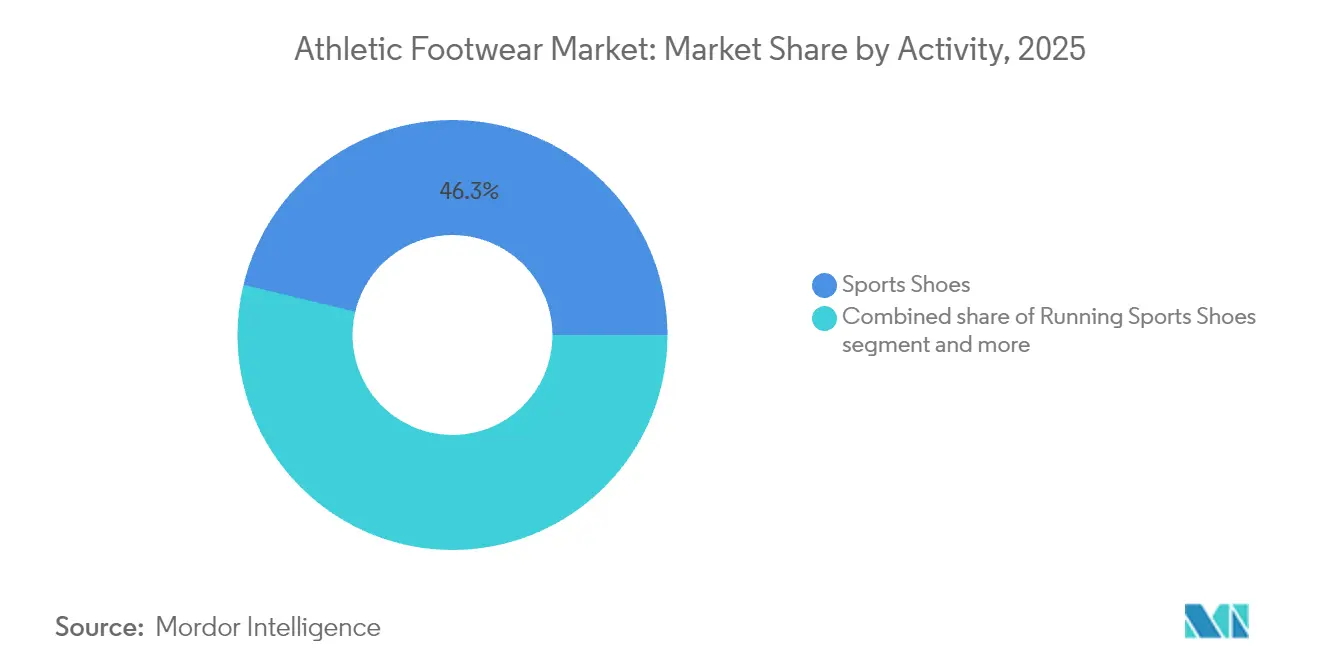
- By activity, sports shoes held a 46.16% athletic footwear market share in 2026, while running shoes are forecast to grow fastest at 4.85% CAGR over 2027-2032.
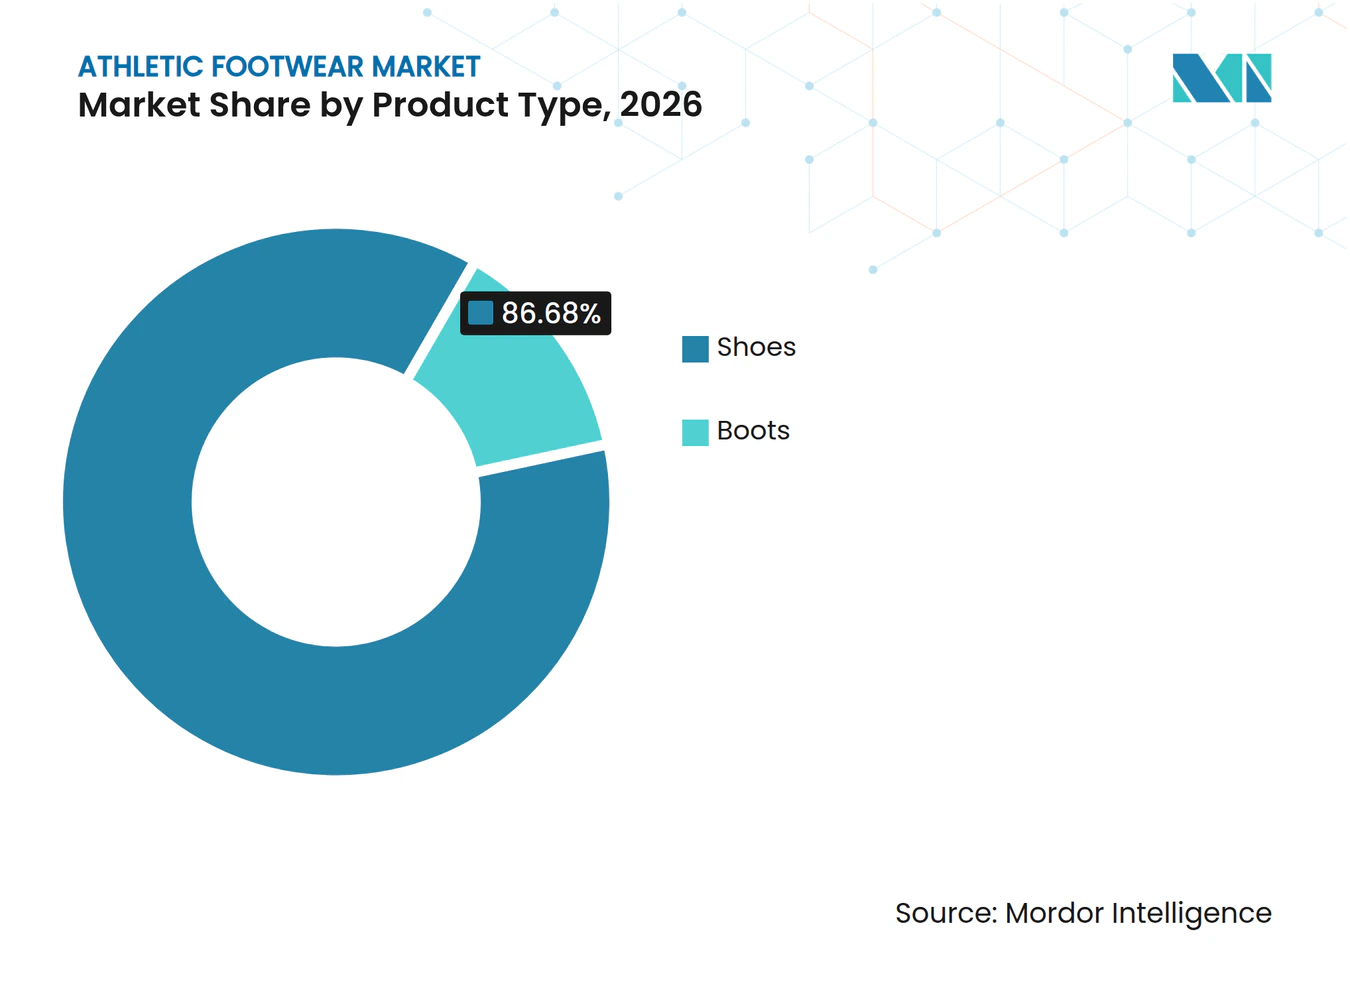
- Within product types, shoes accounted for an 86.68% share of the athletic footwear market size in 2026, with boots set for the fastest growth at 4.7% CAGR over 2027-2032.
- Men led the end-user mix with 61.24% of revenue in 2026, and children's footwear is the fastest-growing segment at 5% CAGR over 2027-2032.
- Mass footwear led the category mix with 67.12% of revenue in 2026, while premium footwear is forecast to grow fastest at 6% CAGR over 2027-2032.
- Among distribution channels, sports and athletic goods stores accounted for 58.9% of revenue in 2026, while online retail stores are forecast to grow fastest at 6.5% CAGR over 2027-2032.
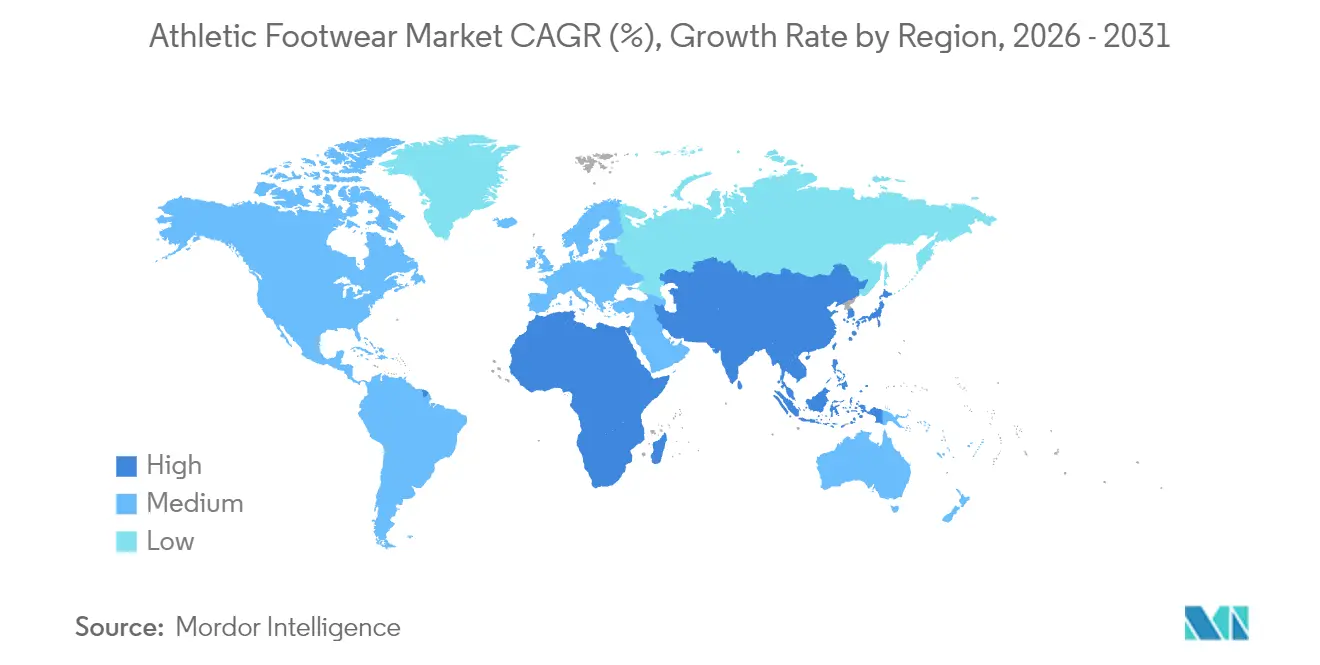
- Geographically, North America held 33.74% of revenue in 2026, and Asia-Pacific is forecast to grow fastest at 6.1% CAGR over 2027-2032.
Note: Market numbers in this report are based on Mordor Intelligence's proprietary estimation framework, which combines nine months of actuals with Q4 projections for base year 2026.
Market Trends and Insights
Drivers Impact Analysis of Athletic Footwear Market*
| Driver | (~) % Impact on CAGR Forecast | Geographic Relevance | Impact Timeline |
|---|---|---|---|
| Significant growth in women sports participation rate | +1.4% | Spain in Europe | Medium term (2-4 years) |
| Aggressive marketing by reputed brands | +1.2% | North America, Europe, and Asia-Pacific | Short term (≤ 2 years) |
| Influence of social media platforms and celebrity endorsements | +1% | United States in North America | Short term (≤ 2 years) |
| Favorable government initiatives to boost sports culture | +0.9% | England, Scotland, Wales, and Northern Ireland | Medium term (2-4 years) |
| Innovations like better cushioning attract consumers. | +0.8% | United States in North America | Short term (≤ 2 years) |
| Online shopping has made athletic footwear more accessible. | +0.7% | Portugal in Europe | Medium term (2-4 years) |
| Source: Mordor Intelligence | |||
Significant growth in women sports participation rate
Rising women's sport participation strengthens the case for footwear assortments built around several specific activities. In Spain, the share of women who practiced sport during the previous year rose from 51.8% in 2022 to 59.5% in 2024/25. The 2024/25 survey identified gentle and vigorous gymnastics, swimming, and hiking and mountaineering as the activities most commonly practiced by women. Indoor exercise and hiking provide separate paths from participation to footwear demand, allowing a women's offer to serve multiple sporting purposes. A brand can consequently broaden its women's business through functional specialization across those uses, with local activity patterns guiding which footwear propositions receive assortment space.
Aggressive marketing by reputed brands
Large marketing commitments give established footwear brands repeated opportunities to connect performance products with consumer attention. Nike Inc. reported USD 4.75 billion in fiscal 2026 demand-creation expense across its business, including brand advertising and sports marketing. Adidas Group increased marketing and point-of-sale expense 8% to EUR 3.08 billion (USD 3.48 billion) in 2025 across its broader product portfolio.[1] Its activity included campaigns for Evo SL and Superstar shoes, linking the spending to specific footwear propositions. Such investment can make technical and style differences easier for prospective buyers to recognize before they encounter competing products. The Evo SL and Superstar campaigns can direct that recognition toward purchases of named shoes, connecting brand attention to demand for particular models.
Influence of social media platforms and celebrity endorsements
Social-media discovery can create value for a footwear brand before the eventual retail seller is chosen. In the spring 2026 U.S. footwear survey, 26% of respondents identified social media influencers or celebrities as a product-discovery channel for shoes. Because discovery can happen away from a seller's own storefront, control of attention and control of the transaction may sit with different businesses. On March 20, 2025, U.S. retailer DICK'S Sporting Goods launched a footwear campaign featuring creator IShowSpeed and athletes Tom Brady, Kevin Durant, Suni Lee, and Travis Hunter. The campaign promoted performance and lifestyle sneakers and cleats across social, digital, broadcast, and streaming channels. By promoting its own assortment through creators, DICK'S can bring discovery and the eventual sale under the same retailer's commercial responsibility.
Favorable government initiatives to boost sports culture
Multi-sport requirements can spread the footwear demand opportunity across several activities within the same funded venue. The UK government awarded funding to 991 projects across England, Scotland, Wales, and Northern Ireland through its Multi-Sport Grassroots Facilities Programme in 2025/26. The Department for Culture, Media and Sport required at least 40% of funded projects to offer multiple sports, such as rugby, cricket, or basketball.[2] Funding for Ben Scott's Field in England covered a planned rugby-compatible 3G pitch, changing facilities, and access improvements. A multi-sport venue can give participating households different functional reasons to buy footwear, linking the opportunity to the activities actually offered. For local footwear retailers, delivery of those facilities determines when a wider sport-specific assortment has a practical customer base.
Restraints Impact Analysis of Athletic Footwear Market*
| Restraint | (~) % Impact on CAGR Forecast | Geographic Relevance | Impact Timeline |
|---|---|---|---|
| Proliferation of counterfeit products | -0.6% | North America, Europe, and Asia-Pacific | Short term (≤ 2 years) |
| Volatile raw material prices increase production expenses and squeeze profit margins. | -0.5% | Asia-Pacific, North America, and Europe | Medium term (2-4 years) |
| Stringent labor and environmental regulations | -0.3% | Germany, France, Italy, and Spain | Medium term (2-4 years) |
| Concerns over sustainability and sourcing. | -0.2% | United States, Europe, and Asia-Pacific | Long term (≥ 4 years) |
| Source: Mordor Intelligence | |||
Proliferation of counterfeit products
Counterfeit exposure puts the value of brand differentiation at risk for athletic-footwear suppliers. Nike Inc. reported in its 2026 filing that it periodically discovers counterfeit reproductions of its products. The company warned that continued sales could harm its sales and brand and shift consumer preference if it failed to enforce its intellectual property rights. For genuine footwear sellers, that conditional exposure makes brand recognition an incomplete defense against substitution. A product improvement can strengthen the authentic offer, but it does not by itself prevent another seller from misusing the identity attached to it. Commercial returns on differentiation therefore depend partly on enforceable ownership, adding a constraint that further product development alone cannot resolve.
Volatile raw material prices increase production expenses and squeeze profit margins.
Material-price uncertainty makes athletic-footwear pricing harder to commit to before production costs are settled. In its fiscal 2026 filing, Nike Inc. reported that commodity and raw-material volatility had affected and could materially affect costs, gross margins, and profitability across its products and supply chain. Its contract manufacturers buy the materials used to make its footwear. Adidas Group reported in its 2025 annual report that it monitored relevant costs and negotiated fixed seasonal material prices with production partners, renegotiating only in exceptional cases. Because rubber, foam cushioning materials, and textiles are principal footwear inputs, higher prices can leave brands choosing between lower earnings per pair and a higher shelf price.
*Our forecasts treat driver/restraint impacts as directional, not additive. The impact forecasts reflect baseline growth, mix effects, and variable interactions.
Athletic Footwear Market Segment Analysis
By Activity:
Sports Scale and Running DemandSports shoes accounted for a 46.16% share of the athletic footwear market size in 2026, making them the largest segment. Stella International Holdings Limited reported 2.6% sales growth in its Sports manufacturing category in the first half of 2026. Within that category, volume expansion across a broader customer base, particularly newly onboarded customers, more than offset reduced shipments to its largest Sports customers. The commercial value of serving multiple sports brands is therefore a more resilient order base, because expansion across new accounts can absorb weaker demand from established buyers.
Running shoes are the fastest-growing segment, with 4.85% CAGR forecast over 2027-2032. Circana reported that U.S. running-shoe dollar and unit sales each rose 13% in the first half of 2026 compared with the first half of 2025. Adventure sports shoes serve hiking and river-trekking uses within Li-Ning Company Ltd.'s Counter, Lin, and Xun outdoor series. In China, those series sold more than 500,000 pairs in 2025 across hiking, commuter, and river-trekking shoes and sandals. The U.S. running gain supports planning for more pairs, whereas Li-Ning's outdoor volume must be distributed across hiking, commuter, and river-trekking designs.



By Product Type:
Shoe Leadership and Football Boot RenewalShoes represented an 86.68% athletic footwear market share in 2026, making them the largest segment. On Holding AG reported that net sales from shoes increased 11.5% in the six months ended June 30, 2026, compared with the same period in 2025. The shoe format can serve sport-specific performance and athletic-inspired everyday wear, allowing one product type to address distinct use occasions. On's result demonstrates that the dominant shoe format also supported double-digit brand-level net-sales growth during the first half of 2026.
Boots are the fastest-growing segment, with 4.7% CAGR forecast over 2027-2032. In 2025, Adidas Group attributed increases in football footwear to new packs and performance upgrades for its Predator and F50 franchises, linking commercial expansion to specific product families. Predator is a performance football boot, and Adidas positions F50 alongside it within its football footwear franchises. Franchise renewal gives boot producers a way to grow through product development, bringing a new performance proposition to an established sporting use in the next selling period.
By End User:
Male Participation and Children's Retail GrowthMen held 61.24% of market revenue in 2026, making them the largest segment. In Ireland in the third quarter of 2025, men aged 15 to 74 were more likely than women to participate in cycling, soccer, Gaelic football, golf, or running. In that age group, 1,462,700 men participated in sport or physical activity. Irish men's ranges can therefore prioritize soccer and Gaelic football footwear using the activity mix, rather than allocate styles from the total male headcount alone.
Children's footwear is the fastest-growing segment, with 5% CAGR forecast over 2027-2032. Kids Foot Locker, operated during the period by Foot Locker, Inc., now part of DICK'S Sporting Goods, recorded USD 165 million in banner sales in the 13 weeks ended August 2, 2025. The banner's figures covered athletic footwear, apparel, and accessories, and comparable sales increased 7.6% over the same period a year earlier. A banner built around children's athletic footwear gave suppliers a dedicated retail route to young buyers, and its comparable-sales gain shows that spending through that route increased in the measured quarter.
By Category:
Mass Affordability and Premium Customer ReachMass footwear was the largest segment, accounting for 67.12% of market revenue in 2026. Campus Activewear Limited positions its contemporary footwear designs at accessible price points. Its total Indian footwear volume reached 26 million pairs in fiscal 2026, up 4.2% from fiscal 2025. The company also reported a richer product mix and continued portfolio premiumization. Campus's combination of higher volume and a richer mix shows that an accessible brand position can accommodate portfolio upgrades rather than depending on additional pairs alone.
Premium footwear is the fastest-growing segment, with 6% CAGR forecast over 2027-2032. On Holding AG identifies itself as a premium performance sportswear brand whose portfolio includes footwear, apparel, and accessories. In its second-quarter 2026 update, the company said consumers under 34 represented more than one-third of its overall customer base. Its direct-to-consumer channel accounted for 45.7% of net sales across its broader product range in the second quarter of 2026. That mix supports a premium-footwear strategy combining younger-customer relevance with an owned selling environment that can present and capture the value of the product proposition.
By Distribution Channel:
Store Networks and Digital FulfillmentSports and athletic goods stores were the largest segment, with 58.9% of market revenue in 2026. Decathlon S.A., an integrated sporting-goods manufacturer and distributor, had a network of 1,902 stores worldwide at December 31, 2025. Such an integrated network connects product creation with physical selling, giving the retailer a way to present its own sporting offer across a substantial installed base. Store-space access becomes a choice about the supplier relationship as well as the selling location, since an integrated sporting-goods operator combines manufacturing and retail capabilities.
Online retail stores are the fastest-growing segment, with 6.5% CAGR forecast over 2027-2032. Adidas Group reported that e-commerce revenue across its broader product assortment increased 26% on a currency-neutral basis in the first half of 2026 compared with the first half of 2025. JD Sports Fashion's online business, including click-and-collect and home-delivery orders shipped from stores, accounted for 21% of sales across its multi-category group in fiscal 2025/26. Because JD counts store-shipped orders within online sales, expanding that channel requires stores to serve remote orders as well as visiting shoppers.
Geography Analysis
North America Athletic Footwear Market
North America held 33.74% of the athletic footwear market size in 2026. In 2025, U.S. wholesale sales of athletic footwear totaled USD 24.1 billion.[3] DICK'S Sporting Goods operated 1,531 Foot Locker Business stores in the United States and Canada as of August 1, 2026. A multi-banner retail owner of that scale can provide brands the opportunity to reach many selling locations through a shared commercial relationship. For brands seeking access to this network, securing assortment placement with its retail owner can open a route to stores across the United States and Canada.
Asia-Pacific Athletic Footwear Market
Asia-Pacific is the fastest-growing geography, with 6.1% CAGR forecast over 2027-2032. Anta Sports Products Ltd. reported 4.8% revenue growth for its broader ANTA sportswear segment in the first half of 2026 compared with the first half of 2025. The company mainly attributed the increase to e-commerce growth and its tiered, differentiated retail strategy. For footwear suppliers serving ANTA in China, the opportunity is to match shoes to differentiated retail positions while also securing online reach.
In 2026, Adidas Group's broader European sportswear sales grew 6% currency-neutrally in the first half, while Vulcabras S.A.'s consolidated Brazilian domestic-market net revenue rose 12.6% in the first quarter, both year over year. Portugal's footwear industry exported 68 million pairs in 2025. KEMSA's Sport House outlet at Plaza Norte gave customers in Paraguay's northern zone access to sporting brands. ANTA International announced 4 ANTA sportswear store openings in Dubai and Sharjah, United Arab Emirates, while Nike distributor partner Hudson Brand Development Kenya led Nike's Nairobi flagship opening on May 6, 2026. Serving Adidas Group's European business, Vulcabras's Brazilian operations, and ANTA's new UAE stores requires different partners, so a supplier cannot treat regional expansion as a single account-development task.
Regional Editions
All regions
Regulatory Framework and Outlook
This comparison assesses selected jurisdictions from the perspective of a large athletic-footwear manufacturer selling adult and children's lines. Product-safety, labeling, and conformity rules determine the materials, records, and market-entry steps the supplier must control. U.S. lead restrictions concern products intended primarily for children 12 or younger and include statutory exceptions.
Regulatory Table of Athletic Footwear Market
| Decision factor | United States | Germany | China | Brazil | Saudi Arabia |
|---|---|---|---|---|---|
| Primary authority | Consumer Product Safety Commission | Länder market-surveillance authorities | Ministry of Industry and Information Technology | Inmetro and RBMLQ-I inspection network | Saudi Standards, Metrology and Quality Organization (SASO) |
| Key instruments or direction | 15 U.S.C. §1278a; 100 parts per million total lead for covered accessible children's-product components, subject to statutory exceptions; eFiling for most covered imports requiring certification from July 8, 2026 | EU Regulation 2023/988, Article 9, for covered consumer products | Mandatory GB 25038-2024 footwear safety standard, effective June 1, 2025 | Portaria 459/2025 and ABNT NBR 16679:2018 labeling for covered footwear | Footwear technical regulation; medical and toy footwear exclusions; additional professional-footwear requirements |
| Commercial effect | Materials conformity and importer eFiling for covered finished products requiring certification | Internal risk analysis and technical safety documentation before market placement | Mechanical safety and limits for 7 hazardous substances | Label and product-information conformity with actor-specific phase-in dates | SASO-approved notified-body certificate; Arabic or Arabic/English brand and origin labels; Type 3 for infants under 36 months and Type 1A for other footwear |
| Current policy attractiveness | Medium | Medium | Medium | Medium | Low |
| Future direction of policy attractiveness | Hardening | No change | No change | Hardening | No change |
| Source: Mordor Intelligence | |||||
The U.S. medium rating reflects children's-product controls, with hardening from January 8, 2027, for eFiling of covered finished products requiring certificates entered from foreign trade zones for consumption or warehousing. Germany's risk documentation and China's operative safety baseline support medium ratings and continuity in repeatable product-conformity processes for a large manufacturer. Brazil's medium rating reflects a defined labeling transition, with manufacturer/importer supply conformity due December 31, 2026, and distributor/retailer sales conformity due December 31, 2027. Saudi Arabia's notified-body certification, language-specific labels, and separate infant assessment route justify low attractiveness and continuing market-entry dependencies for an established supplier.
Value Chain Stages
The value chain compares where footwear businesses earn revenue and how control passes from product design to the consumer sale. Nike Inc. designs and sells athletic footwear through wholesale and direct channels, while independent contractors manufacture nearly all its products. That separation makes the translation of a design into repeatable production an important commercial handoff, because control of the brand and execution of manufacturing sit with different businesses.
Value Chain Analysis Table of Athletic Footwear Market
| Primary activity | Key participants | Value capture | Bottleneck | Resilience response |
|---|---|---|---|---|
| Product design and development | Athletic-footwear brand owners such as Nike Inc. | Finished-footwear wholesale and retail sales | Translating product concepts into repeatable construction | Validate construction requirements with production partners before scaling |
| Materials formulation and supply | Footwear polyurethane suppliers such as BASF | Sales of polyurethane systems for footwear components | Matching material behavior to the intended component | Qualify material and component specifications together |
| Contract manufacturing | Athletic and casual footwear OEM/ODM manufacturers such as Pou Chen Group | Contract footwear sales to brand customers | Reproducing different customers' specifications at production scale | Separate customer specifications and verify process consistency |
| Wholesale and direct selling | Brand-owned wholesale and direct sellers such as Nike Inc. and Adidas Group | Wholesale sales and consumer retail sales | Coordinating partner and owned routes to the same consumer demand | Define each route's assortment and selling responsibilities |
| Source: Mordor Intelligence | ||||
Wholesale generated 60% of Adidas Group's total net sales in 2025, while its own retail and e-commerce business generated 40%. This mix shows why direct selling and partner distribution can coexist within a brand's revenue model. Owning the consumer sale can capture retail revenue without owning a factory, as Nike's direct channels and outsourced production illustrate.
Competitive Landscape
Market Concentration
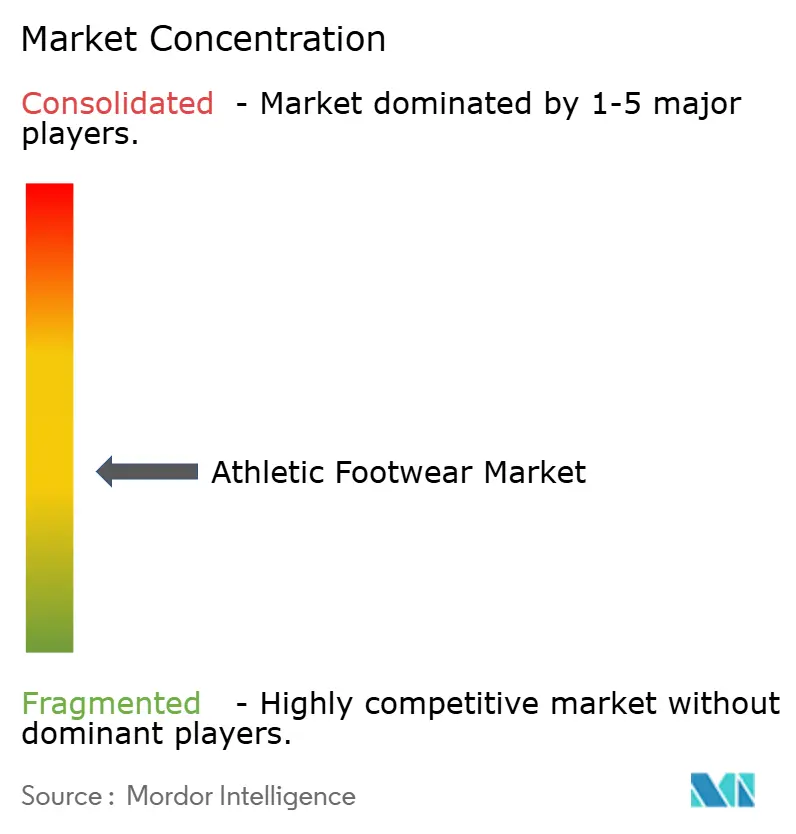
Brand-led competition is moderately concentrated, with several international footwear businesses spanning performance and lifestyle demand. Major competitors include Puma SE, Nike Inc., Skechers USA Inc., ASICS Corporation, and Adidas Group. Nike Brand footwear revenue was USD 29.5 billion in fiscal 2026, flat in reported terms and down 2% on a currency-neutral basis from fiscal 2025. Footwear unit sales fell 1%, while lower average selling prices reduced currency-neutral revenue by approximately 1 percentage point. Skechers, which 3G Capital acquired on September 12, 2025, designs, develops, and markets lifestyle and performance footwear.
Adidas Group's footwear revenue rose 2% on a currency-neutral basis in the first half of 2026 compared with the first half of 2025. The result came despite conservative sell-in focused on full-price business in a promotional marketplace, while running, training, and motorsport led double-digit gains in several Performance footwear categories. That breadth gives consumers several performance uses within the same brand, while providing the supplier with multiple categories through which to capture demand. Strong Performance-category gains therefore need not translate into equally rapid overall footwear growth when sell-in prioritizes full-price sales.
Production assurance adds an operational basis for competition, linking the footwear proposition to the materials that can enter the finished product. Puma SE reported 98.2% restricted-substances-list compliance for final products across PUMA, Cobra, and stichd, using January to October 2025 data from 498 Tier 1 and Tier 2 factories. It also reported excluding failed materials from PUMA products until the failure was corrected and the material passed retesting. PUMA's correction-and-retesting requirement puts material approval before production use, so an appealing design alone cannot secure a material's place in its products. Competitive differentiation can rest on repeatable material control as well as product appeal, raising the execution demands for a new brand.
Athletic Footwear Industry Leaders
-
Puma SE
-
Nike Inc.
-
Skechers USA Inc.
-
ASICS Corporation
-
Adidas Group
- *Disclaimer: Major Players sorted in no particular order
Athletic Footwear Market Companies Covered in this Report
- Nike Inc.
- Adidas Group
- Puma SE
- Skechers USA Inc.
- ASICS Corporation
- Under Armour Inc.
- New Balance Athletics Inc.
- VF Corporation (Vans, The North Face)
- Misto Holdings Corp.
- Columbia Sportswear Company
- Brooks Sports, Inc.
- On Holding AG (On Running)
- Deckers Outdoor Corporation
- Li-Ning Company Ltd.
- Anta Sports Products Ltd.
- Decathlon S.A.
- Mizuno Corporation
- Xtep International Holdings Ltd.
- Wolverine World Wide, Inc.
- Yonex Co. Ltd.
Key Opportunities for Market Participants
The opportunities compare durable construction, store-assisted delivery, and unsold-stock resale as routes to additional athletic-footwear consumer sales. U.S. survey responses combine willingness to pay more for durable athletic shoes with price-related and size-related abandonment of footwear purchases generally. Commercial returns depend on matching the intervention to its barrier, since a higher-value product and a more accessible purchase solve different parts of the transaction.
Market Opportunities Table of Athletic Footwear Market
| Opportunity | Why now | Buyer / lead segment | Recommended play | Main barrier | Likely beneficiaries |
|---|---|---|---|---|---|
| Durable athletic shoes with a clear value proposition | 43% of U.S. respondents stated willingness to pay more for strong or durable athletic-shoe construction in spring 2026 | U.S. athletic-shoe consumers prioritizing durability | Build and substantiate a durable construction offer | Item cost cited by 67% in the broader U.S. footwear survey in spring 2026 | Athletic-footwear brands such as Nike Inc. |
| In-store selection with home delivery | U.S. footwear survey preference for this ordering method rose from 8% in 2025 to 20% in 2026 | Athletic-footwear shoppers seeking a specific size | Connect store-assisted selection to pooled size availability and home delivery | Unavailable sizes cited by 65% of U.S. footwear respondents in spring 2026 | Athletic-footwear retailers and direct sellers such as Nike Inc. |
| First-sale redistribution of unsold athletic footwear | EU large-company destruction ban applied from July 19, 2026, with specified exceptions | Value-oriented consumers of unsold new athletic footwear | Offer saleable pairs through discounts or alternative markets | Matching available sizes and styles to willing buyers | EU footwear outlet retailers |
| Source: Mordor Intelligence | |||||
The central opening is durable athletic footwear at a credible price and obtainable size, connecting U.S. consumers' stated willingness to pay more for construction with their broader footwear purchase barriers. The EU destruction ban adds a redistribution opening because large companies must prioritize sales, donations, or preparation for reuse from July 19, 2026, with medium-sized companies following in 2030 and small and micro-businesses exempt. Specified exceptions include unsafe, damaged, counterfeit, IP-infringing, or charity-rejected goods, and businesses using exemptions must provide proof, publish annual discarded-goods reports, and retain records for 5 years. Permitted destruction must follow the waste-treatment hierarchy, prioritizing recycling, so a redistribution service needs both access to buyers for saleable pairs and a documented route for exceptional disposals.
Recent Industry Developments in Athletic Footwear Market
- Oct 2026: Nike Basketball and LeBron James announced the LeBron 24 signature basketball shoe, with global availability planned for November 17, 2026.
- Oct 2026: ASICS Japan announced the GEL-SLOWCUSH running shoe on October 1, scheduling Japan sales through its online store and direct stores, excluding factory outlets, for October 8, 2026. The announced shoe incorporated newly developed midsole cushioning foam and a new heel shock-absorption feature.
Athletic Footwear Market Report Scope and Research Methodology
Market Definition and Coverage
The athletic footwear market measures annual consumer spending on footwear designed for sports, fitness, and athletic-inspired everyday wear in the global market. Values reflect sales of finished footwear to end users through retail channels.
Scope exclusions: Sports apparel and accessories, separately sold footwear components and footwear repair services, protective work footwear, and formal fashion footwear not positioned for athletic use are excluded.
Segments Covered in This Report
- By Activity
- Running Shoes
- Sports Shoes
- Adventure Sports Shoes
- Other Product Types
- By Product Type
- Shoes
- Boots
- By End User
- Men
- Women
- Kids/Children
- By Category
- Premium
- Mass
- By Distribution Channel
- Sports and Athletic Goods Stores
- Supermarkets/Hypermarkets
- Online Retail Stores
- Other Distribution Channels
- By Geography
- North America
- United States
- Canada
- Mexico
- Rest of North America
- Europe
- Germany
- United Kingdom
- Italy
- France
- Spain
- Netherlands
- Poland
- Belgium
- Sweden
- Rest of Europe
- Asia-Pacific
- China
- India
- Japan
- Australia
- Indonesia
- South Korea
- Thailand
- Singapore
- Rest of Asia-Pacific
- South America
- Brazil
- Argentina
- Colombia
- Chile
- Peru
- Rest of South America
- Middle East and Africa
- South Africa
- Saudi Arabia
- United Arab Emirates
- Nigeria
- Egypt
- Morocco
- Turkey
- Rest of Middle East and Africa
- North America
Data Sources, Market Sizing, and Validation
Desk Research
Secondary research would use public sources such as the Sports and Fitness Industry Association's participation reports to track activity levels, the World Health Organization's physical activity fact sheet to frame participation trends, adidas annual reports to review product-divisional and channel results, and NIKE filings to examine footwear sales, costs, and sourcing. These sources help relate participation, consumer demand, product mix, and retail access to the measured footwear sales pool.
Company filings, investor materials, government statistics, trade publications, and reputable press coverage would add detail on financial performance, prices, product launches, distribution, and market events. The named sources are not exhaustive, and further sources inform collection, validation, and clarification.
Primary Interviews and Surveys
Structured interviews and short surveys would include footwear brand, retail, product, merchandising, and market-planning specialists across the global athletic footwear value chain. Questions would check secondary findings on consumer activity, channel mix, price tiers, and product demand, while asking respondents to identify missing categories, unusual regional patterns, or changes since the latest published data. Analysts would compare answers with company and public-market evidence, investigate material gaps with targeted follow-up, and retain ranges where sources do not support a single point.
Distribution of primary research fieldwork respondents
| Company type | Respondent position | Region |
|---|---|---|
| Top tier: 32% | CXOs: 18% | APAC: 40% |
| Mid tier: 45% | Functional/Unit leaders: 32% | EMEA: 32% |
| Smaller Players: 23% | Managers: 50% | Americas: 28% |
Market-Sizing & Forecasting
The model estimates global annual retail spending on finished athletic footwear from the top down, using a base-year market value and extending it across activity, product type, end user, price category, channel, and region. It would track sports and fitness participation as a demand signal, household income and retail spending as indicators of purchase capacity, footwear prices and product mix as value drivers, and online and specialty-channel activity as measures of route to market. Category and regional shares would be built from published market splits, brand and retailer disclosures, and the relative growth evidence for each group. A multivariate regression would relate the historical market series to these indicators, with scenario analysis used when a major event or a short history makes a single trend unreliable. Selective bottom-up checks would multiply sampled retail prices by estimated pair volumes and compare the result with supplier or channel roll-ups. Experts would review whether the forecast direction and variable relationships fit footwear purchasing and regional conditions, while gaps in pair counts, prices, or channel coverage would be bounded with the closest public data and carried as ranges until corroborated.
Data Validation & Update Cycle
Analysts would triangulate market totals and segment movements against independent company filings, retailer disclosures, participation measures, and relevant public statistics, then check year-on-year changes, shares, and regional totals for breaks or unexplained variance. A reviewer would trace each anomaly to its source, unit, year, and boundary before sign-off, and the analyst would re-contact respondents when answers conflict materially, a new event changes the outlook, or a key input cannot be reconciled. The model would be refreshed annually, revisited between cycles after material market events, and given a fresh source and calculation review before delivery.
Mordor Intelligence's Athletic Footwear Market Estimate Compared With Other Published Estimates
Published estimates can differ in the transactions and products they count and the inputs used to model demand. The athletic footwear market measures annual consumer spending on footwear designed for sports, fitness, and athletic-inspired everyday wear in the global market.
Key Gap Drivers include the study's defined coverage and market-specific modeling choices. Experts would review whether the forecast direction and variable relationships fit footwear purchasing and regional conditions, while gaps in pair counts, prices, or channel coverage would be bounded with the closest public data and carried as ranges until corroborated.
Benchmark comparison
| Source | Market Size | Gaps in Research Methodology |
|---|---|---|
| Mordor Intelligence | USD 187.7 B (2027) | |
| Global Research Publisher A | USD 130.1 B (2025) | At its 2025 base, this estimate is 30.7% below this report's 2027 value of USD 187.7 B, 2 years later. The published base-year estimate precedes this report's year, and the page shows a subsequent upward market path. |
| Global Research Publisher B | USD 142.8 B (2025) | At its 2025 base, this estimate is 23.9% below this report's 2027 value of USD 187.7 B, 2 years later. The published base-year estimate precedes this report's year, while its following forecast steps upward. |
Mordor Intelligence's analysts would triangulate market totals and segment movements against independent company filings, retailer disclosures, participation measures, and relevant public statistics, then check year-on-year changes, shares, and regional totals for breaks or unexplained variance.
Key Questions Answered in the Report
What is the Athletic Footwear market size and growth outlook?
It is expected to reach USD 187.7 billion in 2027 and USD 232.6 billion by 2032, at 4.38% CAGR over 2027-2032.
What is driving demand for athletic shoes?
Sports participation and brand investment support demand. Spain's 2024/25 survey recorded 59.5% of women practicing sport during the previous year.
Which activity accounts for the most athletic-footwear revenue?
Sports shoes held 46.16% of revenue in 2026, while running shoes are forecast to grow fastest at 4.85% CAGR over 2027-2032.
Which companies are major competitors in athletic footwear?
Major competitors include Puma SE, Nike Inc., Skechers USA Inc. under 3G Capital, ASICS Corporation, and Adidas Group. 3G Capital completed its Skechers acquisition on September 12, 2025.
What could constrain athletic-footwear suppliers' outlook?
Material-cost volatility and unsuccessful enforcement against counterfeits can pressure earnings and sales, as Nike Inc.'s fiscal 2026 risk disclosures illustrate.
Which region leads athletic-footwear revenue and where is growth fastest?
North America held 33.74% of revenue in 2026, and Asia-Pacific is forecast to grow fastest at 6.1% CAGR over 2027-2032.