
Market Overview
| Study Period | 2020 - 2031 |
|---|---|
| Forecast Data Period | 2026 - 2031 |
| Base Year Market Size (2025) | USD 1.21 Billion |
| Market Size (2026) | USD 1.61 Billion |
| Market Size (2031) | USD 6.83 Billion |
| Growth Rate (2026 - 2031) | 33.45 % |
| Market Concentration | Medium |
Major Players *Disclaimer: Major Players sorted in no particular order Image © Mordor Intelligence. Reuse requires attribution under CC BY 4.0. | |
Asia-Pacific Robotic Process Automation Market Analysis by Mordor Intelligence
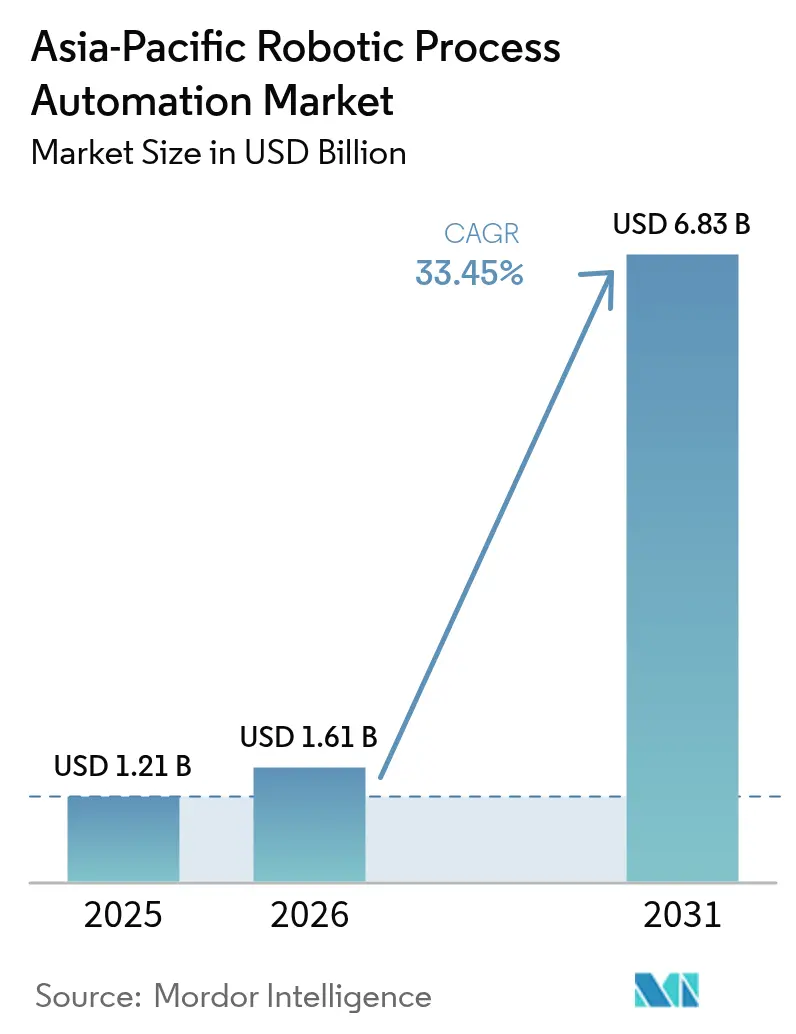
The Asia-Pacific robotic process automation market size is expected to grow from USD 1.21 billion in 2025 to USD 1.61 billion in 2026 and is forecast to reach USD 6.83 billion by 2031 at 33.45% CAGR over 2026-2031. Demand scales with government digitization mandates, escalating cloud readiness, and rising labor inflation that encourages enterprises to automate recurring back-office work. Software products continue to hold the lion’s share, yet services revenue is outpacing licenses as buyers seek implementation guidance in an increasingly hybrid, AI-infused environment. Vendor competition is intensifying around generative-AI-powered bots that cut development time and broaden use-case coverage. In parallel, hyperscaler platform entries are lowering switching barriers, prompting established RPA vendors to bundle process-mining and document-processing modules for retention.
Key Report Takeaways
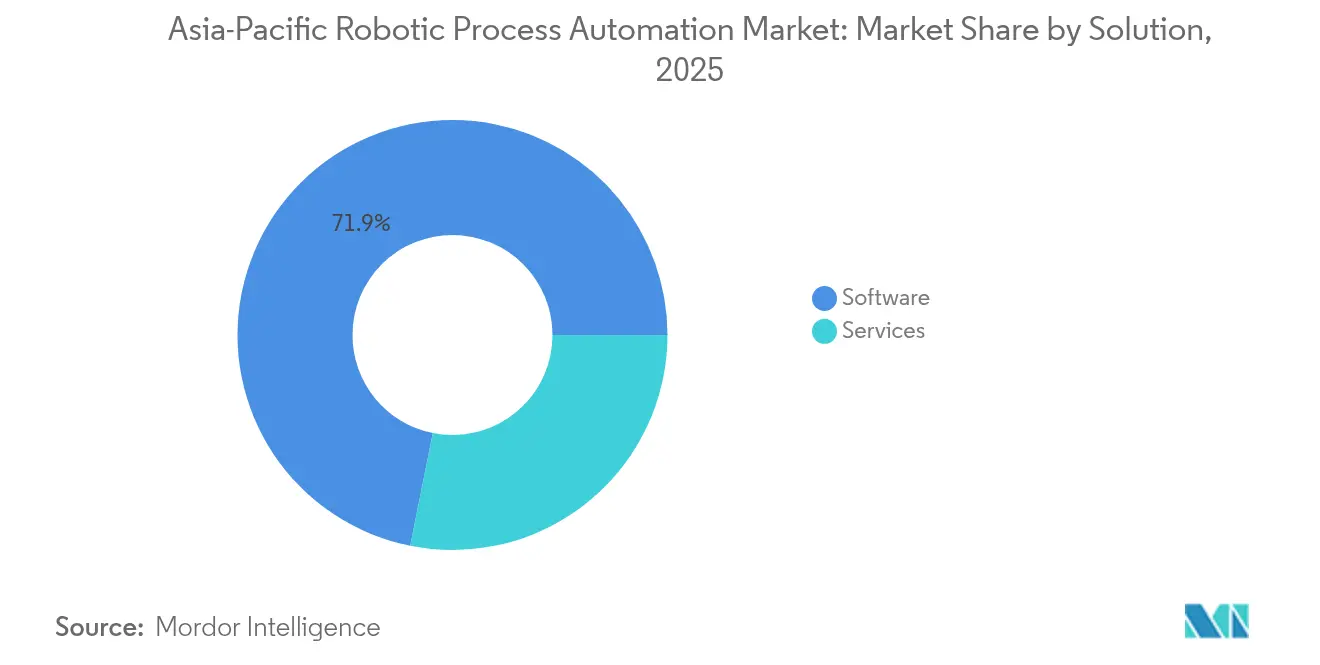
- By solution, software captured 71.85% of the Asia-Pacific robotic process automation market share in 2025, while services clock a 35.2% CAGR through 2031.
- By enterprise size, large enterprises controlled 60.95% of the Asia-Pacific robotic process automation market size in 2025; small and medium enterprises are expanding at a 34.9% CAGR to 2031.
- By deployment model, on-premises retained 77.55% share of the Asia-Pacific robotic process automation market size in 2025, whereas cloud implementations are accelerating at a 35.4% CAGR through 2031.
- By end-user industry, BFSI led with 27.25% revenue share in 2025 in the Asia-Pacific robotic process automation market; healthcare and life sciences is advancing at a 34.1% CAGR to 2031.
Note: Market size and forecast figures in this report are generated using Mordor Intelligence’s proprietary estimation framework, updated with the latest available data and insights as of 2026.
Market Trends and Insights
Drivers Impact Analysis of Asia-Pacific Robotic Process Automation Market*
| Driver | (~) % Impact on CAGR Forecast | Geographic Relevance | Impact Timeline |
|---|---|---|---|
| Rising digitization-linked government mandates | +8.2% | China, India, Japan, Singapore, South Korea | Medium term (2-4 years) |
| Accelerated post-COVID cost-take-out programs | +7.1% | Global APAC, concentrated in manufacturing hubs | Short term (≤ 2 years) |
| Maturity of cloud-native, low-code RPA suites | +6.8% | Australia, Singapore, Japan, urban centers | Medium term (2-4 years) |
| Growing SME demand for SaaS bots | +5.9% | India, China, Southeast Asia emerging markets | Long term (≥ 4 years) |
| Integration of Gen-AI-powered autonomous agents | +4.7% | Japan, South Korea, Australia, Singapore | Long term (≥ 4 years) |
| APAC-specific labor cost inflation in shared-service hubs | +2.3% | India, Philippines, Malaysia, Vietnam | Short term (≤ 2 years) |
| Source: Mordor Intelligence | |||
Rising Digitization Mandates
Singapore’s Digital Enterprise Blueprint enforces workflow digitization for government suppliers, Japan’s Digital Agency funds municipal RPA pilots, and China’s AI Plus roadmap embeds automation targets into five-year plans, moving the Asia-Pacific robotic process automation market from ROI-led adoption to policy-driven compliance. Procurement cycles now start with regulatory checklists, favoring vendors that offer in-country cloud zones and template libraries matching statutory forms. Local system integrators benefit as ministries demand domestic data residency, while global providers open regional data centers to remain eligible for public projects. Collectively, these directives lift baseline demand and standardize minimum automation footprints across industries.
Accelerated Post-COVID Cost-Take-Out Programs
Factories that digitized paperwork during 2020 disruptions have operationalized quick wins into multiyear automation roadmaps. RPA use cases have expanded from invoice posting to full order-management flows, shrinking average transaction time by over 90% in pilot sites.[1]Rockwell Automation, “9th Annual State of Smart Manufacturing Report,” ROCKWELLAUTOMATION.COM Boards now treat automation as a hedging tool against future supply-chain shocks, ensuring sustained investment even after immediate crisis memories fade. Regional conglomerates bundle automation in zero-based budgeting exercises, linking executive bonuses to bot-driven savings that offset wage inflation and help meet margin targets.
Growing SME Demand for SaaS Bots
Government loan guarantees and technical-assistance vouchers covering up to 70% of subscription fees are stimulating SME onboarding across India, Malaysia, and Thailand.[2]Asian Development Bank, “ADB Supports Digital Transformation of SMEs,” ADB.ORG SaaS bundles typically include ready-made templates for invoice matching, payroll runs, and e-commerce order fulfillment, eliminating lengthy process-mapping workshops. Channel partners pivot from bespoke builds to volume-driven template reselling, enabling faster geographic expansion. This momentum is critical because SMEs account for more than 90% of formal enterprises across APAC, positioning them as the next growth flywheel.
Integration of Gen-AI-Powered Autonomous Agents
Vendors are embedding large-language models that can dynamically interpret unstructured data and initiate downstream actions, moving beyond rule-based bots. Banks in South Korea are piloting customer-service agents that resolve 30% of incoming email queries without human review. Early adopters report a 25% cut in bot-maintenance backlog because generative models self-heal instruction sets when UI layouts change.[3]UiPath, “UiPath Reports First Quarter Fiscal 2026 Financial Results,” UIPATH.COM While still nascent, AI-augmented bots set new vendor-selection criteria, rewarding platforms that can fine-tune models within national privacy constraints.
Restraints Impact Analysis of Asia-Pacific Robotic Process Automation Market*
| Restraint | (~) % Impact on CAGR Forecast | Geographic Relevance | Impact Timeline |
|---|---|---|---|
| Scarcity of certified RPA talent in Tier-2 Asian cities | -4.1% | India, China, Southeast Asia secondary markets | Medium term (2-4 years) |
| Fragmented data-privacy laws across APAC | -3.8% | Global APAC, particularly cross-border operations | Long term (≥ 4 years) |
| High bot maintenance cost in legacy-heavy industries | -2.7% | Manufacturing, utilities, government sectors | Short term (≤ 2 years) |
| Slow ROI in process-complex sectors (mining, utilities) | -1.9% | Australia, Indonesia, resource-dependent economies | Long term (≥ 4 years) |
| Source: Mordor Intelligence | |||
Scarcity of Certified RPA Talent in Tier-2 Asian Cities
Automation expertise remains concentrated in metro hubs like Bengaluru, Shanghai, and Ho Chi Minh City. Enterprises expanding to cost-efficient tier-2 locations confront extended recruitment cycles, forcing them to adopt hub-and-spoke delivery or remote-deployment models that inflate project overheads. Although vendors run fast-track academies, ramp-up time averages six months, prolonging the supply-demand imbalance.
Fragmented Data-Privacy Laws Across APAC
Differing consent, storage, and cross-border-transfer clauses under China’s PIPL, Singapore’s PDPA, and Japan’s APPI compel multinational firms to configure separate bot instances or invest in sophisticated field-level encryption. This multiplicity raises compliance cost and complicates centralized governance, particularly for document-heavy workflows involving personal identifiers. Vendors able to supply built-in regional compliance packs gain a contracting advantage.
*Our forecasts treat driver/restraint impacts as directional, not additive. The impact forecasts reflect baseline growth, mix effects, and variable interactions.
Asia-Pacific Robotic Process Automation Market Segment Analysis
By Solution:
Services Expand as Implementation Complexity RisesServices revenue climbed faster than software even though licenses still represented 71.85% of the Asia-Pacific robotic process automation market share in 2025. Enterprises advancing from task-level bots to enterprise-wide digital-worker programs need consulting for process redesign, governance frameworks, and hybrid-cloud security reviews. Over 45% of new projects now include a change-management work-stream that positions service providers alongside internal HR teams.
Training and support constitute the fastest-growing services sub-segment, fueled by partnerships such as UiPath and Indonesia’s Indosat that certify thousands of citizen developers yearly. As more bots interact with enterprise knowledge graphs, ongoing model reinforcement services emerge, creating recurrent revenue. Conversely, software growth moderates as perpetual licenses give way to subscription bundles, flattening peak-year inflows yet improving revenue visibility.



By Enterprise Size:
SME Upswing Reshapes Vendor PlaybooksSmall and medium enterprises are expanding at a 34.9% CAGR, even as large enterprises still account for 60.95% of the Asia-Pacific robotic process automation market size. Low-code interfaces empower finance managers and operations heads in SMEs to build bots without heavy IT backlogs, accelerating proof-of-concept rollouts from months to weeks. Government grants covering subscription fees amplify this momentum, especially in Malaysia’s “SME Digital Leap” scheme.
Large enterprises shift focus to AI-embedded orchestration suites and process-mining integrations that unveil system bottlenecks enterprise-wide. They increasingly demand vendor-agnostic connectors able to orchestrate legacy RPA engines, document-processing tools, and conversational AI gateways within one control panel. This bifurcation prompts platform vendors to release “lite” tiers for startups while reserving premium AI modules for Fortune 500 clients.
By Deployment Mode:
Cloud Momentum Challenges On-Prem DominanceDespite on-premises setups still delivering 77.55% of the Asia-Pacific robotic process automation market share in 2025, cloud deployments are posting a 35.4% CAGR. Telecom and manufacturing players favor local hosting to satisfy data-residency clauses, yet greenfield projects launch directly on vendor-managed SaaS to sidestep server procurement. Australian banks operate secure virtual private clouds while exploiting public-cloud elasticity for test environments.
Hybrid adoption patterns are crystallizing: sensitive data processing stays behind corporate firewalls, whereas intensive, short-term workloads such as year-end reconciliations burst to cloud nodes. This dual setup minimizes latency for shop-floor integrations yet grants CFOs usage-based cost curves. SMEs, lacking data-center budgets, default to cloud RPA and accept vendor security certifications as adequate assurance.

By End-User Industry:
Healthcare Races AheadHealthcare and life sciences post a 34.1% CAGR, outstripping all other sectors as hospitals automate claims adjudication, electronic medical record updates, and pandemic-accelerated tele-consultation billing. Singapore’s health cluster now processes patient refunds 80% faster after bot deployment, improving cash-flow visibility. BFSI remains the revenue leader due to 27.25% market share, leveraging bots for anti-money-laundering checks and instant loan decisioning.
Manufacturing continues its Industry 4.0 pivot, integrating shop-floor sensors with ERP bots that auto-generate maintenance work orders. Telecom operators use bots internally to validate SIM registrations, then productize the same assets as managed-automation services for enterprise clients. Slow-moving verticals such as mining adopt selective use cases, chiefly purchase-order matching, until ruggedized networks improve field connectivity.
Geography Analysis
China and India Robotic Process Automation Market
China and India command the highest absolute spend owing to population scale and government digital transformation roadmaps that bake automation targets into industrial policies. Provincial grants in China reimburse up to 40% of qualifying RPA investments, pushing even mid-tier factories to seek bots for invoice capture and customs documentation. India’s Digital Public Infrastructure stack lets bots plug directly into GST and e-invoice portals, driving sustained demand across finance back-offices.
Japan and South Korea Robotic Process Automation Market
Japan boasts the region’s highest per-capita deployment density. Municipal bodies in Tokyo and Osaka collectively run over 10,000 production bots, aided by the Digital Agency’s standardized templates. South Korea follows closely, with telecom giant KT reporting USD 7.4 million annual savings after full-scale rollout. These mature markets now emphasize AI-enhanced orchestration that eases escalations to human co-workers during edge cases.
Oceania and APAC Robotic Process Automation Market
Australia and New Zealand represent high-cloud-maturity environments where financial-services regulators have clarified shared-responsibility models, accelerating cloud RPA adoption. Singapore operates as a regional showcase: stringent but clear data rules plus government co-funding stimulate early adoption that spills over into Malaysia, Indonesia, and Thailand via shared service centers. In emerging Southeast Asian economies, talent scarcity and fragmented privacy regulations temper growth, yet vendor alliances with local universities aim to narrow the skills gap over the forecast horizon.
Regulatory Landscape
The regulatory environment shaping RPA demand across Asia-Pacific is increasingly linked to data governance and AI assurance, which raises expectations around auditability, access controls, and local hosting in automated workflows. Enterprises deploying bots over personal or regulated data typically have to map deployments to jurisdiction-specific privacy regimes such as China’s PIPL, Singapore’s PDPA, and Japan’s APPI, which often leads to separate instances or localized orchestration for cross-border operations.
In 2026, Singapore’s Infocomm Media Development Authority (IMDA) introduced a Model AI Governance Framework for Agentic AI and issued an updated version in May 2026, reinforcing governance expectations for autonomous, decision-capable systems that increasingly converge with advanced automation. Public-sector adoption and regulated-industry rollouts also incorporate procurement and compliance checklists that favor platforms offering data residency options and built-in controls for logging and oversight, particularly as governments expand digitization programs and publish AI governance guidance.
Value Chain Analysis
The Asia-Pacific RPA value chain starts with platform vendors supplying core RPA software, orchestration, and adjacent modules such as process mining and intelligent document processing, with hyperscalers and local cloud providers supplying the underlying infrastructure. System integrators, IT service providers, and telecom-led managed service firms then design, deploy, and operate automations. Training partners and vendor academies also build citizen-developer and administrator capability, which is especially relevant in markets where certified RPA talent is harder to find outside major metros.
Downstream, enterprise buyers increasingly procure outcomes rather than discrete bot licenses, which pushes vendors and integrators toward bundled transformation engagements and managed automation operations. Localization and compliance have become operational bottlenecks and differentiators across the chain, including UiPath launching Automation Cloud on Microsoft Azure in South Korea in May 2026 to address local data residency and service delivery needs. As agentic and case-led orchestration capabilities expand, value shifts toward ongoing optimization, governance, and change management services rather than one-time implementation.
Competitive Landscape
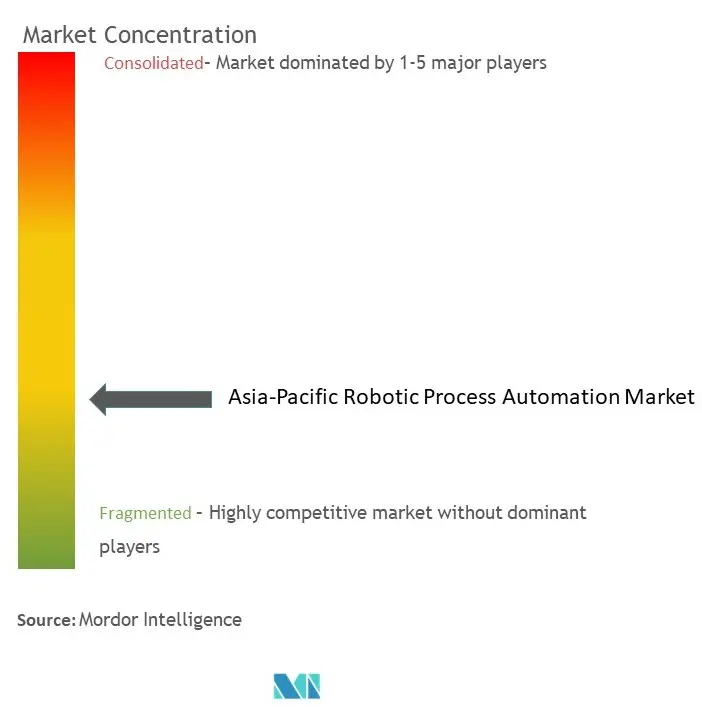
Market concentration is moderate. UiPath leads via an end-to-end platform that bundles process mining, IDP, and AI agents, reinforced by new Azure and Google Cloud tie-ins. Automation Anywhere differentiates through built-in generative-AI copilots that auto-document workflows. Blue Prism’s focus on high-security deployments keeps it strong in Japanese and Australian government accounts.
Regional challengers, including EdgeVerve Systems and AntWorks, exploit local language packs and vertical templates, often partnering with telecoms to embed bots into managed service deals. Hyperscalers such as Microsoft embed RPA add-ons within broader low-code suites, pricing aggressively to undercut standalone engines. This blurs category lines but expands the total market by democratizing access.
M&A remains robust: Baker Tilly’s acquisition of Alirrium in late 2024 bolstered advisory reach into U.S. federal accounts, and Robofice’s 2025 alliance with Omron ties manufacturing process re-engineering to shop-floor robotics. Vendors increasingly cross-sell AI-assisted document processing to hedge commoditization of basic task bots. White-space exists for compliance automation platforms that unify privacy rules across APAC jurisdictions.
Asia-Pacific Robotic Process Automation Industry Leaders
Automation Anywhere Inc.
AntWorks Pte Ltd.
Pegasystems Inc.
UIPath Inc.
Blue Prism Limited
- *Disclaimer: Major Players sorted in no particular order
Asia-Pacific Robotic Process Automation Market Companies Covered in this Report
- Automation Anywhere Inc.
- UiPath Inc.
- Blue Prism Limited
- Pegasystems Inc.
- NICE Ltd.
- Kofax Inc.
- WorkFusion Inc.
- AntWorks Pte Ltd.
- Datamatics Global Services Ltd.
- EdgeVerve Systems Ltd.
- Softomotive Ltd. (Microsoft)
- AutomationEdge Technologies Inc.
- HelpSystems LLC (Fortra)
- Kryon Systems Ltd.
- NTT DATA Corporation
- IBM Corporation
- SAP SE
- Salesforce, Inc.
- Samsung SDS Co., Ltd.
- Tata Consultancy Services Ltd.
Read Analysis of Asia-Pacific Robotic Process Automation Companies

Market Opportunities and Future Outlook
Opportunities increasingly center on governance-ready automation in public sector and regulated industries, where procurement standards and policy frameworks call for auditable controls, secure deployment patterns, and clear accountability for AI-assisted actions. Japan’s Digital Agency provides a concrete demand anchor through the April 2026 launch of the large-scale pilot for Government AI Gennai, covering about 180,000 government employees across ministries and agencies (scheduled through March 2027), which creates room for vendors and integrators to package compliant automation, workflow redesign, and monitoring capabilities aligned to government operating models.
A second opportunity area is compliance-aligned, data-sovereign deployment architectures for hybrid environments. As organizations reconcile fragmented privacy rules and sector standards with the need to scale automation beyond pilots, demand continues for on-premises or sovereign-cloud compatible suites, along with service providers that deliver governance frameworks, audit logging, and security hardening aligned to financial and enterprise cybersecurity requirements, including Australia’s APRA CPS 234 for regulated institutions and similar algorithmic governance expectations referenced in Japan’s financial services environment.
Recent Industry Developments in Asia-Pacific Robotic Process Automation Market
- June 2026: Pegasystems invested INR 60 crore to establish a new Bengaluru hub that is about 1.5 times larger than its prior facility and includes an Executive Briefing Centre. The expansion strengthens regional delivery and partner engagement capacity in India, supporting larger-scale implementations and co-innovation programs across Asia-Pacific enterprise accounts.
- May 2026: UiPath released agentic AI capabilities for its Automation Suite aimed at public sector and regulated industries seeking on-premises control while integrating with platforms such as AWS, Microsoft Azure, and Red Hat OpenShift. The release directly targets data sovereignty and governance requirements that shape RPA platform selection in regulated APAC deployments.
- September 2024: Baker Tilly acquired Alirrium to expand its automation and advisory capabilities, adding scale in automation services. The deal reinforced competitive pressure on specialist consultancies and integrators as buyers look for end-to-end transformation support alongside RPA tooling.


Asia-Pacific Robotic Process Automation Market Report Scope and Research Methodology
Market Definition and Coverage
This market covers revenue generated from robotic process automation (RPA) in Asia Pacific, including software platforms and related services used to automate routine, rules-based digital tasks across business functions.
Scope exclusions: it excludes physical industrial robots, pure BPM suites without an RPA layer, and generic IT outsourcing revenue that is not tied to RPA deployment or support.
Segments Covered in This Report
- By Solution
- Software
- Services
- Consulting
- Implementation and Integration
- Training and Support
- By Enterprise Size
- Small and Medium Enterprises
- Large Enterprises
- By Deployment Mode
- On-Premises
- Cloud
- By End-user Industry
- BFSI
- IT and Telecom
- Healthcare and Life Sciences
- Retail and eCommerce
- Manufacturing
- Mining and Natural Resources
- Utilities and Energy
- Government and Public Sector
- Others
- By Geography
- China
- India
- Japan
- South Korea
- Australia and New Zealand
- Singapore
- Rest of Asia-Pacific
Data Sources, Market Sizing, and Validation
Desk Research
Desk research starts by building a consistent demand context for automation in Asia Pacific, then converting it into an RPA spend pool using public markers. We use the International Telecommunication Union for digital readiness signals, the World Bank for macro and services-sector structure, national statistics offices for employment and wage trends, and central bank releases to interpret enterprise spending cycles.
To ground assumptions on technology adoption and compliance drivers, we also review public guidance and publications from government digital economy bodies, privacy regulators, and cyber agencies across key APAC countries. We complement these sources with peer reviewed papers and patent databases that indicate where automation capabilities are moving. Company annual reports, earnings decks, and product notes are used to map pricing motion and the services mix. A paid subscription for company financials and news supports validation of revenue direction and major deal momentum. These are illustrative sources, and many other public references are also used during data collection, cross-checking, and clarification.
Primary Interviews and Surveys
Primary interviews and short surveys focus on RPA buyers, implementers, and solution partners across major APAC economies to confirm adoption pace, pricing behavior, and the typical bundling of software and services. We also re-check items that are hard to see in public data, including renewal timing, cloud migration patterns, and the split between attended and unattended automation use cases.
Distribution of primary research fieldwork respondents
| Company type | Respondent position |
|---|---|
| Top tier: 33% | CXOs: 13% |
| Mid tier: 51% | Functional/Unit leaders: 34% |
| Smaller Players: 16% | Managers: 53% |
Market-Sizing & Forecasting
For the core model, we size the market using a top-down demand pool approach where enterprise software and IT services spending is reconstructed by country and then narrowed using RPA penetration by industry and deployment preference. The totals are corroborated through selective bottom-up checks, including sampled vendor and partner revenue signals, channel checks, and a price times volume reasonableness test for bots, licenses, and service hours.
Inputs used in the model include cloud adoption rates in enterprises, wage inflation for back office roles, regulated process intensity in sectors like BFSI, the share of large enterprises versus SMEs in each country, and the typical software-to-services mix observed in implementations. Where coverage is uneven across smaller countries, gaps are handled through proxy indicators such as ICT intensity and services sector share, and these proxies are reviewed with local experts before use.
Forecasting is run using scenario analysis supported by multivariate regression. Adoption drivers such as cloud migration and labor cost pressure are varied within realistic bands and then aligned to what interviewees expect for budget cycles and deployment speed. Assumptions are kept transparent so they can be repeated and stress-tested using the same public indicators.
Data Validation & Update Cycle
Validation is performed in layers, starting with internal consistency checks across country totals, the software versus services split, and deployment shares to ensure the model tracks actual buying patterns. We then compare outputs against independent signals such as enterprise IT spend direction, automation hiring trends, and visible partner activity. If outputs show sharp variance, we re-check inputs and follow up with a selected set of respondents.
Before sign-off, the model and written logic go through multi-step analyst review, including reasonableness checks on growth rates and currency conversion timing. The report is refreshed annually, with interim updates when major events materially change demand, such as policy changes, large platform shifts, or abrupt macro slowdowns. Right before delivery, a final review pass is completed so clients receive the most current view available.
Mordor Intelligence's Asia Pacific Robotic Process Automation Market Size Compared Against Other Published Estimates
Published market sizes for APAC RPA often differ because the included product scope is not the same, and year labeling is sometimes unclear, which changes the growth math. Variation also shows up when services are counted broadly as automation consulting, or when values are scaled from a global figure without separately checking country-level adoption signals.
Some estimates expand scope into wider hyperautomation and adjacent workflow tools, and they may use regional shares applied to a global total without separating software revenue from implementation-heavy services. In the Mordor Intelligence approach, sizing is tied to RPA software plus directly linked RPA services in Asia Pacific. Adjacent automation categories are only counted when they are sold as part of an RPA program and appear as RPA revenue in checks.
Benchmark comparison
| Source | Market Size | Gaps in Research Methodology |
|---|---|---|
| Mordor Intelligence | USD 1.21 B (2025) | |
| Industry Publisher A | USD 0.75 B (2024) | Uses an older reference point with limited clarity on whether the value is buyer spend or supplier revenue, and the services definition appears narrower, which can understate large implementation programs. |
| Global Publisher B | USD 3.67 B (2025) | Appears to treat APAC as a regional slice of a global RPA total and may include broader cognitive automation and RPA-as-a-service bundles, which can push the counted revenue beyond core RPA platform plus directly attached services. |
The spread is mainly explained by scope width, year alignment, and how services and adjacent automation tools are treated in the count. When the market is anchored to country adoption signals and clearly defined revenue components, the final number becomes easier to trace, review, and update as conditions change.


Key Questions Answered in the Report
How large is the Asia-Pacific robotic process automation market today?
It reached USD 1.61 billion in 2026 and is forecast to climb to USD 6.83 billion by 2031, expanding at a 33.45% CAGR.
Which end-user vertical is growing fastest?
Healthcare and life sciences lead growth with a 34.1% CAGR thanks to claims digitization and telehealth billing automation.
Are cloud deployments overtaking on-premises bots?
New projects favor cloud models, resulting in a 35.4% CAGR for cloud even though on-premises still holds 77.55% share from earlier rollouts.
What constrains adoption in tier-2 cities?
Shortages of certified RPA talent extend implementation timelines and increase reliance on remote delivery teams.
How is generative AI influencing platform selection?
Buyers increasingly prioritize suites that embed large-language models for self-healing bots and autonomous agents, elevating AI-ready platforms over basic task-automation engines.
Page last updated on:





