
Market Overview
| Study Period | 2020 - 2031 |
|---|---|
| Forecast Data Period | 2026 - 2031 |
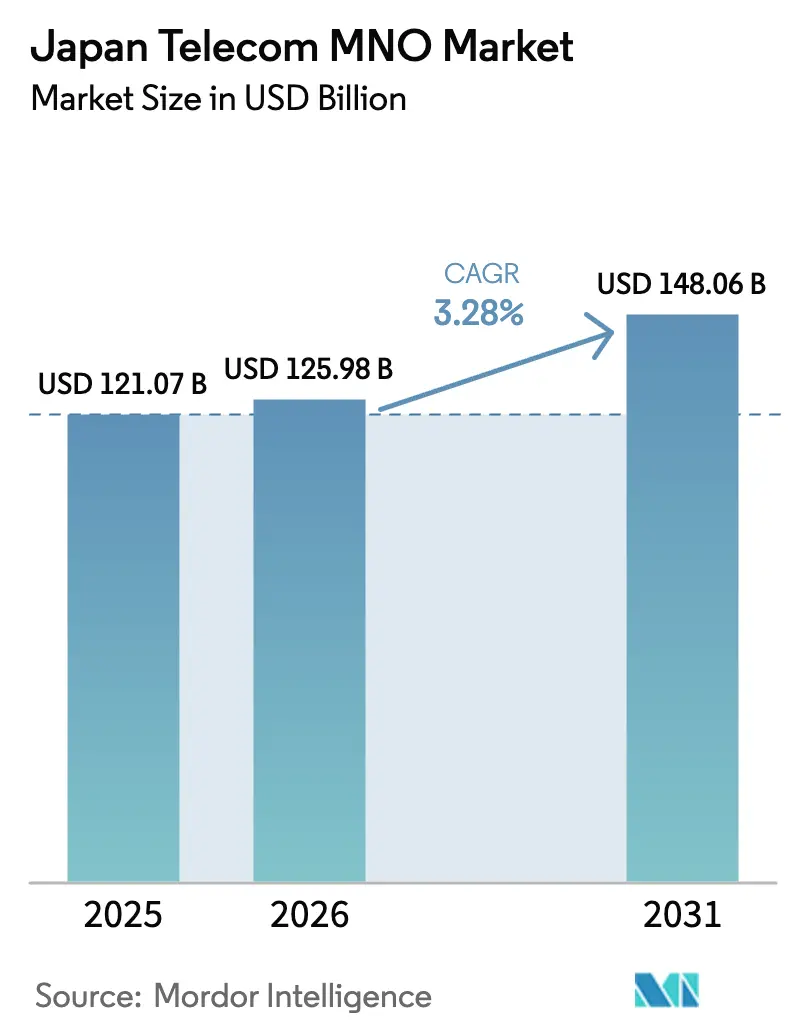
| Base Year Market Size (2025) | USD 121.07 Billion |
| Market Size (2026) | USD 125.98 Billion |
| Market Size (2031) | USD 148.06 Billion |
| Growth Rate (2026 - 2031) | 3.28 % |
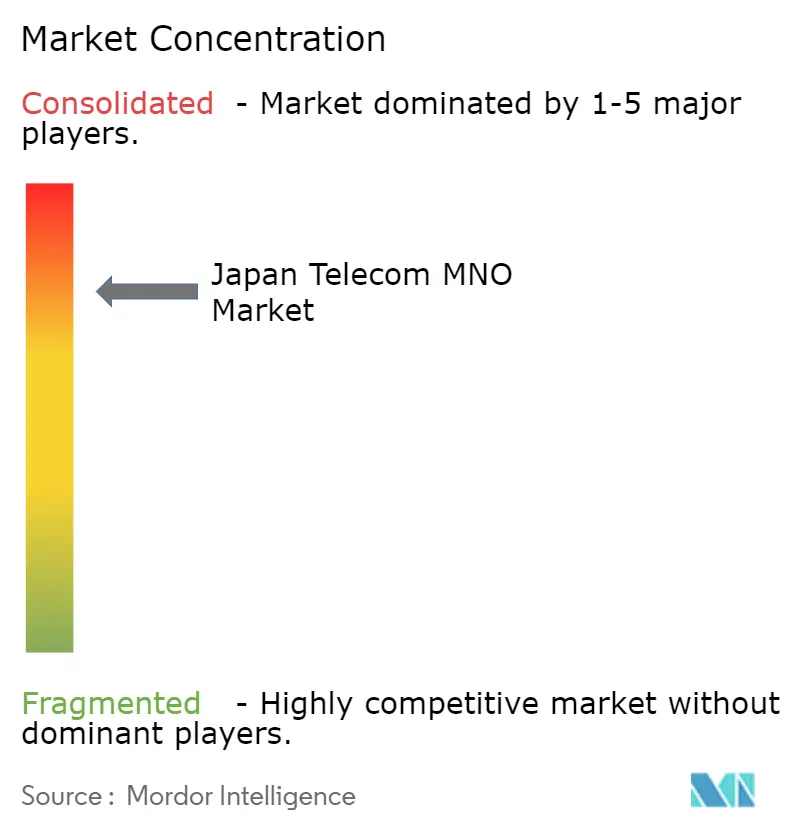
| Market Concentration | High |
Major Players *Disclaimer: Major Players sorted in no particular order Image © Mordor Intelligence. Reuse requires attribution under CC BY 4.0. | |
Japan Telecom MNO Market Analysis by Mordor Intelligence
The Japan telecom MNO market size is projected to be USD 125.98 billion in 2026 and reach USD 148.06 billion by 2031, growing at a CAGR of 3.28% from 2026 to 2031. Subscriber penetration already exceeds 150%, so topline growth depends on 5G-stand-alone monetization, fixed-mobile convergence bundles, and enterprise Internet of Things (IoT) use cases. Operators are racing to densify 3.7 GHz and 4.5 GHz macro-cells while off-loading peak traffic to home Wi-Fi and fiber backhaul, a strategy that holds average revenue per user (ARPU) flat despite continuing price competition. New revenue streams arise from network application programming interfaces (APIs) that let enterprises invoke assured quality on demand, location verification, and device-identity services. At the same time, satellite-cellular hybrids improve coverage in Japan’s rugged terrain, and all-photonics backbone upgrades shrink energy cost per bit, cushioning profitability against surging data traffic.
Key Report Takeaways
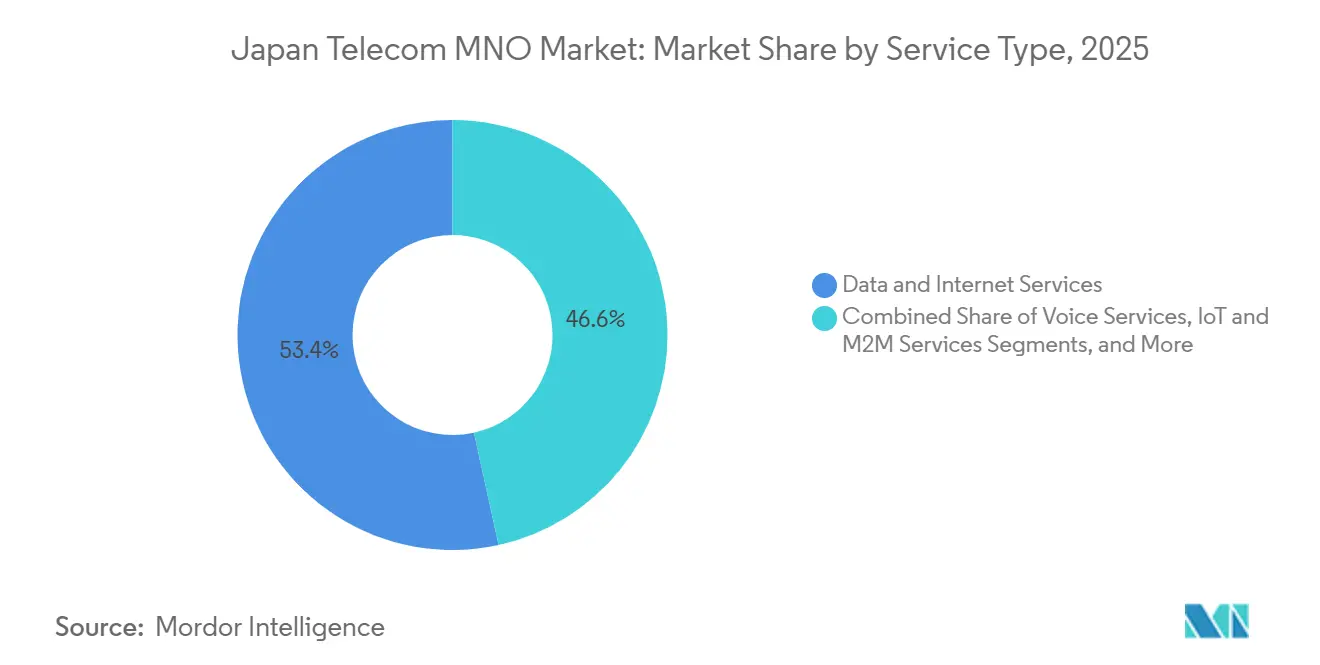
- By service type, Data and Internet Services held 53.43% of the Japan telecom MNO market share in 2025, while IoT and M2M Services is set to expand at a 3.44% CAGR to 2031.
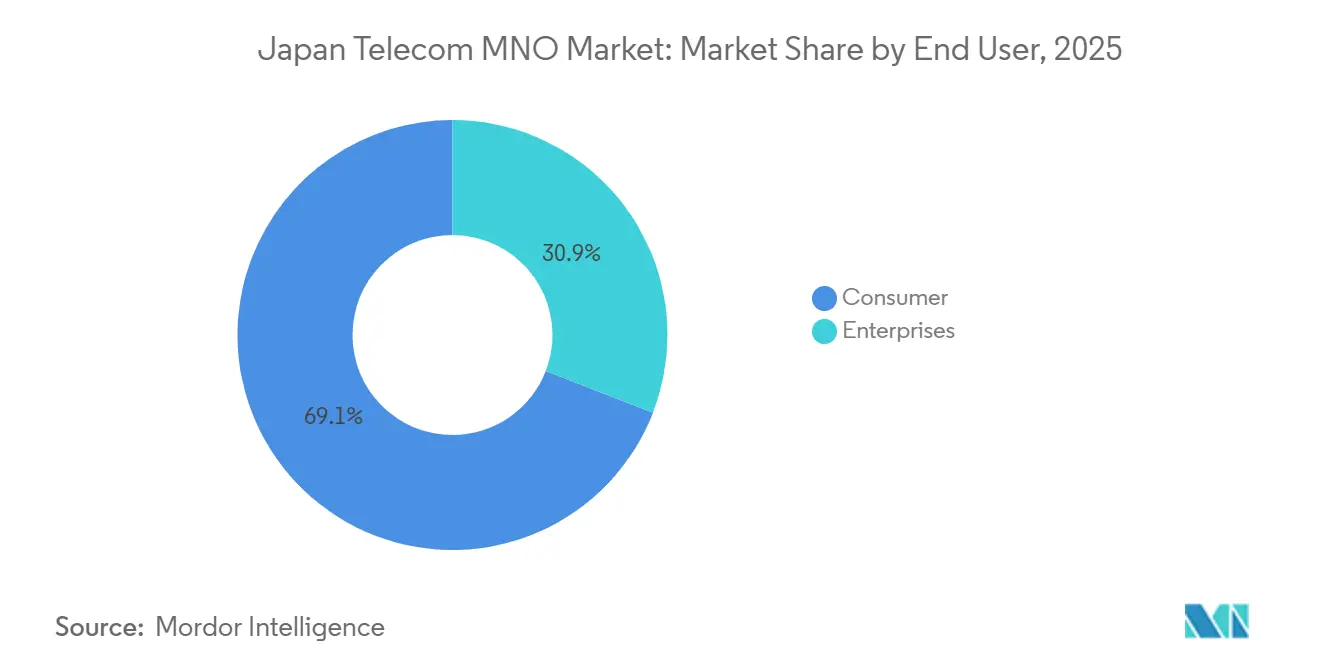
- By end-user, Consumer subscribers captured 69.12% revenue in 2025; the Enterprises segment is advancing at a 3.59% CAGR through 2031.
Note: Market size and forecast figures in this report are generated using Mordor Intelligence’s proprietary estimation framework, updated with the latest available data and insights as of 2026.
Japan Telecom MNO Market Trends and Insights
Drivers Impact Analysis*
| Driver | (~) % Impact on CAGR Forecast | Geographic Relevance | Impact Timeline |
|---|---|---|---|
| 5G Standalone Expansion and Private Network Monetization | +0.9% | Tokyo, Osaka, Nagoya industrial corridors | Medium term (2-4 years) |
| Explosion of Ultra-HD Video and XR Data Traffic | +0.7% | Urban centers nationwide | Short term (≤ 2 years) |
| Digital Garden City Nation Strategy Catalyzing Regional IoT Uptake | +0.5% | Regional smart-city zones | Long term (≥ 4 years) |
| Fixed-Mobile Convergence Driving Premium Bundled ARPU | +0.4% | Fiber-dense metropolitan areas | Medium term (2-4 years) |
| Satellite-Cellular Hybrid Connectivity Licenses Opening Rural Markets | +0.3% | Remote islands and mountains | Long term (≥ 4 years) |
| Monetization of Network APIs via GSMA Open Gateway Framework | +0.2% | Major business districts | Medium term (2-4 years) |
| Source: Mordor Intelligence | |||
5G Standalone Expansion and Private Network Monetization
NTT Docomo activated 6.6 Gbps downlink service in early 2025 by aggregating sub-6 GHz and millimeter-wave bands, showcasing real-time 8K video and machine-vision control. Enterprises are licensing n79 spectrum slices for robotics, semiconductor tooling, and smart logistics, supported by the Ministry of Internal Affairs and Communications (MIC) registration regime that obliges carriers to appoint certified chief telecommunication engineers, a structure that protects incumbents’ margins. SoftBank’s latency-optimization trial with Ericsson in late 2024 achieved sub-5 ms round-trip delay, bolstering standalone cores as revenue generators for deterministic industrial traffic. MIC’s 2025 Beyond 5G white paper projects enterprise private networks to absorb 15% of total mobile infrastructure outlays by 2030.[1]Ministry of Internal Affairs and Communications, “Statistics on Telecommunications Services,” soumu.go.jp
Explosion of Ultra-HD Video and XR Data Traffic
Fixed-line traffic jumped 15.3% year-over-year in May 2025, while 5G handset growth lifted mobile usage in parallel. MIC forecasts immersive content to push volumes ten-fold by 2030, forcing operators to densify small cells and deploy edge computers. NTT Docomo’s fiscal-2025 interim report logged double-digit data growth, with premium unlimited tiers shielding ARPU. Ericsson’s mid-2025 Mobility Report cites artificial-intelligence spectrum allocation as key to handling asymmetric uplinks from live XR streams.[2]Ericsson, “Mobility Report North East Asia 2025,” ericsson.com Bundling streaming or metaverse access into tiered plans lets carriers upsell without proportional cost, provided content-delivery caches sit close to users.
Digital Garden City Nation Strategy Catalyzing Regional IoT Uptake
MIC’s Digital Garden City Nation blueprint pledges 99% 5G coverage by fiscal 2030 and 99.9% fiber-to-the-home by fiscal 2027, undergirding rural telemedicine, smart agriculture, and municipal sensor grids. KDDI’s ConnectIN added 45.5 million IoT lines by March 2024, many in regional prefectures facing labor shortages.[3]KDDI Corporation, “ConnectIN IoT Platform Update,” kddi.com NTT Docomo’s business SIGN IoT, launched December 2025, blends LoRaWAN and satellite backhaul for forestry and agriculture. Mizuho Bank projects machine-to-machine revenue to exceed JPY 530 billion by 2030 (USD 3.9 billion).[4]Mizuho Bank, “IoT Market Outlook 2030,” mizuhobank.co.jp Cabinet Office smart-city pilots co-fund local sensors, lowering risk for operators and accelerating the Japan telecom MNO market transition toward B2B IoT streams.
Fixed-Mobile Convergence Driving Premium Bundled ARPU
NTT’s Innovative Optical and Wireless Network (IOWN) 2.0 in 2025 fused fiber backbone and mobile radios, enabling unified gigabit fiber and 5G billing. NTT Docomo’s docomo MAX combines unlimited 5G, 10 Gbps fiber, and streaming for household ARPU above JPY 10,000 (USD 67.9).[5]NTT Communications, “TypeD Private 5G Service,” ntt.com KDDI’s Vision 2030 cross-sells banking, electricity, and entertainment, raising lifetime value. Shared backhaul lowers capex intensity and streamlines care systems, offsetting stagnant subscriber growth. Submission of bundle terms to MIC ensures transparency, a process that smaller challengers find resource-heavy, cementing incumbents’ moat.
Restraints Impact Analysis*
| Restraint | (~) % Impact on CAGR Forecast | Geographic Relevance | Impact Timeline |
|---|---|---|---|
| Intensifying Price Competition Among MNOs Compressing Margins | -0.8% | National, Most Acute in Phnom Penh and Other Urban Centers | Short Term (≤ 2 Years) |
| High Rural Deployment Costs Versus Low Income Base | -0.6% | Remote Provinces (Ratanakiri, Mondulkiri, Preah Vihear, Stung Treng) | Medium Term (2–4 Years) |
| Limited Fiber Backhaul Causing Capacity Bottlenecks | -0.4% | Semi-Urban and Deep Rural Districts | Short Term (≤ 2 Years) |
| Regulatory Uncertainty on Active Sharing Delaying 5G Small Cells | -0.3% | Dense Urban Zones That Need Indoor Micro-Sites | Medium Term (2–4 Years) |
| Source: Mordor Intelligence | |||
Aging and Declining Population Limiting Subscriber Growth
Japan’s population fell below 123 million in 2025 with a median age above 49, trimming organic handset uptake. Cellular lines stood at 193 million, leaving scant headroom outside IoT. Rakuten Mobile’s 8.5 million users in early 2025 faced churn as price hunters rotated to promotions. Operators tailor elder-care voice assistants, yet these generate modest data income. MIC’s Mobile Software Competition Act, effective 2025, enhances portability, boosting price sensitivity and eroding loyalty.
Continued Government Pressure on Tariffs Depressing ARPU
Successive administrations compelled roughly 40% retail-price cuts between 2018-2020, and MIC annual reviews sustain downward tension. Rakuten’s JPY 1,980 (USD 12.7) 20 GB plan in May 2025 rekindled price wars. Incumbents answered with discount sub-brands ahamo, povo, and LINEMO, cannibalizing premium tiers. App-store fee mandates limit content-bundle upsell, so carriers pivot to enterprise slices and API revenue insulated from consumer price caps.
*Our forecasts treat driver/restraint impacts as directional, not additive. The impact forecasts reflect baseline growth, mix effects, and variable interactions.
Segment Analysis
By Service Type: Data Dominance With IoT Upside
Data and Internet Services accounted for over half of 2025 revenue, supported by 92.367 million 5G subscriptions and double-digit fixed broadband traffic growth. The Japan telecom MNO market size tied to IoT and M2M Services is forecast to expand fastest at a 3.44% CAGR thanks to fleet telematics, industrial robotics, and rural smart-city sensors, a trajectory underscored by KDDI ConnectIN’s 45.5 million lines and NTT Docomo’s business SIGN IoT rollout. Voice and SMS continue to shrink as over-the-top applications dominate, while pay-TV bundles cushion ARPU through premium content licensing.
Operators are now packaging network APIs into developer marketplaces, an initiative aligned with the GSMA Open Gateway framework demonstrated by KDDI at Mobile World Congress 2025. The Japan telecom MNO market size for these APIs remains nascent, yet global projections reach USD 300 billion by 2030. Regulatory oversight of interconnection under the Telecommunications Business Law tempers innovation velocity but ensures nondiscriminatory wholesale pricing, balancing competition and stability.



By End-User: Enterprise Velocity Outpacing Consumer Scale
Consumer lines still supply 69.12% of 2025 revenue, sustained by high smartphone penetration and unlimited-data indulgence, with Opensignal clocking above-30% 5G availability in major prefectures. Yet demographic drag and regulatory price caps limit further expansion, pushing carriers toward bundled fiber-mobile offers that raise household stickiness rather than chasing new handsets.
Enterprises deliver the quickest growth at a 3.59% CAGR: private 5G slices power robotic welding, augmented-reality maintenance, and autonomous guided vehicles in factories, while AU Starlink Direct satellite-cellular hybrids secure offshore rigs and remote construction. Average enterprise ARPU runs three-to-five times higher than consumer plans because contracts bundle service-level agreements, edge computing, and cybersecurity audits mandated by the 2024 National Security Act. These characteristics position the Japan telecom MNO market as a vital digital infrastructure backbone for corporate Japan.
Geography Analysis
Japan’s dense urban corridors of Tokyo, Osaka, and Nagoya command the lion’s share of the Japan telecom MNO market size, thanks to population clustering and enterprise headquarters concentration. 5G population coverage hit 98.4% nationwide by fiscal 2024, yet metro areas still draw the most capital for mid-band refarming and millimeter-wave infill. High-rise propagation challenges in Tokyo push operators to deploy indoor small cells and distributed-antenna systems, a capex cycle that supports vendor revenue
Regional prefectures benefit from the Digital Garden City Nation grants that subsidize smart-agriculture sensors and telehealth nodes, lifting IoT line density. Rakuten Mobile focuses rural rollouts on inexpensive open-RAN gear to close its coverage gap, but MIC administrative guidance on base-station delays revealed compliance hurdles that slow progress. Remote islands and mountainous districts are the proving ground for satellite-cellular hybrids, where KDDI’s AU Starlink Direct service integrates low-Earth-orbit links with terrestrial core handoff.
Looking ahead, the first spectrum auction for 26 GHz and 40 GHz bands scheduled before March 2026 could reshape millimeter-wave holdings, inviting new niche entrants to Tokyo’s stadiums and entertainment districts. Still, strict MIC build-out obligations and security vetting under the 2024 supply-chain law mean incumbents with deep balance sheets remain favored to defend share. Thus, urban densification, regional IoT enablement, and remote-area satellite augmentation together sustain the geographically balanced advance of the Japan telecom MNO market.
Regulatory Landscape
Japan's mobile network operators operate under the Ministry of Internal Affairs and Communications (MIC) framework, anchored by the Telecommunications Business Act and the Radio Act, which govern market entry, service registration and notification, spectrum use, and oversight of interconnection and fair competition. MIC oversight also covers interconnection charge reviews and designated facilities regimes, shaping wholesale access economics and competitive conduct as operators extend 5G standalone capabilities and expand enterprise-grade offerings.
In 2026, MIC advanced rule updates that affect network build and competitive structure. In January 2026, MIC revised MVNO-related guidelines to promote competition. In April 2026, revisions to relevant ordinances introduced a certification system for tower sharing businesses and updated the universal telecommunications services register. Together, these changes support the market's densification and sharing agenda by formalizing eligible infrastructure-sharing entities and clarifying compliance touchpoints for service providers and wholesale participants.
Value Chain Analysis
The Japan telecom MNO value chain starts with spectrum policy and compliance under MIC, then moves into network build and operations across RAN, transport, and core, before commercialization through consumer plans, fixed-mobile convergence bundles, and enterprise solutions. Incumbents such as NTT Docomo, KDDI, and SoftBank integrate vertically into fiber backhaul, data platforms, and digital services, while vendor ecosystems supply radios, core software, cloud infrastructure, and optimization tools that support 5G standalone, edge computing, and automation.
Downstream, monetization is shifting from pure connectivity toward enterprise platforms and ecosystem services, with operators packaging managed IoT connectivity, private network capabilities, and developer-facing interfaces. KDDI has driven network efficiency actions such as accelerating 3G shutdown and 5G rollout, while NTT Docomo has been reorganizing adjacent businesses, including consolidation of financial services under a dedicated group structure (announced for July 2026), to strengthen distribution, retention, and cross-sell. Infrastructure sharing is becoming a more defined layer of the chain as MIC implements a certification system for tower sharing businesses, aligning neutral-host and co-build models with national coverage goals and cost-efficiency needs.
Competitive Landscape
The Japan telecom MNO market concentrates heavily in three incumbents, NTT Docomo, KDDI, and SoftBank, who together hold roughly 97% subscriber share. NTT Docomo leverages parent NTT’s fiber footprint and IOWN roadmap to bundle 10 Gbps home broadband, mobile unlimited data, and over-the-top video, elevating household ARPU and deterring churn. KDDI differentiates through cross-sector convergence, folding payment apps, energy retail, and esports into its AU ecosystem. SoftBank emphasizes artificial-intelligence radio resource management via its AI-RAN initiative, trimming latency and boosting spectral efficiency.
Rakuten Mobile, the only recent entrant, attained full-year profitability in fiscal 2025 but still controls just 2.6% share. It pursues vendor-diverse open-RAN deployment with Fujitsu and Nokia while marketing the nation’s cheapest large-bucket data plan to lure switchers. Structural barriers persist: stringent MIC quality-of-service rules and National Security Act component vetting impose compliance overhead that smaller challengers struggle to absorb.
Strategic moves in 2025-2026 underscore the innovation race. NTT Docomo is trialing direct satellite-to-smartphone links to match KDDI’s Starlink reseller agreement. SoftBank and Nokia inked a Western-Japan modernization deal covering AirScale radios and AI-driven MantaRay orchestration. Tower-sharing specialist JTower is rolling out neutral-host 5G poles that reduce duplicate capex and align with government policy to accelerate densification. All players collaborate on disaster-recovery refueling drills, reflecting regulatory expectations for resilient national networks.
Japan Telecom MNO Industry Leaders
NTT Docomo, Inc.
KDDI Corporation (au)
SoftBank Corp.
Rakuten Mobile, Inc.
- *Disclaimer: Major Players sorted in no particular order

Market Opportunities and Future Outlook
Enterprise-grade networks and platforms remain the clearest whitespace for incremental monetization in Japan's high-penetration mobile environment, especially where assured quality, deterministic latency, and resilient coverage are required. Active operator programs already point to addressable demand, with KDDI's ConnectIN scaling to 45.5 million IoT lines by March 2024 and NTT Docomo launching business SIGN IoT in December 2025 to expand low-power connectivity options for agriculture and forestry, including satellite backhaul use cases. These deployments broaden the pool of devices and service contracts beyond traditional handset growth and tie into government coverage and digitalization targets.
On the technology and policy front, public programs and standardization work open additional opportunity zones across advanced radio and next-generation networks. MIC's Beyond 5G roadmap highlights 6G and AI-RAN as national priorities, including a July 2026 letter of intent with NVIDIA for collaboration on 6G and AI-RAN, and MIC has positioned High-Altitude Platform Station (HAPS) domestic introduction within 2026. In parallel, operators can monetize infrastructure efficiency and resilience through tower sharing (supported by MIC's 2026 certification system), disaster-ready coverage extensions such as satellite-cellular integration, and backbone modernization programs like NTT's IOWN direction, which supports integrated optical and wireless architectures that can be productized into premium bundles and enterprise connectivity solutions.
Recent Industry Developments
- July 2026: SoftBank Corp. forms a strategic partnership with Sierra to provide AI agent powered customer experiences, exclusive partner in Japan. The alliance positions SoftBank to offer AI driven network and customer infrastructure services within the Japanese telecom ecosystem, extending its value chain beyond traditional mobile offerings. This move signals a deeper push into AI enabled telco services and customer experience optimization.
- May 2026: NTT Docomo, Inc. launches a direct satellite to smartphone service to extend disaster zone coverage. The service expands connectivity in regions where terrestrial networks are constrained, strengthening disaster resilience and widening the carrier footprint beyond conventional macro cells. It underscores how satellite connectivity can complement fixed and mobile layers to preserve service continuity in emergencies.
- May 2026: SoftBank Corp. announces the October 2026 launch of the AI Data Center GPU Cloud as part of the Neocloud business. The data center cloud offering provides enterprises with AI powered infrastructure and accelerates cloud based telecom services. It enhances SoftBank output by reinforcing an AI native telecom and enterprise service stack.


Research Methodology Framework and Report Scope
Market Definition and Coverage
For this methodology, the Japan telecom market is defined as the revenues earned from providing telecom connectivity and related services in Japan across mobile and fixed networks, counted at the service-provider level in nominal US dollars.
Scope exclusions: We do not count handset or network equipment sales, systems integration, or pure media content revenues that are not billed as a telecom service.
Segmentation Overview
- Overall Telecom Revenue and ARPU
- Service Type
- Voice Services
- Data and Internet Services
- Messaging Services
- IoT and M2M Services
- OTT and PayTV Services
- Other Services, Roaming and International Services, Enterprise and Wholesale Services
- End-User
- Enterprises
- Consumer
Data Sources, Market Sizing, and Validation
Desk Research
Desk work started by building a clean revenue pool using public Japanese statistics and consistent service labels. We relied on sources such as the Ministry of Internal Affairs and Communications (MIC) Information and Communications White Paper, MIC telecom service statistics releases, e-Stat datasets covering the Basic Survey on the Information and Communications Industry, and ITU indicators for high-level subscriber and traffic context.
To align the market boundary with what operators actually bill, we also reviewed annual reports, securities filings, and investor presentations for service revenue splits and plan changes. Supporting context was taken from reputable press coverage, a patent database to track major network technology activity, and a news and financials subscription for time-stamping material policy and pricing events. The desk sources listed here are illustrative only, and many other public references were used for collection, cross-checking, and clarification.
Primary Interviews and Surveys
Primary work focused on checking what drives telecom service revenue in Japan, especially pricing pressure, 5G monetization, and fiber bundle behavior at the customer level. We spoke with a mix of operators, wholesalers, enterprise connectivity users, and channel partners within Japan to validate service boundaries, churn assumptions, and the pace of migration between plans.
Where secondary data was silent or mixed, expert inputs were used to set realistic adoption curves for new offers (such as higher speed fixed broadband tiers) and to sanity-check implied ARPU trends and subscriber totals used in the model.
Distribution of primary research fieldwork respondents
| Company type | Respondent position |
|---|---|
| Top tier: 33% | CXOs: 17% |
| Mid tier: 45% | Functional/Unit leaders: 29% |
| Smaller Players: 22% | Managers: 54% |
Market-Sizing & Forecasting
Market sizing was built mainly using a top-down approach where national telecom revenue series and service splits were reconstructed into a consistent demand pool, and then converted into USD using the same year-average currency timing. After that, we corroborated totals using selective bottom-up checks, such as sampled price plan levels multiplied by subscriber bases, and cross-checks against disclosed service revenue mixes in public filings.
Inputs that shaped the model included mobile subscriber counts and 5G penetration, fixed broadband subscription levels and fiber mix, ARPU movement by consumer versus enterprise, voice-to-data revenue shift, and the pace of price actions and bundle adoption. When a variable was not disclosed cleanly, gaps were handled through bounded assumptions that were validated through interviews and then tested for sensitivity.
For forecasting, we relied on scenario analysis supported by trend indicators, and we used primary feedback to pick base-case adoption curves for 5G and fiber upgrades. By the time the main drivers were reconciled, the outlook reflected maturing subscriber growth, gradual mix shift toward data services, and a realistic price trajectory over the forecast period.
Data Validation & Update Cycle
Outputs were checked against independent signals like national telecom revenue totals, reported subscriber levels, and the implied revenue per connection to spot any unrealistic jumps. If a variance appeared, the drivers were re-tested, assumptions were revisited, and follow-up calls were triggered before final sign-off.
A multi-step analyst review was used so that the model logic, data sources, and calculations were verified by a second set of eyes. Reports are refreshed annually, and interim updates are made when there are material changes such as major pricing moves, regulation shifts, or sudden demand changes. Before delivery, we do a final update pass so clients receive the latest consistent view.
Mordor Intelligence's Japan Telecom Market Estimate Compared With Other Published Estimates
Published market values for Japan telecom can look far apart because authors do not always count the same service revenues, and some use different currency timing or fiscal-year handling. In practice, the gap usually comes from what is treated as telecom service revenue versus adjacent digital or media revenues, and from how subscriber and ARPU evidence is used to keep the number realistic.
MIC telecom revenue splits and operator-reported service revenue checks are the evidence that keep Mordor Intelligence tied to a telecom-only billing pool in Japan, which avoids pulling in wider ICT or entertainment revenues. Differences also show up when one source reports a fiscal-year yen figure and another converts to USD using a spot rate, or when forecasts assume aggressive 5G price uplift without verifying it against current plan structures and churn behavior.
Benchmark comparison
| Source | Market Size | Gaps in Research Methodology |
|---|---|---|
| Mordor Intelligence | USD 121.07 B (2025) | |
| Industry Regulator Publication A | USD 103.00 B (2022) | Often presented as a fiscal-year yen total for telecom industry sales, which can differ from calendar-year USD conversion timing and from service-only revenue mapping used in market models. |
| Industry Briefing B | USD 137.00 B (2023) | Uses a headline revenue figure with limited transparency on which services are included, and it does not show how subscriber counts, ARPU movement, and plan changes reconcile to the total. |
Looking across the three figures, the spread is mostly explained by scope boundaries, fiscal-year versus calendar-year treatment, and the visibility of the service mix behind the total. We keep the steps repeatable by tying assumptions back to revenue splits, subscriber trajectories, and pricing signals that can be rechecked during updates.


Key Questions Answered in the Report
How large will the Japan telecom MNO market be by 2031?
It is forecast to reach USD 148.06 billion by 2031, reflecting a 3.28% CAGR from 2026.
Which service category is growing fastest?
IoT and M2M Services is projected to grow at a 3.44% CAGR through 2031 as enterprises deploy smart-factory and logistics solutions.
Why is ARPU under pressure in Japan?
Government tariff reductions and aggressive discount brands have driven headline mobile prices down, forcing operators to rely on bundled fiber, content, and enterprise services to defend ARPU.
What share do the top three carriers control?
NTT Docomo, KDDI, and SoftBank together hold about 97% of mobile subscribers, making the market highly concentrated.
How are operators addressing rural coverage gaps?
They deploy satellite-cellular hybrids such as KDDI's AU Starlink Direct and plan direct satellite-to-smartphone links to extend service to remote islands and mountainous areas.
What is the main regulatory hurdle for new entrants?
Strict Ministry of Internal Affairs and Communications quality-of-service rules and supply-chain security reviews raise compliance costs, benefiting incumbents with greater resources.
Page last updated on:


 Your data is secure and never sold or shared.


