
Market Overview
| Study Period | 2020 - 2031 |
|---|---|
| Forecast Data Period | 2026 - 2031 |
| Base Year Market Size (2025) | USD 17.2 Billion |
| Market Size (2026) | USD 20.57 Billion |
| Market Size (2031) | USD 50.39 Billion |
| Growth Rate (2026 - 2031) | 19.62 % |
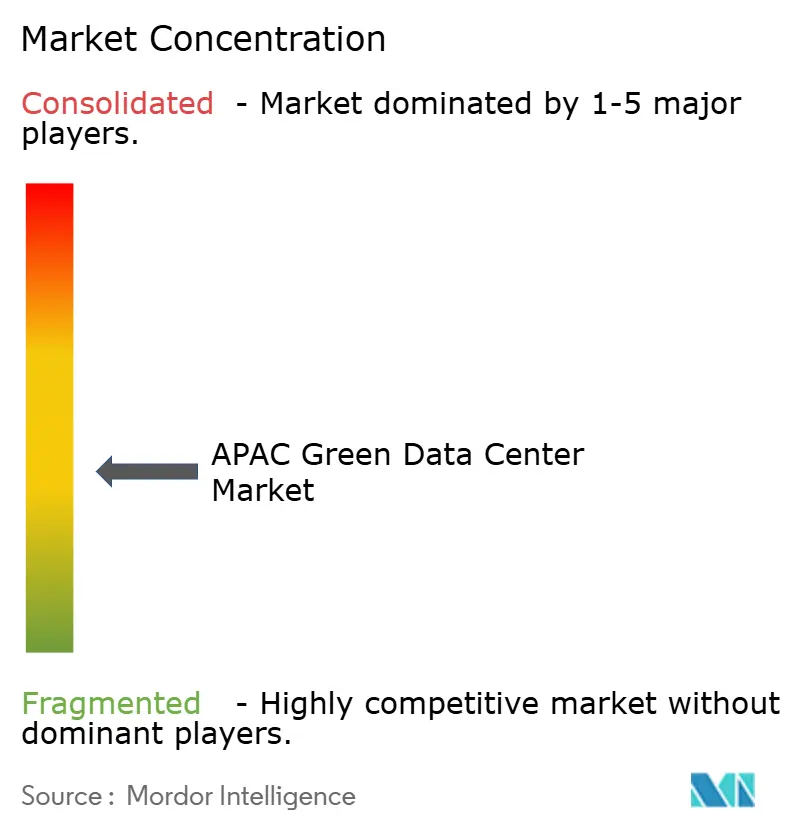
| Market Concentration | Medium |
Major Players *Disclaimer: Major Players sorted in no particular order Image © Mordor Intelligence. Reuse requires attribution under CC BY 4.0. | |
APAC Green Data Center Market Analysis by Mordor Intelligence
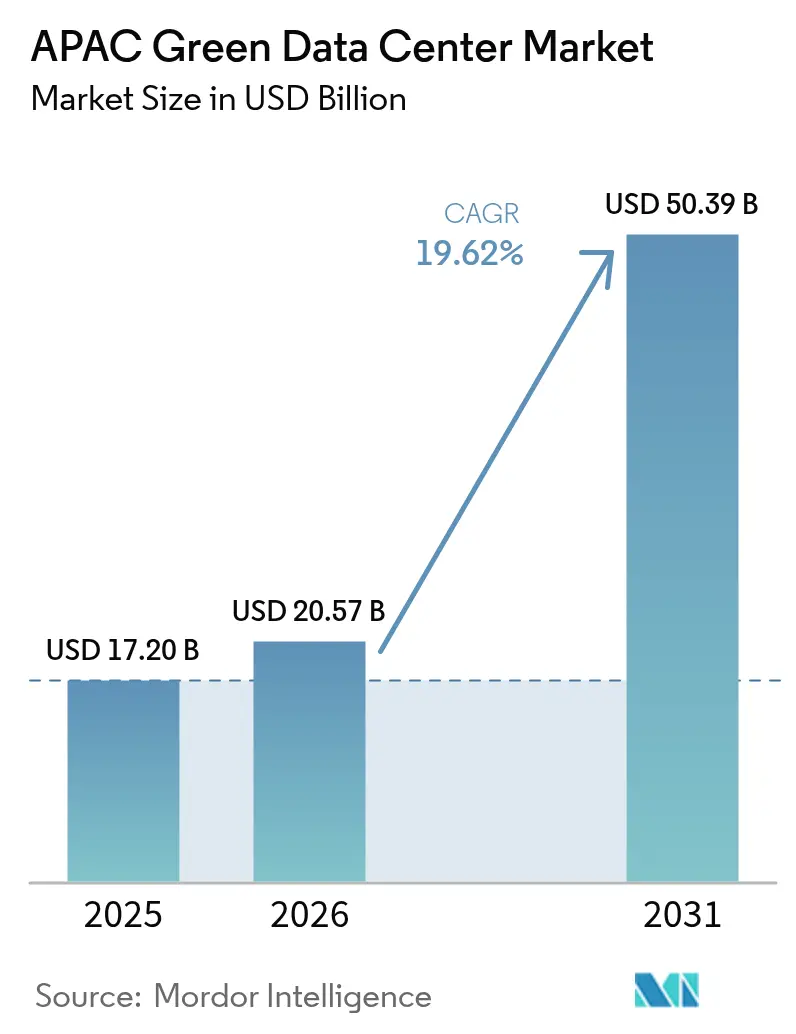
The Asia-Pacific green data center market size is expected to grow from USD 17.2 billion in 2025 to USD 20.57 billion in 2026 and is forecast to reach USD 50.39 billion by 2031 at 19.62% CAGR over 2026-2031. Rising hyperscale deployments, strict net-zero policies, and rapid cloud adoption are steering capital toward energy-efficient facilities across China, India, Japan, and Southeast Asia. Liquid and hybrid cooling platforms, wider corporate power-purchase agreements, and lower weighted-average cost of capital from green financing are accelerating project pipelines. Companies are also re-engineering power architectures to support racks that now exceed 100 kW, while governments push location decisions toward secondary cities with abundant renewable energy. Competitive intensity is mounting as colocation specialists, cloud hyperscalers, and infrastructure real-estate investment trusts compete for scarce land, grid access, and skilled labor.
Key Report Takeaways
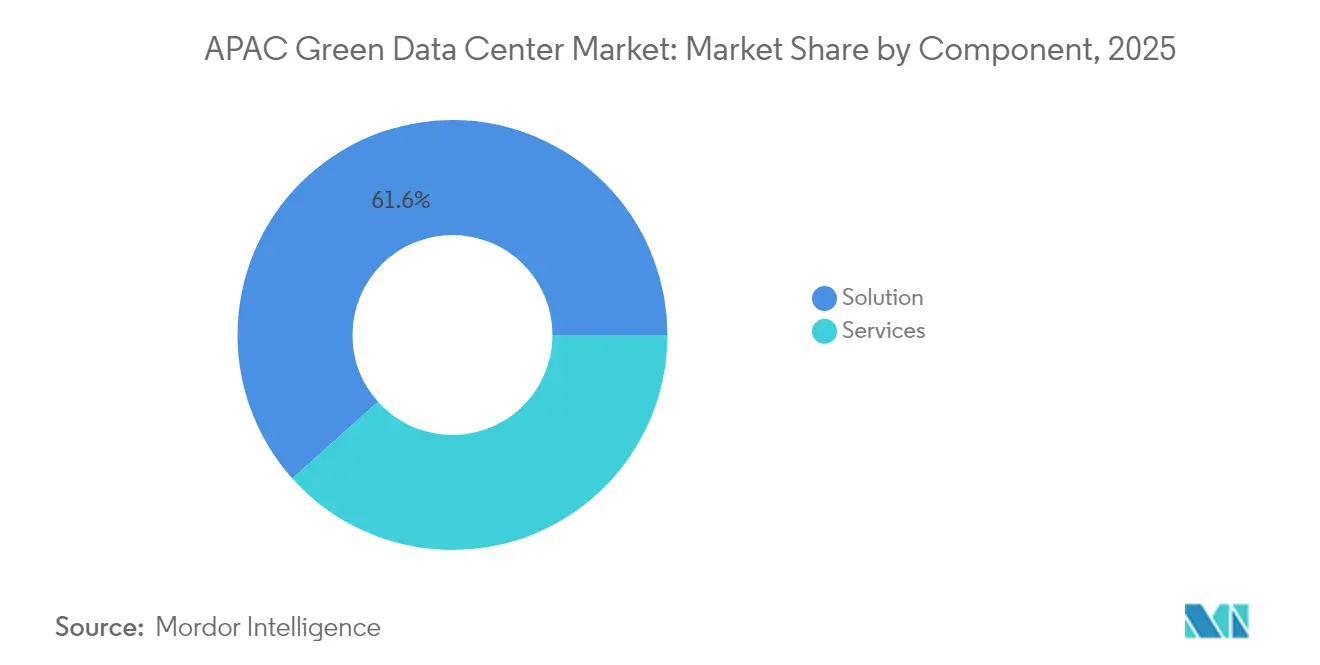
- By component, Solutions led with 61.62% of the Asia-Pacific green data center market share in 2025, while Services is projected to expand at a 21.3% CAGR through 2031.
- By data center type, Colocation providers accounted for 35.62% revenue share of the Asia-Pacific green data center market in 2025; Hyperscalers/Cloud Service Providers are forecast to post the fastest 23.6% CAGR to 2031.
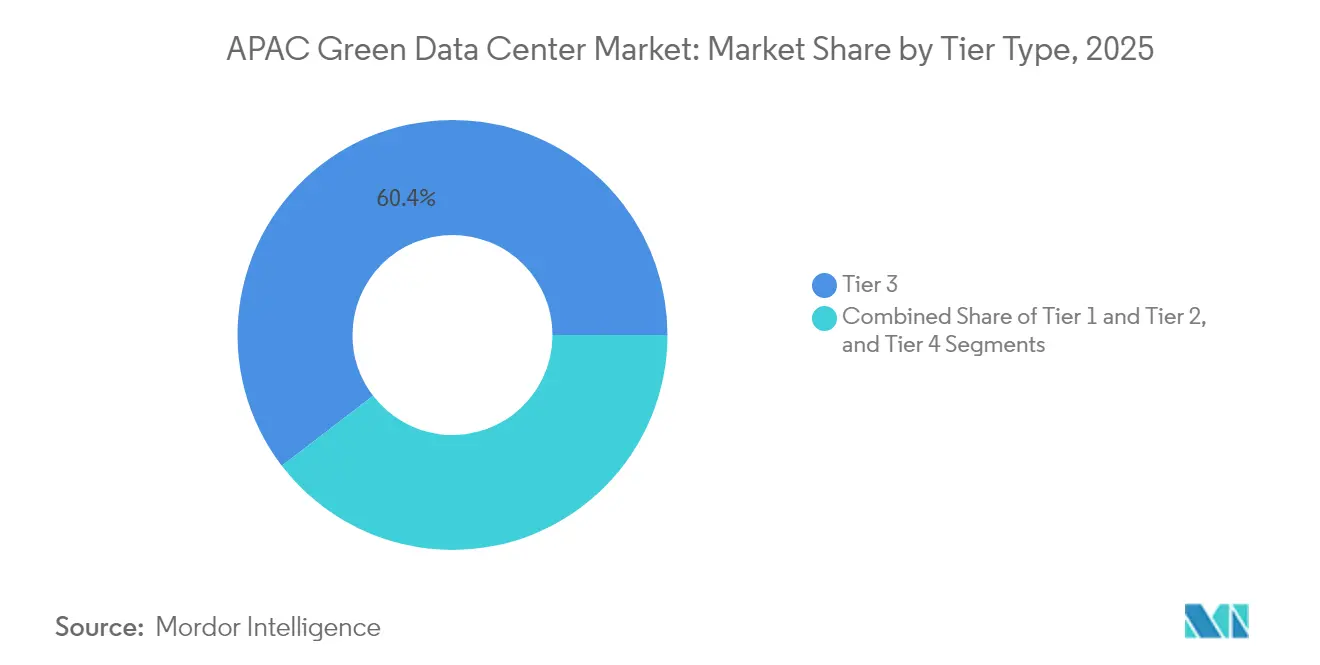
- By tier classification, Tier 3 facilities commanded a 60.40% share of the Asia-Pacific green data center market size in 2025, whereas Tier 4 sites are advancing at a 22.9% CAGR between 2026-2031.
- By vertical, Telecom and IT held 27.78% share of the Asia-Pacific green data center market in 2025; Government is registering the highest 24.2% CAGR through 2031
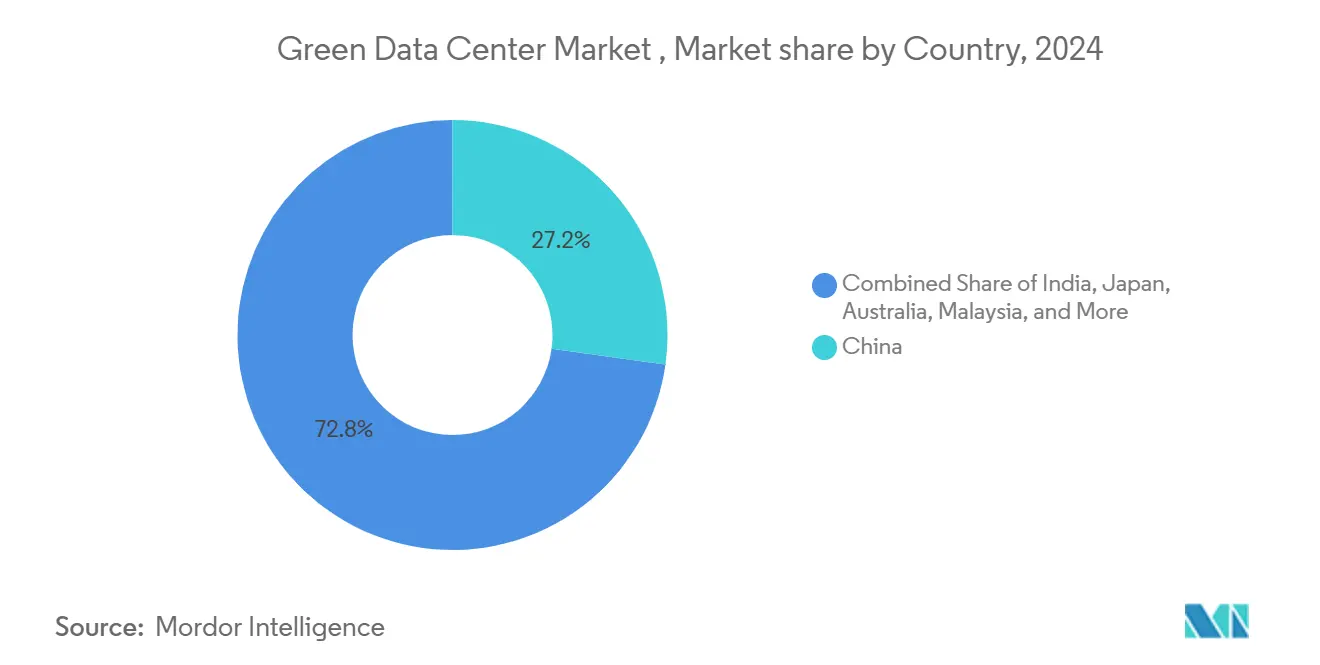
- By country, China captured 26.85% of the Asia-Pacific green data center market share in 2025, and India is growing fastest at a 22.6% CAGR to 2031.
Note: Market size and forecast figures in this report are generated using Mordor Intelligence’s proprietary estimation framework, updated with the latest available data and insights as of 2026.
600+
data center reports by Mordor Intelligence
covering power, AI facilities, cooling and more - global, regional or country-level, right down to individual data center components
APAC Green Data Center Market Trends and Insights
Drivers Impact Analysis*
| Driver | (~) % Impact on CAGR Forecast | Geographic Relevance | Impact Timeline |
|---|---|---|---|
| AI-driven high-density workloads require liquid and hybrid cooling | +4.2% | China, Japan, South Korea | Medium term (2-4 years) |
| Rapid hyperscale and colocation build-outs across emerging Southeast Asia metros | +3.8% | Southeast Asia core, India spill-over | Short term (≤ 2 years) |
| Government net-zero mandates and green-tax incentives | +3.1% | China, Japan, Singapore, Australia | Long term (≥ 4 years) |
| Grid decarbonization and corporate PPAs accelerating renewable sourcing | +2.9% | Australia, Japan, broader APAC | Medium term (2-4 years) |
| Small modular reactor pilots for zero-carbon baseload | +1.8% | Japan, South Korea, Australia | Long term (≥ 4 years) |
| REIT-style green financing lowering WACC for developers | +2.1% | Singapore, Hong Kong, Japan, Australia | Short term (≤ 2 years) |
| Source: Mordor Intelligence | |||
AI-Driven High-Density Workloads Require Liquid and Hybrid Cooling
Rack densities have ballooned from 10 kW to beyond 100 kW for GPU-rich servers, prompting a shift toward direct, immersion, and precision liquid cooling systems. Operators such as SK Telecom are partnering with hardware manufacturers to commercialize next-generation thermal solutions that can trim energy use by up to 30% compared with air cooling. Equinix is rolling out liquid cooling in more than 100 facilities, including Singapore, to maintain performance for AI services while curbing water usage. Early adopters gain a cost advantage because higher rack density reduces floor space requirements and accelerates revenue per square foot.
Rapid Hyperscale and Colocation Build-Outs Across Emerging Southeast Asia Metros
Thailand has earmarked USD 2.7 billion for three hyperscale campuses, while Indonesia is receiving USD 100 million from Digital Realty for a Jakarta expansion. Malaysia has attracted a USD 2 billion pledge from Google that includes on-site water-treatment plants. New sites in these markets shorten deployment timelines for hyperscalers facing power and land caps in Singapore and Tokyo, though they strain regional supply chains for switchgear, transformers, and specialist contractors.
Government Net-Zero Mandates and Green-Tax Incentives
China now requires 80% renewable electricity for new data centers by 2030, reshaping siting and energy-procurement strategies.[1]National Energy Administration, “Guiding Opinions on Accelerating Green and Low-Carbon Development of Data Centers,” nea.gov.cn Singapore’s Green Data Centre Technology Roadmap sets higher operating-temperature envelopes, which can shave cooling costs by up to 5% while mandating air-handling system upgrades.[2]National Climate Change Secretariat, “Singapore Green Data Centre Technology Roadmap,” nccs.gov.sg Japan’s inclusion of data centers in REIT structures lowers financing costs and channels institutional capital toward sustainable assets. Compliance differentiates operators that invest early in efficiency upgrades.
Grid Decarbonization and Corporate PPAs Accelerating Renewable Sourcing
Long-term power-purchase agreements are becoming the main pathway to secure zero-carbon electricity. Equinix signed its first Japanese solar PPA for 30 MW with Trina Solar. Malaysia will see data center demand surge by 68 TWh by 2030, making bundled solar and wind projects critical for grid resilience. Integrated off-site renewable generation gives operators cost predictability and supports national decarbonization targets.
Restraints Impact Analysis*
| Restraint | (~) % Impact on CAGR Forecast | Geographic Relevance | Impact Timeline |
|---|---|---|---|
| Land and power moratoriums in mature hubs | −2.8% | Singapore, Tokyo, other dense cities | Short term (≤ 2 years) |
| High capex premium for Tier III+ sustainable builds | −2.1% | Developed markets | Medium term (2-4 years) |
| Skilled-labour shortage for advanced cooling and DCIM | −1.9% | Region-wide, acute in emerging hubs | Medium term (2-4 years) |
| Water-stress regulations limiting evaporative cooling | −1.4% | Singapore, Japan | Long term (≥ 4 years) |
| Source: Mordor Intelligence | |||
Land and Power Moratoriums in Mature Hubs
Singapore lifted its four-year moratorium in 2024 but released only 80 MW of new capacity, pushing developers to meet strict efficiency and AI-readiness rules. Tokyo faces similar challenges as grid upgrades lag demand, forcing projects to relocate to Chiba or Hokkaido. Limited permits inflate land prices and slow project starts, redirecting capital toward Kuala Lumpur, Jakarta, and Bangkok.
Skilled-Labour Shortage for Advanced Cooling and DCIM
Liquid cooling and real-time infrastructure-management software require specialized engineers who are scarce across Asia-Pacific. Thailand lists talent shortfall among its top data center challenges alongside power costs. Jakarta must double its technical workforce to support the capacity targeted for 2027. Firms that build in-house training pipelines or partner with vocational institutes secure an execution advantage, while others face schedule slips and rising labor premiums.
*Our forecasts treat driver/restraint impacts as directional, not additive. The impact forecasts reflect baseline growth, mix effects, and variable interactions.
Segment Analysis
By Component: Solutions Drive Integration Demand
Solutions captured 61.62% share of the Asia-Pacific green data center market in 2025 as enterprises favor integrated power, cooling, and automation stacks that can be deployed quickly for AI clusters. Power equipment remains the largest subsegment because facilities are re-wiring electrical backbones for higher density, while advanced cooling systems record double-digit growth as liquid technologies spread. Services are smaller today yet outpace all other categories with a 21.3% CAGR, fueled by demand for design-build engineering, renewable-energy integration, and certification consulting. The Asia-Pacific green data center market size for Services is projected to reach USD 20.63 billion by 2031, expanding alongside complex retrofits. Vendors able to bundle software-defined energy-management platforms with liquid cooling hardware position themselves as single-throat-to-choke partners for hyperscalers.
Enterprises also turn to professional services for carbon-accounting audits, green-bond structuring, and power-purchase agreement negotiations. Low-carbon materials, such as Amazon’s cement replacements that cut embodied carbon by 64% in Tokyo builds, underscore how component innovation dovetails with service advisory. Integration specialists who can orchestrate electrical, mechanical, and IT systems reduce commissioning risk, shortening revenue realization cycles for investors.



By Data Center Type: Hyperscalers Accelerate Investment
Colocation operators held a 35.62% share in 2025 and remain vital for enterprises seeking scalable capacity without upfront capital. Yet hyperscalers, propelled by AI model training and sovereign-cloud contracts, are registering a 23.6% CAGR, making them the primary growth locomotive. The Asia-Pacific green data center market size tied to hyperscalers is projected to more than triple by 2031. Competition for land bank parcels in Jakarta, Johor, and Batam is intensifying as companies like TikTok pledge USD 8.8 billion over five years for Thailand hosting.
Colocation firms respond by offering liquid-ready white space, direct-to-chip cooling corridors, and high-density power feeds exceeding 40 kW per rack. Hyperscalers, in turn, expand colocation usage for on-ramp regions where self-build timelines exceed demand. Edge deployments by telecom operators add another layer, requiring micro-sites near 5G base stations to support real-time analytics.
By Tier Type: Tier 4 Drives Premium Positioning
Tier 3 facilities supplied 60.40% of capacity in 2025 by balancing reliability and cost, yet Tier 4 sites are advancing fastest at a 22.9% CAGR as AI inference engines and financial-trading workloads raise uptime thresholds. New Tier 4 campuses, such as SoftBank’s 300 MW Hokkaido Tomakomai complex, include redundant power blocks, on-site battery farms, and liquid-cooling loops that keep PUE below 1.2. The Asia-Pacific green data center market size for Tier 4 facilities is on track to exceed USD 12.18 billion by 2031, highlighting heightened willingness to pay for resilience.
Tier 3 operators counter with predictive-maintenance analytics that push effective availability toward Tier 4 levels without full duplication of infrastructure. Tier 1 and Tier 2 remain relevant for test-and-dev or non-critical archiving, yet their share erodes as digital-first enterprises standardize on high availability.
By Industry Vertical: Government Leads Digital Transformation
Telecom and IT retained a 27.78% share in 2025, powered by 5G rollouts and platform-as-a-service expansion. Government workloads, however, post the fastest 24.2% CAGR to 2031 as national digital-identity programs and smart-city platforms demand sovereign hosting. The Asia-Pacific green data center industry is witnessing ministries migrate workloads to cloud regions that satisfy local data-residency laws while meeting energy-efficiency mandates.
Healthcare systems adopt edge nodes for telemedicine, while banks implement hybrid architectures that comply with data-localization rules yet enable elastic compute. Manufacturers integrate on-premise mini-data centers with public-cloud links to power industrial IoT and digital twin applications. Each vertical is seeking operators that can prove renewable-energy credentials and break-out latency below 5 milliseconds.
Geography Analysis
China held 26.85% of the Asia-Pacific green data center market in 2025, underpinned by policies requiring 80% green electricity for new sites by 2030 and municipal targets that push PUE below 1.35 in Beijing. GDS Services has already achieved 40% renewable sourcing with a PUE of 1.13, illustrating progress toward these goals. National renewable certificate trading provides an audit trail that helps operators win hyperscale contracts and tap green finance.
India is the fastest-growing geography with a 22.6% CAGR, supported by state incentives, competitive tariffs, and abundant engineering talent. Telangana’s partnership with NTT India and Neysa Networks on a 400 MW Hyderabad cluster demonstrates the government's willingness to expedite clearances for AI supercomputing estates. Equinix’s captive solar-wind plant in Maharashtra shows how corporate PPAs mitigate grid constraints while locking in price certainty.
Japan, Singapore, and Australia remain mature yet constrained. Tokyo’s power-grid saturation pushes new capacity to regions like Kyushu, where local governments offer tax breaks. Singapore’s post-moratorium rules cap new capacity at 80 MW increments with strict energy-efficiency conditions. Australia leverages abundant solar resources and transparent PPA markets to attract operators seeking clear renewable pathways.
Regulatory Landscape
Regulation across Asia-Pacific is tightening around measurable energy and water performance, increasingly tying build approvals and incentives to sustainability thresholds. In China, national guidance and standards embed renewable-sourcing and efficiency requirements into new builds, including the policy direction requiring a high renewable electricity share for new data centers by 2030, alongside stricter PUE controls in priority hubs. Water efficiency is also being formalized through water-to-energy and related green data center standards.
Singapore has moved from broad guidance to updated building and operational criteria through Green Mark for Data Centre 2024 (launched 18 October 2024 by BCA and IMDA) and the Green Data Centre Technology Roadmap. These updates align site selection and retrofits with higher operating-temperature envelopes and system upgrades. Within ASEAN, policy convergence has advanced via the ASEAN Guide for Sustainable Data Centre Development (finalized December 2025), giving developers a common baseline on energy, carbon, and water considerations across member markets. Malaysia has published sustainable data center guidelines that incorporate Water Usage Effectiveness targets and link to its investment incentives (with MIDA accepting applications under the DESAC scheme through 31 December 2027), while Australia has articulated whole-of-system expectations for data centre and AI infrastructure developers that prioritize clean energy adoption, energy efficiency, and coordination with transmission planning. Collectively, these frameworks shift compliance from voluntary ESG disclosures toward auditable metrics (PUE, WUE, renewable electricity verification), which can influence permitting, financing access, and customer procurement.
Value Chain Analysis
The green data center value chain in Asia-Pacific spans (1) site origination and permitting (land acquisition, grid interconnection, environmental and water approvals), (2) design and engineering (Tier III/IV architecture, high-density power distribution, thermal design, and efficiency modeling), (3) equipment and systems supply (switchgear, transformers, UPS and batteries, generators, chillers and liquid cooling loops, containment, DCIM and energy-management software), (4) construction and commissioning (EPC contractors, specialist MEP installers, testing and certification bodies), and (5) operations and go-to-market (colocation leasing, hyperscale self-build operations, managed services, carbon accounting, and renewable energy procurement and tracking). With GPU-rich, high-density racks becoming more common, cooling technology selection and power-train resiliency have moved upstream into early design. Operators increasingly require liquid-ready halls, advanced controls, and measured water stewardship to meet tenant scorecards.
Renewable power contracting has become a core enabling layer across the chain, with developers pairing new capacity with PPAs, onsite generation, or captive renewables to secure verifiable green electricity at scale. Market examples include large operator-to-renewable partnerships, such as CleanMax-backed renewable supply agreements for AI-oriented deployments in India, and developers prioritizing locations with clear grid decarbonization pathways. On the facilities side, projects highlighting reclaimed-water cooling and platinum-level green certification, such as ZDATA Groups Johor hyperscale site with GreenRE Platinum certification, place water treatment, reuse systems, and metering vendors alongside traditional MEP suppliers as critical contributors. Bottlenecks remain concentrated in utility-ready sites and long-lead electrical equipment, while execution capacity depends on specialist engineering talent for liquid cooling and DCIM. That dynamic increases the role of systems integrators and training partnerships in project delivery.
Competitive Landscape
The competitive field spans colocation giants, cloud hyperscalers, and real-estate investment trusts specialized in digital infrastructure. Market concentration tightens in regulated hubs with limited permits but remains looser in emerging Southeast Asian metros. Differentiation hinges on renewable-energy sourcing, cooling innovation, and access to low-cost green capital.
AWS cut embodied carbon by 64% in its Tokyo builds through low-carbon concrete, setting a benchmark for construction practices. Keppel DC REIT introduced a green-finance framework that aligns with global bond principles, reducing funding costs and attracting ESG-focused investors.[4]Keppel DC REIT, “Green Financing Framework,” keppeldcreit.com Operators that integrate on-site solar, advanced battery storage, or pilot small modular reactors strengthen long-term competitiveness.
Edge-computing growth offers white-space for newcomers able to deploy micro-facilities under PUE-light footprints. Meanwhile, incumbents aim to secure long-duration PPAs to hedge electricity volatility and satisfy tenant sustainability scorecards. Talent acquisition remains a differentiator as firms establish academies to certify technicians in immersion cooling and DCIM analytics.
APAC Green Data Center Industry Leaders
Equinix Inc.
Digital Realty Trust Inc.
NTT DATA Group Corp.
China Telecom Corp. Ltd.
Schneider Electric SE
- *Disclaimer: Major Players sorted in no particular order

Market Opportunities and Future Outlook
A primary whitespace for Asia-Pacific green data centers sits at the intersection of AI-ready capacity and enforceable efficiency standards, where buyers and regulators increasingly ask for auditable performance rather than broad sustainability claims. This is reinforced by new and updated frameworks, including Singapores Green Data Centre Technology Roadmap and Green Mark for Data Centre 2024, and by Chinas move toward workload-aware efficiency measurement through the GB/T 46662-2025 standard for dynamic energy efficiency of IT systems (implemented in 2026). These shifts create room for solution providers that bring together high-density power architecture, liquid or hybrid cooling, and software-led optimization (DCIM, energy management, and carbon accounting) into deployable reference designs for colocation, hyperscale, and government workloads.
Geographic opportunity is also more visible in Southeast Asia and secondary metros that offer clearer power and land pathways than mature hubs with capacity caps, supported by large announced and underway projects. Digital Edges January 2026 announcement of a USD 4.5 billion, 500 MW AI-ready hyperscale campus in Bekasi, Indonesia, and Equinixs Malaysia buildout (including the KL2 data center investment) show how developers are using new campuses to capture spillover demand from constrained markets while aligning with renewable energy coverage goals. Industry coordination is deepening through voluntary baselines, including the APDCA-led Sustainable Digital Infrastructure Accord launched in 2026 by major operators such as AirTrunk, Digital Realty, and Equinix, which provides a practical entry point for harmonized reporting and procurement requirements across APAC. Additional whitespace is opening for water-efficient cooling and reclaimed-water systems in water-stressed jurisdictions as WUE targets are formalized, along with green-finance and REIT-linked structures in markets that channel institutional capital toward verifiably sustainable digital infrastructure.
Recent Industry Developments
- July 2026: Equinix broke ground on its SG6 data center in Singapore, adding a 20 MW project under the Singapore Data Center Call for Application scheme. The development ties new capacity to stricter sustainability gating, raising the bar for efficiency-led design and renewable sourcing in one of APAC's most supply-constrained hubs.
- May 2026: Equinix announced an investment of USD 190 million for its KL2 data center in Cyberjaya, Malaysia, targeting 100% renewable energy coverage. The project underscores Malaysias role as a spillover destination for regional demand while embedding renewable procurement as a core differentiator for new builds.
- November 2024: Equinix announced plans to build a high-performance, sustainable data center in Singapore to support AI-oriented workloads. The move highlighted early market alignment around AI density and greener power and cooling approaches ahead of the post-moratorium reopening of capacity allocations.


Research Methodology Framework and Report Scope
Market Definition and Coverage
For this study, the market covers revenue generated in Asia-Pacific from building and upgrading data center sites that are designed to reduce energy and water use, improve power and cooling efficiency, and increase the verified use of renewable electricity.
Scope exclusions: We exclude minor efficiency tweaks in existing halls and very early project announcements that do not yet have a permitted site or confirmed grid path.
Segmentation Overview
- By Component
- Service
- System Integration
- Monitoring Services
- Professional Services
- Other Services
- Solution
- Power
- Cooling
- Servers
- Networking Equipment
- Management Software
- Other Solutions
- Service
- By Data Center Type
- Colocation Providers
- Hyperscalers/Cloud Service Providers
- Enterprise and Edge
- By Tier Type
- Tier 1 and 2
- Tier 3
- Tier 4
- By Industry Vertical
- Healthcare
- Financial Services
- Government
- Telecom and IT
- Manufacturing
- Media and Entertainment
- Other Verticals
- By Country
- China
- India
- Japan
- Malaysia
- Australia
- Indonesia
- Thailand
- Singapore
- South Korea
- Rest of Asia-Pacific
Data Sources, Market Sizing, and Validation
Desk Research
Desk research was used to map the demand backdrop and the practical definition of what qualifies as a green build in each major APAC hub. We leaned on public energy and emissions references (such as IEA power generation mixes, UNFCCC country climate reporting, and national energy agencies), plus policy and standards sources like data center efficiency guidance and renewable energy procurement rules published by regulators.
To keep inputs grounded, we also reviewed sources such as ITU and World Bank digital infrastructure indicators, regional grid reliability and electricity price disclosures, and reputable press coverage on new campus approvals and power constraints. Company filings and investor presentations helped us cross-check timelines, capacity additions, and capex intensity, and paid subscription sources for company financials and for patent and technology tracking were used selectively to validate supplier exposure and efficiency innovation themes. The sources listed here are illustrative only, and many other public references were reviewed for data collection, cross-checking, and clarification.
Primary Interviews and Surveys
Primary work focused on data center developers and operators, critical infrastructure suppliers, and large enterprise and cloud buyers across key APAC countries, so assumptions could be tested against on-the-ground build plans and procurement behavior. Interviews helped us validate what is actually being counted as green in contracts (for example, renewable power coverage, efficiency targets, and monitoring requirements) and then reconcile differences across countries where grid mixes and certification practices vary.
Distribution of primary research fieldwork respondents
| Company type | Respondent position |
|---|---|
| Top tier: 38% | CXOs: 13% |
| Mid tier: 47% | Functional/Unit leaders: 41% |
| Smaller Players: 15% | Managers: 46% |
Market-Sizing & Forecasting
Market sizing was built using a top-down demand reconstruction, where our starting point was the APAC data center build pipeline and operating capacity signals, which were then filtered by green qualification rules (efficiency design, cooling approach, and verified renewable electricity coverage). Results were corroborated with selective bottom-up checks, mainly by sampling typical build costs and service spend per MW, and then stress-testing totals using supplier and channel feedback.
Inputs that mattered most included new capacity additions (MW), average utilization and commissioning lags, the share of projects meeting PUE and monitoring targets, renewable electricity procurement mix (on-site, PPAs, or certificates), and local electricity pricing and carbon policy pressure that shifts buyer behavior. Where country-level data was incomplete, gaps were handled by using proxy indicators like known campus announcements, grid connection timelines, and construction cycle averages that were validated in calls.
For forecasting, scenario analysis was used, because the market is highly sensitive to power availability, permitting speed, and renewable supply expansion. The base case was anchored on expected commissioning schedules and policy continuity, and then adjusted using expert views on delays, pricing pressure, and the pace at which buyers tighten sustainability requirements.
Data Validation & Update Cycle
Validation was done through multiple checks so the final number stays consistent with real-world build activity. Model outputs were compared against independent signals such as reported capacity additions, power procurement activity, and construction starts, and then any outliers were investigated before sign-off.
We also run variance checks across countries so fast-growth hubs do not get overstated due to duplicated project news or misread timelines. If primary inputs shift meaningfully (for example, a major grid constraint, regulatory change, or large project delay), analysts re-contact sources to re-test assumptions. Reports are refreshed annually, with interim updates when material events occur, and a final pre-delivery review is completed to reflect the latest available information.
Mordor Intelligence's Asia Pacific Green Data Center Market Market Estimate Compared With Other Published Estimates
Different published market values for green data centers in Asia-Pacific can vary a lot, even when they talk about the same theme. The gaps usually come from what is counted as green, whether the sizing is based on investment versus annual revenue, and how project timing is treated when builds are announced but not commissioned.
In our checks, the biggest drivers were whether retrofits are fully included, how renewable electricity is defined (commitments versus verified supply), and whether forecasts assume aggressive commissioning with limited grid delays. Some sources also use earlier base years and then apply a single growth rate forward, which can miss country-level differences in permitting and power availability that show up quickly in APAC.
Benchmark comparison
| Source | Market Size | Gaps in Research Methodology |
|---|---|---|
| Mordor Intelligence | USD 17.20 B (2025) | |
| Industry Databook A | USD 14.19 B (2024) | Uses a 2024 base and a shorter forecast window, and its revenue scope appears to include broader solution and service activity without clearly separating verified renewable electricity coverage by site. |
| Market Research Publisher B | USD 9.68 B (2023) | Frames the market as investment-based sizing with a 2023 base year, which can understate annual revenue when commissioning accelerates, and it applies a different green threshold such as PUE screening without consistently tying it to verified renewable supply. |
The spread in the table mostly reflects base-year choice and what qualifies as green at the project level, especially around renewable electricity verification and the treatment of light retrofits, which is why the 2025 value stays higher when those filters are applied consistently near the end of the build-to-revenue logic by Mordor Intelligence.


Key Questions Answered in the Report
What is the current size of the Asia-Pacific green data center market?
The market Size at USD 20.57 billion in 2026.
How fast will the Asia-Pacific green data center market grow by 2031?
It is projected to expand at a 19.62% CAGR, reaching USD 50.39 billion by 2031.
Which component segment is expanding most rapidly?
The Services segment is advancing at a 21.3% CAGR through 2031, reflecting rising demand for design-build and sustainability consulting.
Which country is expected to post the fastest growth rate?
India is forecast to lead with a 22.6% CAGR through 2031 on the back of policy incentives and expanding cloud demand.
What proportion of capacity do Tier 3 facilities currently hold?
Tier 3 sites account for 60.40% of the Asia-Pacific green data center market in 2025.
Why are liquid cooling systems gaining traction in the region?
They support AI rack densities above 100 kW while lowering energy use by up to 30%, helping operators meet efficiency and sustainability targets.
Page last updated on:
More reports on data centers
- Data Center Power Market Power systems across the global market, covering component, tier and facility size.
- Artificial Intelligence (AI) Data Center Market AI facilities across all regions, split by facility type, component and tier.
- Data Center Cooling Market Global cooling demand, split by cooling technology, cooling component and facility type.
- Asia Pacific Data Center Processor Market Processors in Asia-Pacific, split by facility size and tier.
- Singapore Data Center Storage Market Singapore storage, split by storage technology, storage type and facility type.
- Asia-Pacific Data Center Power Market Asia-Pacific's power systems, split by component, facility type and facility size.
- South America Data Center Power Market Power systems in South America, split by power infrastructure, end user and power capacity range.
- Micro Mobile Data Center Market Global micro mobile units demand, split by rack unit size, form factor and application.
- Asia Pacific Hyperscale Data Center Market Hyperscale sites in Asia-Pacific, split by data centre type, component and tier.
- United Arab Emirates Data Center Power Market The UAE power systems, split by component, facility type and facility size.
- Data Center RFID Market Global asset tracking demand, split by component, tag type and data-center type.
- Saudi Arabia Data Center Power Market Power systems demand across Saudi Arabia, covering component, facility type and facility size.





