
Market Overview
| Study Period | 2021 - 2031 |
|---|---|
| Forecast Data Period | 2026 - 2031 |
| Base Year Market Size (2025) | USD 107.37 Billion |
| Market Size (2026) | USD 116.19 Billion |
| Market Size (2031) | USD 172.49 Billion |
| Growth Rate (2026 - 2031) | 8.22 % |
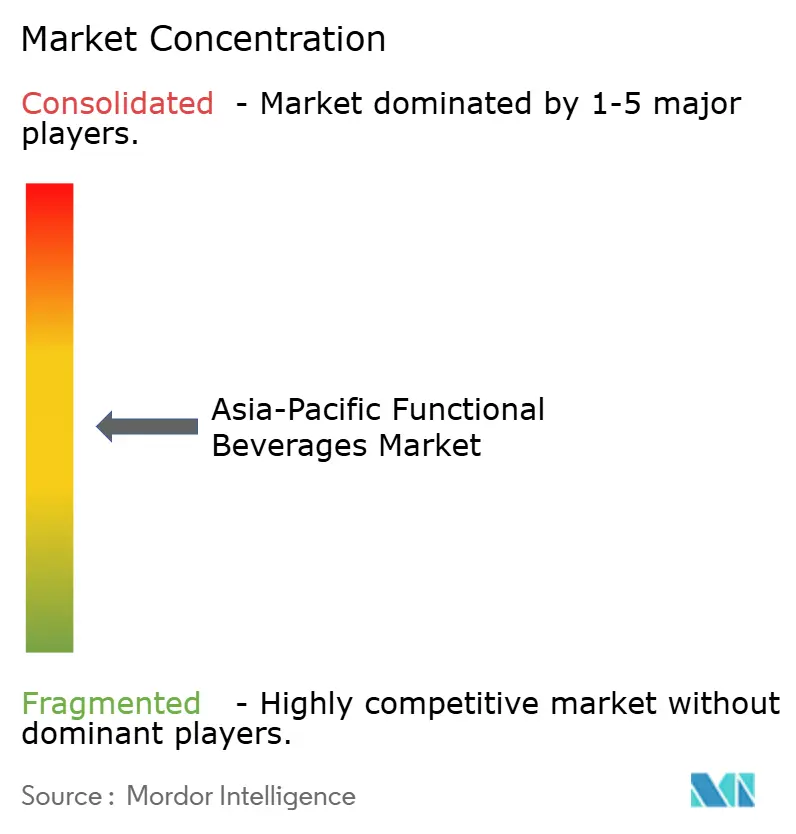
| Market Concentration | Medium |
Major Players
*Disclaimer: Major Players sorted in no particular order Image © Mordor Intelligence. Reuse requires attribution under CC BY 4.0. |
|
Asia-Pacific Functional Beverages Market Analysis by Mordor Intelligence
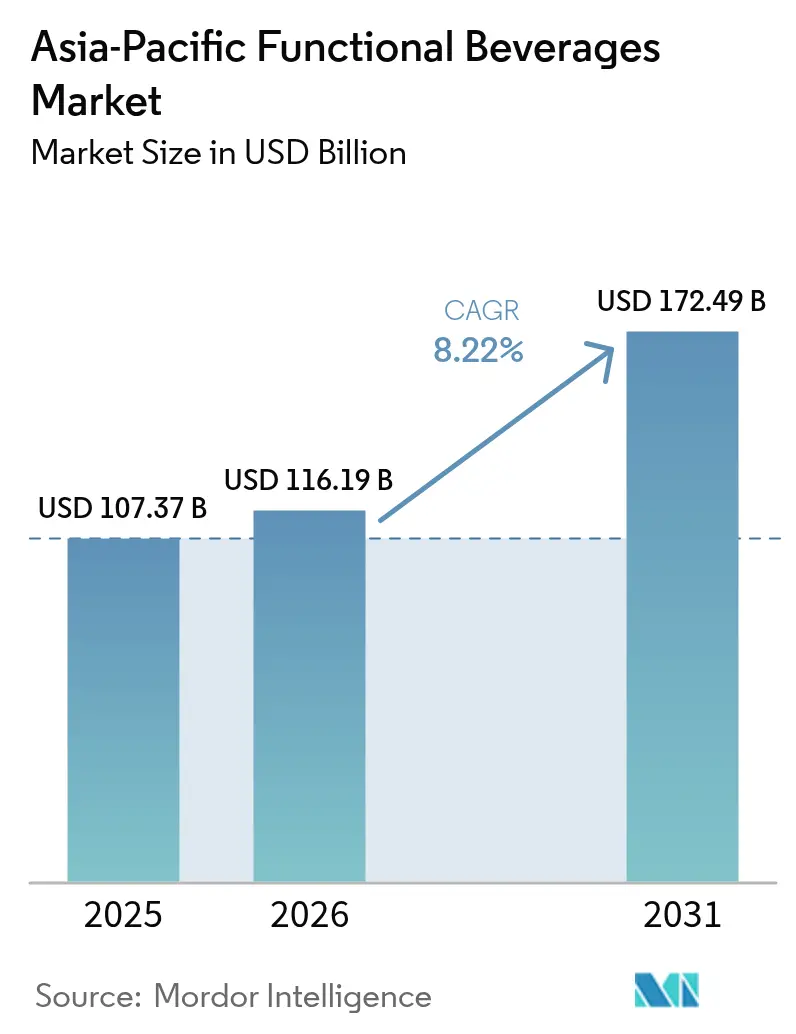
The Asia-Pacific functional beverages market size was valued at USD 107.37 billion in 2025 and estimated to grow from USD 116.19 billion in 2026 to reach USD 172.49 billion by 2031, at a CAGR of 8.22% during the forecast period (2026-2031). Rising health consciousness, supportive e-commerce ecosystems, and regulatory moves that favor low-sugar formulations are shaping demand patterns across the functional beverages market. Manufacturers are investing in value-added ingredients such as probiotics, nootropics, and adaptogens to justify premium prices while complying with evolving food-label rules. Product innovation is accelerating as domestic and multinational brands pivot from calorie-dense drinks toward clean-label options that deliver tangible wellness benefits. At the same time, sugar taxes in key ASEAN economies have nudged consumers toward reformulated alternatives, indirectly reinforcing category growth through healthier repositioning.
Key Report Takeaways
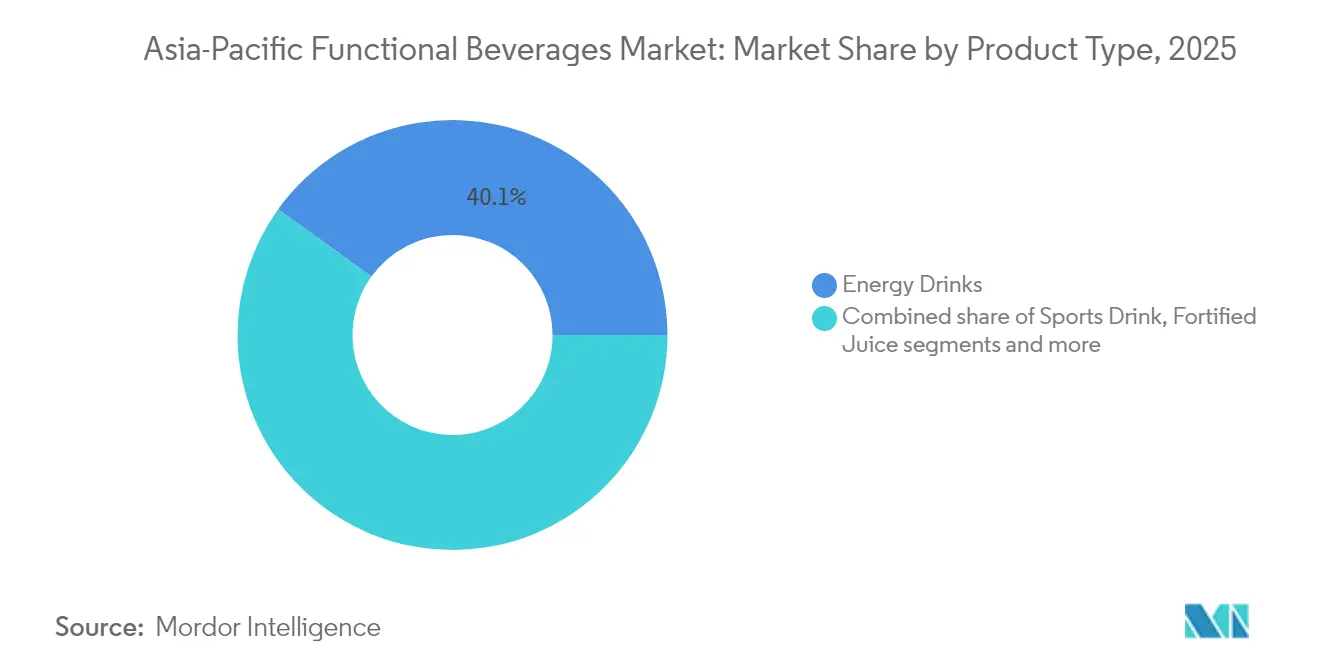
- By product type, energy drinks led with 40.05% revenue share of the Asia-Pacific functional beverages market in 2025, while functional/fortified water recorded the highest projected CAGR at 6.92% through 2031.
- By packaging, PET/glass bottles accounted for 54.78% share of the Asia-Pacific functional beverages market in 2025; aluminum cans are forecast to advance at a 7.22% CAGR to 2031.
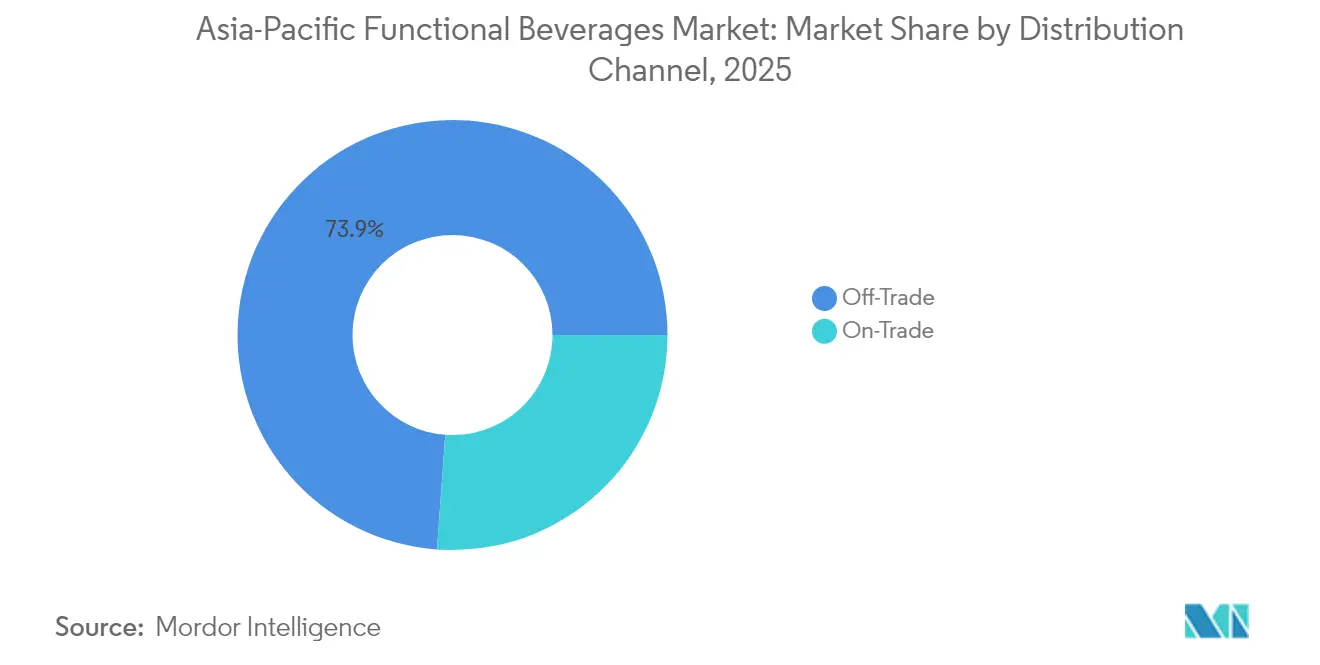
- By distribution channel, off-trade outlets captured 73.85% of the Asia-Pacific functional beverages market in 2025, whereas on-trade venues are expected to post an 7.95% CAGR through 2031.
- By geography, China commanded 66.55% of the Asia-Pacific functional beverages market share in 2025, and India is projected to expand at a 7.58% CAGR to 2031.
Note: Market size and forecast figures in this report are generated using Mordor Intelligence’s proprietary estimation framework, updated with the latest available data and insights as of 2026.
Market Trends and Insights
Drivers Impact Analysis of Asia-Pacific Functional Beverages Market*
| Driver | (~) % Impact on CAGR Forecast | Geographic Relevance | Impact Timeline |
|---|---|---|---|
| Rising health and wellness awareness | +2.1% | Global, with strongest impact in China, Japan, Singapore | Long term (≥ 4 years) |
| Growing fitness culture drives consumption of functional drink | +1.8% | Asia-Pacific core markets, spillover to emerging economies | Medium term (2-4 years) |
| Sugar-tax driven reformulation toward low/no-sugar fortification | +1.2% | ASEAN countries, Australia, with regulatory influence spreading | Short term (≤ 2 years) |
| Aggressive brand sponsorships in sports and e-sports | +0.9% | China, South Korea, Japan, with expansion to Southeast Asia | Medium term (2-4 years) |
| Nootropic/probiotic functional shots for focus-seeking workforce | +0.7% | Urban centers across China, Japan, Singapore, South Korea | Long term (≥ 4 years) |
| Rising popularity of natural and clean-label ingredients | +0.6% | Premium markets: Japan, Australia, Singapore, urban China | Long term (≥ 4 years) |
| Source: Mordor Intelligence | |||
Rising health and wellness awareness
Consumer health and wellness awareness is transforming functional beverage consumption into a daily wellness practice. Consumers increasingly seek beverages that provide health benefits beyond basic nutrition, including mental wellness. This trend is evident in products like JIDAI's ASAP SYNERGY, a cognitive enhancement drink designed for Japan's workforce. Regulatory initiatives, such as Singapore's Nutri-Grade labeling system introduced in late 2024, support this shift by providing transparent nutritional information for informed consumer decisions. Moreover, product development incorporating traditional Asian herbs and natural ingredients meets the growing demand for clean-label solutions. The combination of urbanization and busy lifestyles increases the need for convenient, health-supporting beverages. Manufacturers are developing products that address both mental and physical wellness, appealing to various demographic groups from young professionals to older consumers. Companies that combine clear health benefits with transparent labeling and convenience are strengthening their market position. The focus on health and wellness continues to drive innovation and market expansion in the functional beverages industry, supporting sustained market growth.
Growing fitness culture drives consumption of functional drink
The functional beverage market is experiencing increased demand driven by fitness culture growth, particularly in urban areas where gym memberships and fitness app usage continue to increase. Australia recorded 7,313 health and fitness centers in 2024, according to the Australian Bureau of Statistics, indicating a growing consumer base engaged in structured fitness activities [1]Source: Australian Bureau of Statistics, "Counts of Australian Businesses, including Entries and Exits", abs.gov.au. This trend supports premiumization in the functional beverage segment, as consumers demonstrate willingness to spend more on products that offer performance enhancement, sustained energy, and faster recovery benefits aligned with their active lifestyles. The growth of digital fitness platforms and boutique studios strengthens this culture, creating an informed consumer base seeking scientifically formulated beverages to complement their fitness routines. This fitness landscape, characterized by technological integration and comprehensive health approaches, is developing across both developed markets like Australia and Japan, as well as emerging Asia-Pacific economies. Functional beverages formulated for endurance, energy replenishment, and muscle repair have become essential products for fitness enthusiasts. Manufacturers are responding by developing targeted formulations with proteins, electrolytes, and natural stimulants that appeal to performance-focused consumers. The relationship between fitness culture growth and functional beverage development is creating sustained market growth in the Asia-Pacific, establishing this segment as a key component of the wellness beverage category.
Sugar-tax–driven reformulation toward low/no-sugar fortification
Regulatory pressure from sugar taxation policies across ASEAN countries is driving innovation in low-sugar and sugar-free functional beverage formulations. These regulations create opportunities for manufacturers who can maintain taste while reducing sugar content. Indonesia plans to implement a sugar tax in July 2025, while Malaysia, Thailand, and the Philippines have similar initiatives in place [2]Source: Bangkok Global Law, "Implementation of Final Phase of Sugar-Based Excise Tax under Thai Excise Law", bgloballaw.com. These policies have prompted manufacturers to reformulate their products, often incorporating additional functional ingredients to compensate for reduced sweetness. The regulatory environment has accelerated technological developments in natural sweeteners and flavor enhancers. For example, CNERGY's zero-sugar energy drink launch in India demonstrates successful sugar reduction while maintaining consumer appeal. While sugar tax policies initially focus on compliance, they ultimately improve the nutritional value of functional beverages and increase consumer acceptance of reduced-sugar alternatives. These regulations also include food labeling requirements that enhance transparency and help consumers make informed health choices. The combination of taxation and labeling regulations increases awareness and demand for functional beverages with improved health benefits. This regulatory framework requires companies in the Asia-Pacific region to innovate quickly and adapt their formulations. As a result, the sugar tax-driven reformulation catalyst for both immediate product changes and long-term consumer transition toward healthier functional beverages in the region.
Nootropic/probiotic functional shots for focus-seeking workforce
Market analysis indicates significant growth in nootropic and probiotic functional shots targeting working professionals, combining mental performance enhancement with physical health benefits. In Japan, JIDAI introduced ASAP SYNERGY in July 2025, offering a sugar-free and caffeine-free nootropic shot format for professionals seeking cognitive enhancement. In Singapore, Kombucha Works developed a Lion's Mane mushroom kombucha product that provides natural cognitive benefits. These products have expanded distribution through corporate wellness programs and office vending machines, extending beyond traditional retail channels. While nootropic ingredients require scientific validation for consumer acceptance, the market potential is substantial, with the World Bank reporting a 2024 labor force of over 773 million in China and 607.7 million in India [3]Source: World Bank, "Labor force, total - East Asia & Pacific", data.worldbank.org. This market development has encouraged premiumization and product diversification in the functional beverage segment. Companies focusing on convenient formats, evidence-based ingredients, and workplace wellness solutions are positioned to benefit from this market segment. The trend reflects the shift from purely physical performance products to comprehensive mental and physical wellness solutions in the Asia-Pacific functional beverage market.
Restraints Impact Analysis of Asia-Pacific Functional Beverages Market*
| Restraint | (~) % Impact on CAGR Forecast | Geographic Relevance | Impact Timeline |
|---|---|---|---|
| Caffeine and sugar health concerns | -1.4% | Global, with heightened scrutiny in developed Asia-Pacific markets | Short term (≤ 2 years) |
| High cost of ingredients and innovation | -0.8% | Manufacturing-intensive markets: China, Thailand, Indonesia | Medium term (2-4 years) |
| Stringent government regulations | -0.6% | ASEAN countries, Australia, Japan with expanding compliance requirements | Short term (≤ 2 years) |
| Counterfeit/grey-market imports eroding brand equity | -0.4% | China, India, Southeast Asia with porous border controls | Long term (≥ 4 years) |
| Source: Mordor Intelligence | |||
Caffeine and sugar health concerns
Rising health consciousness, coupled with ongoing medical research highlighting the risks of excessive caffeine and sugar consumption, is driving consumer skepticism toward high-caffeine and high-sugar functional beverages. Singapore's Nutri-Grade labeling system, set to launch in December 2024, exemplifies regulatory measures aimed at mandating clear nutritional disclosures on beverages. This initiative enables consumers to make informed decisions regarding their sugar and caffeine intake. Developed markets in the Asia-Pacific region are at the forefront of this trend, where higher levels of consumer education and health awareness are pressuring manufacturers to reformulate products with reduced caffeine and sugar content. In response, companies are innovating with natural energy sources and alternative sweetening systems to meet health-conscious demands while maintaining product appeal. However, this shift is reducing the attractiveness of traditional high-stimulant functional beverages that previously drove category growth. Rapid changes in consumer behavior, fueled by health information dissemination, are compelling the industry to adapt formulations quickly to sustain market momentum. This regulatory and consumer-driven dynamic is fostering a healthier product landscape, aligning with broader wellness trends. The Nutri-Grade system’s transparent labeling serves as both a guide for consumers and a catalyst for industry evolution, ensuring that health concerns surrounding caffeine and sugar remain central to product development strategies.
High cost of ingredients and innovation
Premium pricing of functional ingredients and hefty research and development investments for product innovation exert significant cost pressures in the Asia-Pacific functional beverage market. These pressures not only limit market accessibility but also constrain opportunities for margin expansion. Countries like China, Thailand, and Indonesia, known for their manufacturing intensity, grapple with the challenge of balancing ingredient quality against price competitiveness. This struggle is evident in the intricate supply chain demands for natural preservatives, such as Sunson Biotechnology's cultured dextrose. Furthermore, navigating regulatory compliance across various jurisdictions adds another layer of complexity and cost. Each country's distinct approval processes for functional ingredients and health claims further inflate research and development expenditures. This medium-term challenge underscores the time required for ingredient costs to stabilize, thanks to supply chain optimizations and economies of scale. At the same time, investments in innovation need to be maintained until they yield tangible returns. Smaller manufacturers find themselves at a disadvantage, often lacking the capital for extensive research and development. This limitation not only hampers their growth but also accelerates market consolidation, favoring larger, well-financed entities. Industry giants like Nestlé are at the forefront, pouring resources into advanced ingredient delivery technologies, such as microencapsulation. This not only boosts bioavailability and meets stringent quality benchmarks but also escalates costs. The intricate dance of ongoing investments and supply chain sophistication highlights both the challenges and opportunities in the region's functional beverage segment, where robust demand for high-quality, efficacious products persists amidst mounting cost pressures.
*Our forecasts treat driver/restraint impacts as directional, not additive. The impact forecasts reflect baseline growth, mix effects, and variable interactions.
Asia-Pacific Functional Beverages Market Segment Analysis
By Product Type:
Energy Drinks Lead Despite Wellness ShiftIn 2025, energy drinks hold a dominant 40.05% market share. However, functional/fortified waters are emerging as the fastest-growing segment, with a robust 6.92% CAGR projected through 2031. This growth reflects a market shift toward wellness-oriented products. Consumer preferences are becoming more segmented: high-stimulant energy drinks address performance-driven needs, while functional waters cater to daily hydration, enhanced with vitamins, minerals, and nootropic ingredients. Sports drinks maintain a stable position, benefiting from the expanding fitness culture but facing competition from specialized performance beverages offering targeted benefits. Fortified juices are experiencing moderate growth as consumers seek familiar formats enriched with functional ingredients. Additionally, dairy and dairy alternative beverages are gaining momentum, driven by protein fortification and probiotic enhancements.
These evolving segment dynamics present strategic opportunities for hybrid formulations that combine energy delivery with wellness attributes. For instance, JIDAI's ASAP SYNERGY cognitive drink, launched in Japan in July 2025, exemplifies this trend. Other emerging categories, such as functional teas and plant-based protein drinks, are contributing to market diversification and creating premium positioning opportunities. The regulatory environment varies across product types: energy drinks face stringent caffeine content regulations, while functional waters benefit from more flexible guidelines, fostering innovation in ingredient combinations and health claims.



By Packaging Type:
Sustainability Drives Can GrowthIn 2025, PET/glass bottles hold a 54.78% market share, leveraging consumer familiarity and enhanced product visibility. These attributes strengthen their premium positioning and brand differentiation strategies. Meanwhile, cans are witnessing robust growth, with a 7.22% CAGR projected through 2031. This growth is driven by sustainability initiatives and improved recyclability metrics, which resonate with environmentally conscious consumers in key Asia-Pacific markets. Suntory exemplified this trend in October 2024 by introducing bio-paraxylene PET bottles made from used cooking oil, effectively combining sustainability with functional beverage offerings. Tetra Pak continues to maintain a specialized role in shelf-stable functional beverages, particularly in regions where cold-chain distribution remains a challenge.
Convenience store expansion significantly influences packaging trends. With 7-Eleven and Lawson planning 10,000 new outlets across the Asia-Pacific by 2026, demand is rising for packaging formats optimized for grab-and-go consumption. Emerging packaging solutions, such as pouches and innovative bottle designs, offer opportunities for differentiation and cost optimization. Regulatory compliance varies across packaging types, with aluminum cans benefiting from established recycling infrastructure, while plastic bottles face increasing scrutiny under extended producer responsibility frameworks being implemented across the region.
By Distribution Channel:
On-Trade Recovery AcceleratesOff-trade channels dominate with a 73.85% market share in 2025, reflecting the critical role of retail accessibility and the growing consumer preference for home consumption of functional beverages. On-trade channels, however, are expanding at a CAGR of 7.95% through 2031, indicating a strong recovery in foodservice establishments and emphasizing the strategic importance of experiential consumption venues for brand building and trial generation. This evolution in distribution channels aligns with the aggressive expansion strategies of convenience store operators, creating additional touchpoints for functional beverage discovery and impulse purchases. Supermarkets and hypermarkets remain the primary volume drivers, while pharmacies and health stores cater to specialized functional beverage categories, focusing on therapeutic benefits and professional recommendations.
Online retail stores represent the fastest-growing sub-segment within off-trade, driven by direct-to-consumer strategies that enable functional beverage brands to strengthen customer relationships and gather valuable consumption data. These channel dynamics are particularly pronounced in China, where advanced e-commerce infrastructure supports sophisticated marketing and distribution strategies, bypassing traditional retail limitations. Other distribution channels, such as corporate wellness programs and fitness center partnerships, offer targeted opportunities for functional beverage placement in high-relevance consumption contexts, fostering trial and repeat purchase behavior.
Geography Analysis
China Functional Beverages Market
China holds a commanding 66.55% share of the market in 2025, driven by its vast consumer base and advanced e-commerce infrastructure. This dominance is further strengthened by the rapid adoption of functional beverage innovations across various demographics. Domestic brands, such as Genki Forest, have effectively scaled their functional water products through direct-to-consumer strategies and strategic retail partnerships, leveraging China's sophisticated digital payment systems. The regulatory environment continues to evolve, with changes in food safety standards and labeling requirements presenting both compliance challenges and opportunities for premium positioning through transparency and quality assurance messaging.
APAC Functional Beverages Market
India is the fastest-growing market, with a projected CAGR of 7.58% through 2031. This growth is attributed to rising disposable incomes, increasing urbanization, and a growing fitness culture that aligns with functional beverage adoption trends. The market benefits from heightened health consciousness among urban professionals and the expansion of organized retail infrastructure, which enhances accessibility in tier-1 and tier-2 cities. Japan remains a premium market, characterized by discerning consumer preferences and a willingness to pay higher prices for innovative functional formulations. Australia, a mature market, is supported by strong regulatory frameworks that foster functional beverage innovation while ensuring consumer protection through comprehensive labeling and health claim requirements.
ASEAN and South Korea Functional Beverages Market
Markets such as Thailand, Singapore, Indonesia, and South Korea are experiencing dynamic growth in functional beverage adoption. This growth is driven by the expansion of fitness culture, the proliferation of convenience stores, and increased exposure to international brands through tourism and digital media. Singapore’s implementation of the Nutri-Grade labeling system in December 2024 highlights the region’s regulatory shift toward greater transparency and consumer empowerment in product selection. The Rest of Asia-Pacific category includes emerging markets where functional beverage penetration remains low but offers significant growth potential. Economic development in these regions is driving disposable income growth and urbanization, creating demand for convenient, health-oriented beverage options that cater to increasingly busy lifestyles.
Regulatory Landscape
Across Asia-Pacific, functional beverages are subject to tightening controls on additives, nutrition labeling requirements, and health-claim substantiation rules that vary by country but are increasingly aligned through ASEAN. Singapore strengthened its gatekeeping for new functional ingredients with the Singapore Food Agency (SFA) publishing updated Requirements for the Safety Assessment of Novel Foods and Novel Food Ingredients on 17 March 2025, raising the bar for pre-market dossiers covering manufacturing process and safety evidence. At the same time, Singapore progressed its 2024 food-amendment changes for additive specifications, including updated definitions for steviol glycosides and revised permitted limits affecting select beverage applications.
At the regional level, ASEAN continues to harmonize elements that shape both formulation and pack claims. In April 2025, the Prepared Foodstuff Product Working Group (PFPWG) updated Annex I on ASEAN Maximum Use Levels of Food Additives, and in August 2025 ASEAN finalized and endorsed the ASEAN Guidelines on Nutrition Labelling, with clearer conditions for nutrient declarations when nutrition or health claims are made and guidance relevant to front-of-pack approaches. Outside ASEAN, claim frameworks remain central for market access and positioning, including Food Standards Australia New Zealand (FSANZ) requirements for evidence-based nutrition and health claims (Standard 1.2.7) and national health-functional food regimes such as South Korea's Health Functional Food Act and Taiwan's Health Food Governing Act, which influence ingredient permissions and the scope of allowable functional messaging.
Competitive Landscape
Established players and emerging disruptors alike find ample opportunities to gain market share in the moderately fragmented Asia-Pacific functional beverages market, primarily through innovation and strategic positioning. Market leaders like Red Bull, PepsiCo, Suntory, and Coca-Cola are driving growth through aggressive expansion strategies, including product innovation and strategic partnerships. For instance, Monster Energy’s 2024 sponsorships with OpTic Gaming and Hanwha Life Esports significantly enhance brand visibility among younger consumers. Simultaneously, direct-to-consumer brands are capitalizing on e-commerce and social media marketing to bypass traditional retail costs and build loyal customer bases through targeted digital engagement.
Technology adoption is emerging as a critical competitive advantage. Companies are focusing on high-pressure processing to extend shelf life while maintaining nutritional quality and are introducing sustainable packaging solutions, such as Suntory’s bio-paraxylene PET bottles, to align with environmental responsibility and premium positioning. These advancements address evolving consumer demands for health, convenience, and sustainability, strengthening competitive positioning. Additionally, emerging segments like cognitive enhancement drinks, probiotic functional shots, and clean-label formulations, emphasizing natural ingredients, taste, and convenience, offer significant growth opportunities by catering to nuanced consumer wellness needs.
The complex regulatory environment in the Asia-Pacific presents both challenges and opportunities. Companies that effectively navigate ingredient approvals and substantiate health claims can secure sustainable competitive advantages in premium market segments. This regulatory expertise not only supports premium pricing strategies but also fosters stronger brand loyalty as consumers increasingly demand transparency and efficacy. Overall, strategic innovation, technological advancements, and regulatory acumen are shaping a dynamic and competitive landscape in the Asia-Pacific functional beverage market.
Asia-Pacific Functional Beverages Industry Leaders
-
PepsiCo, Inc.
-
Red Bull GmbH
-
The Coca-Cola Company
-
Suntory Holdings Limited
-
Danone S.A.
- *Disclaimer: Major Players sorted in no particular order
Asia-Pacific Functional Beverages Market Companies Covered in this Report
- Red Bull GmbH
- The Coca-Cola Company
- Danone S.A.
- Nestlé S.A.
- Keurig Dr Pepper Inc.
- PepsiCo, Inc.
- Suntory Holdings Ltd
- Otsuka Holdings Co. Ltd
- Vitasoy International Holdings Ltd
- Monster Beverage Corp.
- Yakult Honsha Co. Ltd
- Wahaha Group Co. Ltd
- Kirin Holdings Co. Ltd
- Meiji Co. Ltd
- Asahi Group Holdings Ltd
- Ocean Drinks Private Limited
- Glanbia plc
- Vitasoy International Holdings Ltd
- Eastroc Beverage (Group) Co., Ltd.
- Ghodawat Consumer Limited
Read Analysis of Asia-Pacific Functional Beverages Companies

Market Opportunities and Future Outlook
Industrial investment and localization of supply are creating room for faster rollout of functional and better-for-you lines in key Asia-Pacific markets, particularly where capacity is being added near demand centers. In China, Tianjin Otsuka Beverage opened its second manufacturing facility in Tianjin in February 2026 to scale POCARI SWEAT output (reported at 300 million bottles annually and designed for roughly a 2.5x capacity uplift), and Genki Forest signed an agreement in May 2026 to build a USD 148 million manufacturing base in Hangzhou with eight beverage production lines. These expansions broaden the practical base for differentiated functional waters, electrolyte formats, and low-sugar variants, supported by shorter lead times and reduced reliance on cross-border supply.
Southeast Asia is also adding capacity aimed at broader, health-oriented portfolios, which supports wider assortment and channel penetration for functional beverages beyond legacy carbonated categories. Suntory PepsiCo opened its largest Asian factory in Tay Ninh, Vietnam in July 2026 as a USD 300 million investment with stated capacity of 1.24 billion litres annually, creating a base for high-volume production and faster innovation cycles across multiple beverage types. Alongside capacity additions, manufacturers are advancing process and ingredient technologies already used in the region (for example aseptic cold-fill, nitrogen dosing, and microencapsulation approaches for stability-sensitive ingredients), while operating in a more claim- and label-driven environment across major markets. This environment, including Singapore's Nutri-Grade direction and Japan's updated submission standards for Foods with Function Claims, favors compliance-ready low/no-sugar formulations and tightly substantiated functional claims as a route to premiumization.
Recent Industry Developments in Asia-Pacific Functional Beverages Market
- July 2026: Suntory PepsiCo inaugurated a USD 300 million manufacturing plant in Tay Ninh, Vietnam, positioned as its largest and most technologically advanced facility in the country. The site expands local production headroom and supports quicker scaling of reformulated and health-oriented beverage lines, improving responsiveness to shifting demand across Southeast Asia.
- September 2025: Russ Energy entered 7-Eleven stores across Australia with two variants, Original and Icy Twist. The placement in a major convenience channel supports grab-and-go discovery and reinforces the role of convenience retail expansion in accelerating trial for functional and energy drink brands.
- April 2024: Durex expanded into beverages by launching an energy drink in Malaysia in rambutan, dragon fruit, and coconut flavors. The move highlights adjacent-brand entry into functional and energy-style beverages and adds competitive noise in flavored energy offerings across ASEAN retail channels.


Asia-Pacific Functional Beverages Market Report Scope and Research Methodology
Market Definition and Coverage
For this study, the Asia-Pacific functional beverage market is defined as packaged drinks sold through retail and foodservice that carry an added functional benefit, such as energy, sports performance, fortification, or digestive support, and are measured on a value basis in current US dollars.
Scope exclusions: We exclude homemade drinks, unbranded loose mixes, and most conventional soft drinks, bottled water, and plain dairy unless a clear functional claim or added ingredient positioning is present.
Segments Covered in This Report
-
By Product Type
- Sports Drinks
- Energy Drinks
- Fortified Juice
- Dairy and Dairy Alternative Beverage
- Functional/Fortified Water
- Other Product Types
-
By Packaging Type
- PET/Glass Bottles
- Cans
- Tetra Pak
- Others
-
By Distribution Channel
- On-Trade
-
Off-Trade
- Supermarkets/Hypermarkets
- Pharmacies and Health Stores
- Convenience/Grocery Stores
- Online Retail Stores
- Other Distribution Channels
-
By Country
- China
- Japan
- India
- Australia
- Thailand
- Singapore
- Indonesia
- South Korea
- Rest of Asia-Pacific
Data Sources, Market Sizing, and Validation
Desk Research
Desk research was used to set the regional boundary and build the demand and supply context before modeling. We referenced public sources such as national statistics offices and customs portals for import-export trends, food regulator and standards bodies for labeling and fortification rules, and trade association releases for category definitions and channel notes. We also reviewed peer-reviewed nutrition and public health literature to understand consumer drivers that show up as sustained demand.
On the company side, annual reports, investor presentations, and press releases helped us track brand activity, capacity moves, and route-to-market shifts across major Asia-Pacific countries. Where required, paid subscriptions for company financials, patent searches, and shipment-level trade reads were used only to fill specific gaps and to cross-check desk findings. The sources listed here are illustrative, and many other public and subscription references were also used for data collection, validation, and clarification.
Primary Interviews and Surveys
Primary work focused on validating what drives value growth country by country, especially how functional claims translate into pricing, repeat purchase, and distribution expansion. We spoke with a mix of brand owners, ingredient and packaging participants, distributors, and retail or channel managers across APAC, then used follow-up checks to confirm assumptions on category splits, pricing ladders, and near-term demand signals.
Distribution of primary research fieldwork respondents
| Company type | Respondent position |
|---|---|
| Top tier: 30% | CXOs: 14% |
| Mid tier: 54% | Functional/Unit leaders: 42% |
| Smaller Players: 16% | Managers: 44% |
Market-Sizing & Forecasting
Sizing starts with a top-down reconstruction of Asia-Pacific functional beverage value by linking each covered country to observable consumption proxies, retail expansion cues, and trade flows, which are then translated into category value using realistic price bands. The model is then corroborated with selective bottom-up approximations, such as sampled average selling price by pack format multiplied by estimated volumes, plus channel checks on the share of functional positioning inside broader beverage shelves.
Key inputs used (illustrative) include historic category value growth, inflation and currency timing for USD conversion, urbanization and working-age population trends, functional claim intensity by category, and observed price premium versus standard beverages in modern trade and convenience. Where country data is thinner, gap handling is done through peer-country benchmarking and sensitivity checks on price and penetration so that the final totals do not over-react to one-off signals. For forecasting, we used scenario analysis supported by expert views on ingredient cost pass-through, new product activity, and distribution expansion, and then translated these scenarios into a single expected path after reconciliation.
Data Validation & Update Cycle
Outputs are validated through several checks before sign-off. We compare the modeled totals against independent signals like import-export movements, reported category growth cues in public filings, and channel expansion patterns, then investigate variances that fall outside expected bounds.
A second analyst review is completed to challenge assumptions, and re-contacts are triggered when new information changes pricing, distribution access, or country-level growth expectations. The report is refreshed annually, and interim updates are done when material events occur, such as regulatory shifts on claims or a sharp change in input costs. Before delivery, a fresh final pass is completed so clients receive the latest consistent view.
Mordor Intelligence's Asia Pacific Functional Beverage Market Size Compared Against Other Published Estimates
Published market sizes for functional beverages in Asia-Pacific can differ even when they talk about similar products, because each study chooses its own base year, country list, and what counts as a functional claim. Currency conversion timing and the assumed price premium also move the final number, especially in fast-growing categories.
Import-export direction checks, country-level category value trends, and channel expansion signals are the evidence points that keep the Mordor Intelligence 2026 estimate tied to a consistent APAC country basket and a defined functional-claim inclusion rule, which reduces over-counting of conventional drinks that only carry general wellness messaging.
Benchmark comparison
| Source | Market Size | Gaps in Research Methodology |
|---|---|---|
| Mordor Intelligence | USD 116.19 B (2026) | |
| Global Consultancy A | USD 96.05 B (2025) | Uses a 2025 base year and a broader functional category list that can treat herbal teas and nutraceutical-style drinks as a larger counted pool, and it may also apply different price ladders by packaging. |
| Industry Platform B | USD 98.53 B (2024) | Anchors sizing to 2024 and may apply a different country coverage and exchange-rate timing, which shifts USD totals, and it can also rely more on stated category splits that are not always re-validated through channel checks. |
Overall, the spread is mainly explained by base-year choice, APAC country coverage, and how strictly functional claims are filtered before value is assigned. By keeping the steps traceable to country demand signals and realistic price bands, the estimate stays repeatable and easier to reconcile when new data points appear.


Key Questions Answered in the Report
What is the current value of the Asia-Pacific functional beverages market?
The functional beverages market size in Asia-Pacific is valued at USD 116.19 billion in 2026.
How fast is demand for functional and fortified water growing?
Functional and fortified water is projected to record a 6.92% CAGR between 2026 and 2031, the quickest among product categories.
Which distribution channel is expanding the fastest?
On-trade venues such as cafés and fitness studios are expected to post an 7.95% CAGR through 2031 as experiential consumption recovers.
Why are aluminum cans gaining share in functional beverages?
Cans offer high recyclability and align with consumer sustainability priorities, driving a 7.22% CAGR in can-packaged functional drinks.
Page last updated on:


 Your data is secure and never sold or shared.


