Market Overview
| Study Period | 2019 - 2030 |
|---|---|
| Forecast Data Period | 2025 - 2030 |
| Historical Data Period | 2019 - 2023 |
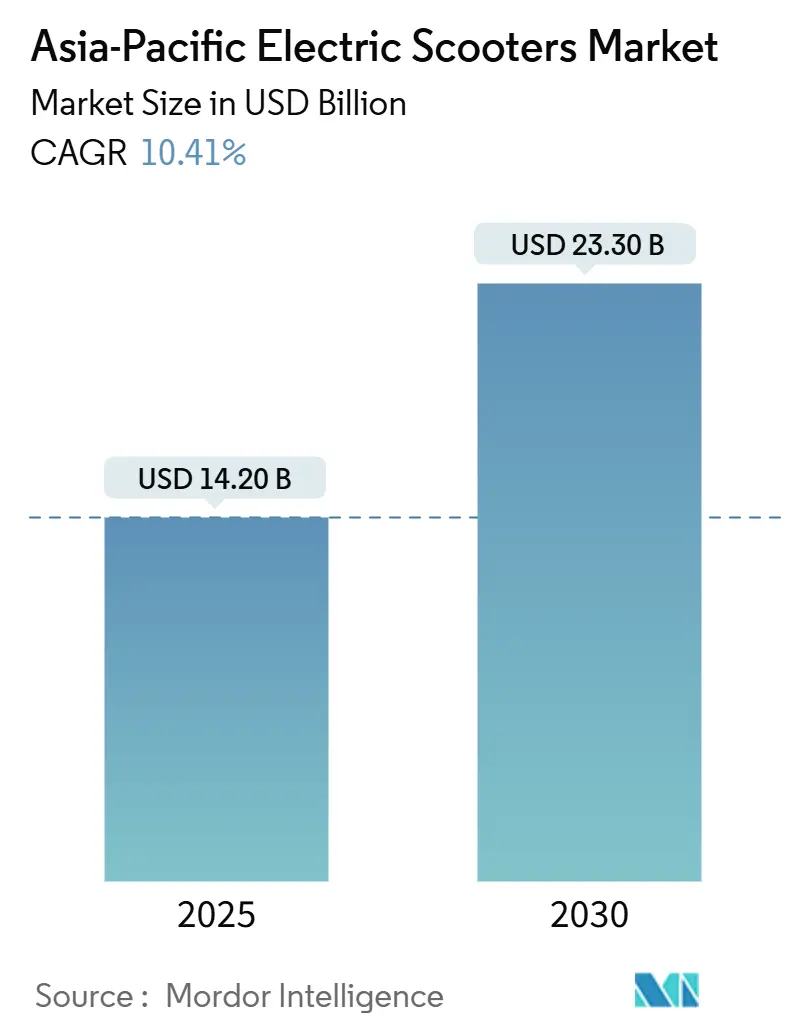
| Market Size (2025) | USD 14.20 Billion |
| Market Size (2030) | USD 23.30 Billion |
| Growth Rate (2025 - 2030) | 10.41% CAGR |
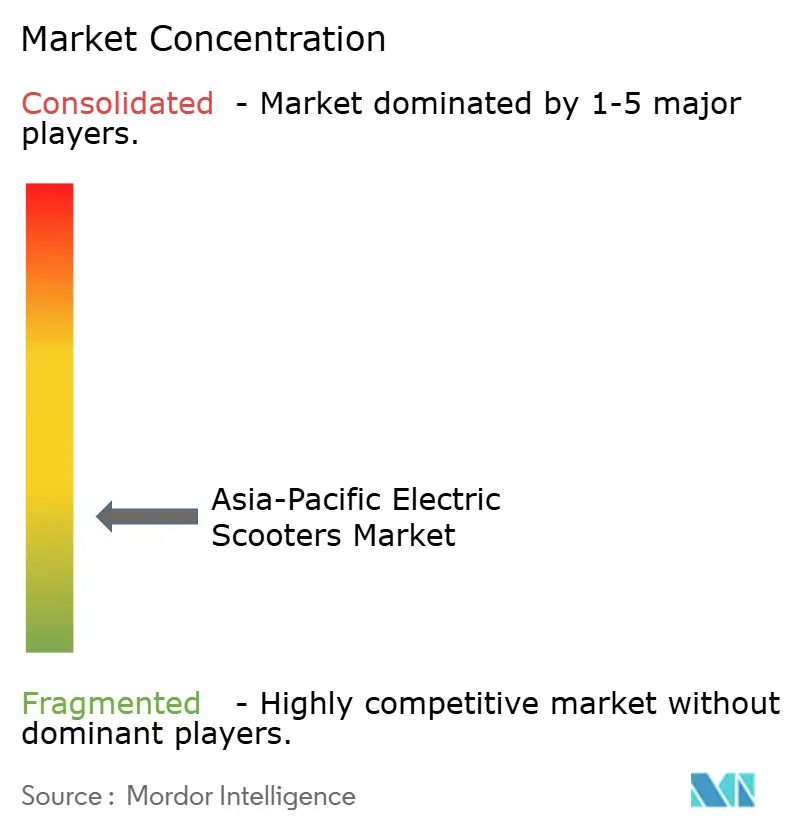
| Market Concentration | Low |
Major Players *Disclaimer: Major Players sorted in no particular order Image © Mordor Intelligence. Reuse requires attribution under CC BY 4.0. | |
Asia-Pacific Electric Scooters Market Analysis by Mordor Intelligence
The Asia-Pacific electric scooters market size stands at USD 14.20 billion in 2025 and is projected to reach USD 23.30 billion by 2030, growing at a 10.41% CAGR during the forecast period. Rapid urbanization and rising adoption of cost-efficient mobility solutions are supporting demand across major economies. Government-backed electrification programs in China, India, and Southeast Asia are widening the customer base, supported by subsidies and favorable registration norms.
Lithium-ion battery technology accounts for a dominant share owing to higher energy density and declining pack prices. Moreover, domestic cell manufacturing initiatives across China and India are narrowing supply chain dependencies. Battery-swapping networks continue to expand, especially in densely populated urban centers, lowering charging time and improving fleet utilization.
Commercial usage from last-mile delivery companies is escalating as e-commerce volumes expand. Companies in India, China, and Indonesia are scaling dedicated electric two-wheeler fleets to reduce fuel costs and comply with emerging emission-reduction mandates. Furthermore, shared mobility operators are increasing deployments of connected electric scooters, supported by telematics-based fleet management systems.
Key Report Takeaways
- By battery type, lithium-ion accounted for 68.05% of the Asia-Pacific electric scooters market in 2025. Sodium-ion and other emerging chemistries are projected to expand at a 14.25% CAGR through 2030, the fastest growth rate within this category.
- By power output, models below 3.6 kW held a 46.70% share of the regional market in 2025, while scooters rated above 10 kW are projected to grow at an 11.66% CAGR through 2030, the highest among the power classes.
- By motor/drive type, hub motors captured 63.40% of the Asia-Pacific market in 2025. Mid-drive systems are forecast to record a 12.05% CAGR through 2030, supported by rising demand for enhanced efficiency and performance.
- By end-use, personal mobility represented 54.80% of total demand in 2025. Delivery and logistics fleets are projected to grow at a 12.71% CAGR through 2030, driven by e-commerce expansion and fleet electrification mandates.
- By country, China accounted for 38.90% of regional market value in 2025. India is the fastest-growing major market in Asia-Pacific, with growth expected to exceed the regional average CAGR of 10.41% through 2030.
Asia-Pacific Electric Scooters Market Trends and Insights
Drivers Impact Analysis*
| Driver | (~) % Impact on CAGR Forecast | Geographic Relevance | Impact Timeline |
|---|---|---|---|
| Rapid Urbanization and Congestion-Led Demand | 2.4% | China Tier-1 cities, India metros, Indonesia, Vietnam | Long term (≥4 years) |
| Government Incentives and Purchase Subsidies | 2.2% | China, India, Taiwan, Thailand, Vietnam | Medium term (2–4 years) |
| E-Commerce and On-Demand Fleet Electrification | 2.0% | India, China, Indonesia, South Korea | Medium term (2–4 years) |
| Tightening Emission Norms and ICE Usage Restrictions | 1.7% | China, India, Thailand, Vietnam, Philippines | Long term (≥4 years) |
| Expansion of Charging and Battery-Swapping Networks | 1.4% | China, India, Taiwan, Indonesia | Long term (≥4 years) |
| Localization of Battery Packs and Vehicle Assembly | 1.0% | China, India, ASEAN emerging markets | Short to medium term (≤4 years) |
| Source: Mordor Intelligence | |||
Growing Urban Congestion and Last-Mile Mobility Demand
Rapid urbanization across major Asia-Pacific cities is increasing travel delays and reducing transport efficiency. Metropolitan areas in China, India, Indonesia, and Vietnam report persistent congestion during peak hours, leading commuters to seek compact mobility solutions. Electric scooters shorten door-to-door travel time, reduce parking constraints, and integrate well with metro and bus systems.
Regional governments are supporting this shift by creating low-speed vehicle corridors, expanding two-wheeler parking zones, and restricting internal-combustion two-wheelers in select urban districts. These measures are improving the attractiveness of electric scooters for last-mile travel and strengthening long-term adoption across high-density cities.
Government Incentives and Subsidy Programs
Policy support remains a core growth driver across Asia-Pacific. China continues to implement registration benefits and local manufacturing incentives for electric two-wheelers, while India’s Electric Mobility Promotion Scheme 2024 reduces acquisition cost for domestically produced models. Southeast Asian countries, including Thailand and Indonesia, are allocating tax rebates and import-duty reductions to encourage local assembly[1]“Electric Mobility Promotion Scheme 2024 (EMPS 2024),” Ministry of Heavy Industries, heavyindustries.gov.in.
These interventions lower retail prices, improve financing access, and provide predictable demand signals to manufacturers. Standardized compliance rules and evolving safety norms further reduce operational risks for shared mobility operators and delivery fleets, supporting broader adoption across the region.
Rapid Expansion of E-commerce Delivery Fleets
E-commerce platforms and food delivery operators in India, China, Indonesia, and South Korea are electrifying two-wheeler fleets to lower operating expenses and comply with sustainability commitments. Partnerships between manufacturers and logistics companies are accelerating large-scale deployments.
Battery-swapping networks in markets such as Taiwan and Indonesia enable high fleet utilization by minimizing downtime. Telematics and route-optimization systems enhance energy efficiency and reduce per-delivery operating cost. These developments position electric scooters as a preferred asset class for commercial fleets in dense urban zones[2]“Gogoro Network and Global Battery Swapping Footprint,” Gogoro Inc., gogoro.com.
Declining Lithium-ion Battery Prices
Battery pack prices have continued to fall across Asia-Pacific due to scale manufacturing in China and increasing localization in India. LFP chemistries dominate cost-sensitive models owing to favorable safety profiles and longer cycle life. Sodium-ion batteries entered early mass production in 2024, offering suitable performance for regulated low-speed fleets and creating new opportunities for cost optimization.
Lower pack prices allow manufacturers to offer longer-range variants without significant price increases, broadening the customer base across personal mobility and commercial applications. Cost parity with petrol scooters in several Asia-Pacific markets is improving the economic case for electrification[3]“Lithium-ion Battery Pack Prices See Largest Drop Since 2017, Falling to USD 115 per kWh,” BloombergNEF, about.bnef.com.
Restraints Impact Analysis*
| Restraint | (~) % Impact on CAGR Forecast | Geographic Relevance | Impact Timeline |
|---|---|---|---|
| Limited Public Charging and Swapping Infrastructure | -1.5% | India Tier-2/3 cities, Indonesia, Vietnam, Philippines | Medium term (2–4 years) |
| High Upfront Cost Versus Petrol Two-Wheelers | -1.3% | India, Indonesia, Vietnam, Bangladesh, rural China | Short term (≤2 years) |
| Battery Safety Incidents and Evolving Standards | -1.0% | India, China, selected ASEAN markets | Short term (≤2 years) |
| Import Dependence for Cells and Key Materials | -0.8% | India, ASEAN, South Korea assemblers | Long term (≥4 years) |
| Source: Mordor Intelligence | |||
Limited Public Charging and Swapping Infrastructure
Charging availability remains uneven across the region, especially outside major metropolitan centers. Many users lack access to private parking, increasing reliance on public chargers that are often insufficient for the expanding user base. Battery-swapping networks offer a viable alternative; however, rollout requires high capital expenditure, and interoperability across brands remains limited.
These constraints heighten range anxiety and slow adoption among daily commuters and fleet operators. The impact is more pronounced in densely populated cities in India, Indonesia, and Vietnam, where residential charging access is restricted and regulatory frameworks are still evolving.
High Upfront Acquisition Cost Compared with ICE Alternatives
Despite falling battery prices, electric scooters continue to command a higher retail price than comparable petrol two-wheelers. This cost gap persists in price-sensitive markets such as India, Indonesia, and Vietnam, where households rely heavily on cash purchases or informal credit.
Government rebates shorten the payback period but do not fully close the initial cost difference. Financing solutions such as battery leasing and pay-per-use models exist but remain limited to urban centers and carry higher interest rates than traditional motorcycle loans. Total cost-of-ownership parity often requires 18–24 months of usage, which exceeds the financial planning comfort level of many consumers in lower-income segments.
*Our forecasts treat driver/restraint impacts as directional, not additive. The impact forecasts reflect baseline growth, mix effects, and variable interactions.
Segment Analysis
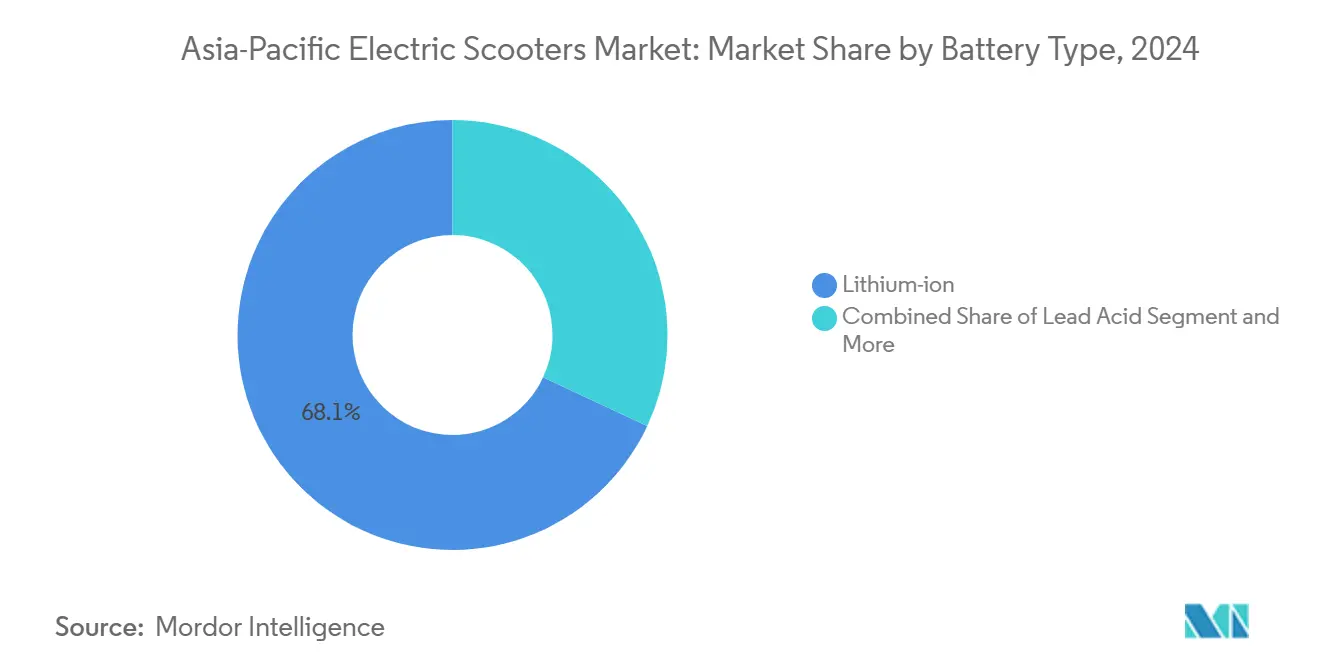
By Battery Type: Lithium-Ion Dominance with Emerging Chemistries Scaling
Lithium-ion batteries account for 68.05% of the Asia-Pacific electric scooters market in 2025, forming the core chemistry for both mass-market and mid-premium models. Lithium-ion polymer adds another 11.0%, reinforcing the dominance of advanced lithium chemistries in the region. Lead-acid maintains a 16.0% share, largely in entry-level and utility-focused vehicles targeting highly price-sensitive buyers.
Sodium-ion and other emerging chemistries together hold a modest share in 2025. However, this segment is projected to grow at a 14.25% CAGR through 2030, the fastest among all battery types. Faster growth of sodium-ion and related chemistries is expected to gradually shift share away from lead-acid and a portion of low-end lithium-ion, especially in fleet applications where total cost per cycle and raw material availability are key decision factors.


By Power Output: Sub-3.6 kW Volumes, High-Power Niche Accelerating
Scooters rated below 3.6 kW represent the largest power class, with a 46.70% share of the Asia-Pacific market in 2025. This band aligns with urban, low-speed commuting and favorable licensing norms in many Asia-Pacific economies. The 3.6–7.2 kW range follows closely with a 39.5% share, serving users that require higher acceleration and the ability to handle peri-urban trips while remaining within two-wheeler regulatory thresholds.
Scooters above 10 kW account for only 4.80% of market value in 2025 but are projected to grow at an 11.66% CAGR through 2030, the fastest among all power bands. This indicates rising interest in expressway-capable and performance-oriented electric two-wheelers, particularly in developed Asia-Pacific markets.
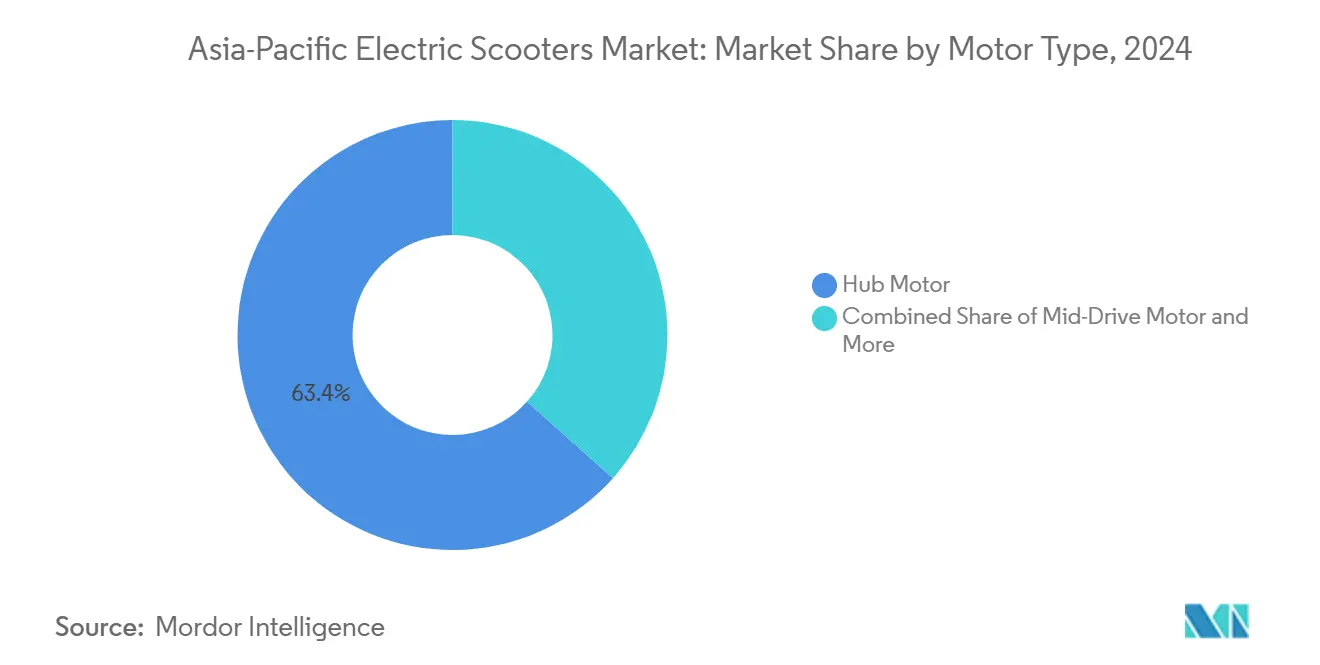
By Motor/Drive Type: Hub Motors Lead, Mid-Drive Gaining Share
Hub motors dominate the regional market with a 63.40% share in 2025. Their integrated design, lower maintenance needs, and suitability for high-volume urban models support this leadership. Belt-drive and chain-drive configurations together account for 20.0% of the market (belt 12.0%, chain 8.0%), mainly in models that prioritize durability or specific ride characteristics.
Mid-drive motors hold 16.60% share but represent the fastest-growing drive type, with a projected 12.05% CAGR over 2025–2030. Growth in this category is supported by commercial and premium users that require higher torque, better hill-climbing ability, and more efficient weight distribution. Over the forecast period, hub motors are expected to retain majority share, while mid-drive systems capture incremental share in performance and fleet-focused segments.
By End-Use: Personal Ownership Still Largest, Fleets Expanding Rapidly
Personal and individual mobility accounts for 54.80% of the Asia-Pacific electric scooters market in 2025, reflecting strong replacement of internal-combustion two-wheelers in commuter use. Commercial and corporate fleets represent 18.0%, supported by internal sustainability targets and controlled duty cycles on campuses and industrial sites. Micromobility service providers, including shared scooter operators, contribute 12.0% of demand.
Delivery and logistics fleets account for 15.20% of the market in 2025 and are projected to grow at a 12.71% CAGR through 2030, the fastest among all end-use segments. Growth in this category is closely linked to e-commerce expansion and the need to reduce per-order delivery cost and urban emissions, especially in large cities in India, China, and Southeast Asia.
Geography Analysis
By Country: China Anchors the Market, India Leads Growth
China holds 38.90% of the Asia-Pacific electric scooters market in 2025, supported by a mature supplier base, extensive dealer networks, and strong policy push for two-wheeler electrification. India accounts for 23.05% of regional market value and is the fastest-growing major market, with growth expected to exceed the regional CAGR of 10.41% over 2025–2030. Rising central and state-level incentives, local manufacturing, and rapid expansion of charging and swapping infrastructure support this trend.
Japan and South Korea represent 10.0% and 7.0% of the market, respectively, driven by technology-focused consumer segments and established OEMs. The Rest of Asia-Pacific cluster accounts for 21.1%, covering Indonesia, Vietnam, Thailand, and other emerging markets where two-wheeler penetration is high and electrification initiatives are scaling from a relatively low base.
Competitive Landscape
The Asia-Pacific electric scooters market exhibits moderate fragmentation, with scale concentrated in Chinese and Indian manufacturers. Chinese brands Yadea Technology Group and NIU Technologies anchor domestic volumes and expand into Southeast Asia through importer and distributor networks. In India, players such as Ather Energy and Hero Electric Vehicles are scaling production, supported by central and state-level incentives and localized component sourcing.
Competitive advantages are shifting toward control of the broader ecosystem. Gogoro Inc. operates battery-swapping infrastructure and energy-as-a-service offerings, turning battery access into a recurring-revenue model and strengthening fleet stickiness. Leading OEMs are investing in in-house battery-pack assembly, software platforms, and telematics, allowing tighter control over performance, data, and aftersales revenue streams.
Rising safety and performance standards across major Asia-Pacific markets are increasing compliance and certification costs. Smaller import-driven brands face pressure from homologation rules, fire-safety investigations, and warranty requirements, which favor established manufacturers with certified quality systems, robust supplier relationships, and the ability to invest in upgraded battery and BMS designs. Strategic partnerships with cell suppliers and technology startups are supporting chemistry diversification and long-term cost control.
Asia-Pacific Electric Scooters Industry Leaders
Yadea Technology Group
NIU Technologies
Gogoro Inc.
TVS Motor Company
Bajaj Auto
- *Disclaimer: Major Players sorted in no particular order

Recent Industry Developments
- December 2025: Ola Electric commenced deliveries of its first electric scooters equipped with domestically manufactured “Bharat Cell” 4680-format batteries in India. The initial model, the Ola S1 Pro+, features a 13 kW motor, a claimed range of up to 320 km under IDC testing conditions, four riding modes, and dual ABS with disc brakes, marking a step toward vertical integration of cell and pack production within the region.
- November 2025: Yamaha Motor announced the launch of two new electric scooters for the Indian market, the in-house–developed AEROX E electric sport scooter and the EC-06 electric scooter co-created with River Mobility. The dual-launch expands Yamaha’s electric portfolio in Asia-Pacific and underscores collaboration between Japanese OEMs and local EV specialists.
- November 2025: Ather Energy introduced its Rizta electric scooter in Sri Lanka at the Colombo Motor Show 2025, marking one of the brand’s first international expansions beyond India. The move strengthens Ather’s presence in South Asia and positions the Rizta as a family-oriented electric scooter for urban commuting in regional export markets.


Asia-Pacific Electric Scooters Market Report Scope
By Battery Type
| Lead-acid |
| Lithium-ion |
| Lithium-ion Polymer |
| Sodium-ion & Emerging |
By Power Output
| Less than 3.6 kW |
| 3.6-7.2 kW |
| Above 7.2 kW |
By Motor / Drive Type
| Hub Motor |
| Belt Drive |
| Chain Drive |
| Mid-drive Motor |
By End-Use
| Personal / Individual |
| Commercial & Corporat |
| Micromobility Service |
| Delivery & Logistics |
By Geography
| China |
| India |
| Japan |
| South Korea |
| Indonesia |
| Vietnam |
| Thailand |
| Rest of Asia-Pacific |
| By Battery Type | Lead-acid |
| Lithium-ion | |
| Lithium-ion Polymer | |
| Sodium-ion & Emerging | |
| By Power Output | Less than 3.6 kW |
| 3.6-7.2 kW | |
| Above 7.2 kW | |
| By Motor / Drive Type | Hub Motor |
| Belt Drive | |
| Chain Drive | |
| Mid-drive Motor | |
| By End-Use | Personal / Individual |
| Commercial & Corporat | |
| Micromobility Service | |
| Delivery & Logistics | |
| By Geography | China |
| India | |
| Japan | |
| South Korea | |
| Indonesia | |
| Vietnam | |
| Thailand | |
| Rest of Asia-Pacific |


Key Questions Answered in the Report
What is the market size of the Asia-Pacific electric scooter market?
The Asia-Pacific electric scooter market is valued at USD 14.20 billion in 2025 and is projected to reach USD 23.30 billion by 2030, growing at a 10.41% CAGR during the forecast period.
What factors are driving the growth of electric scooters in Asia-Pacific?
Growth is driven by rapid urban congestion, government-backed electrification programs, expansion of e-commerce delivery fleets, and declining lithium-ion battery prices. Improvements in charging and swapping networks further strengthen adoption in major cities.
Which battery type dominates the Asia-Pacific electric scooter market?
Lithium-ion batteries hold the largest share at 68.05%, supported by energy density improvements, lower pack costs, and wider OEM adoption. Sodium-ion batteries represent a small share but record the fastest growth at a 14.25% CAGR.
Which power output category accounts for the highest demand?
Models below 3.6 kW account for 46.70% of the Asia-Pacific market in 2025, driven by low-speed regulatory norms and strong urban commuting demand. Higher-power models (>10 kW) constitute a smaller segment but grow fastest at 11.66% CAGR.
Which end-use segment contributes most to market demand?
Personal or individual mobility accounts for 54.80% of demand. Delivery and logistics fleets form the fastest-growing segment with a 12.71% CAGR, supported by the rise of e-commerce and last-mile delivery requirements.
Page last updated on:


