Pharmaceutical Plastic Bottles Market Size and Share
Market Overview
| Study Period | 2020 - 2031 |
|---|---|
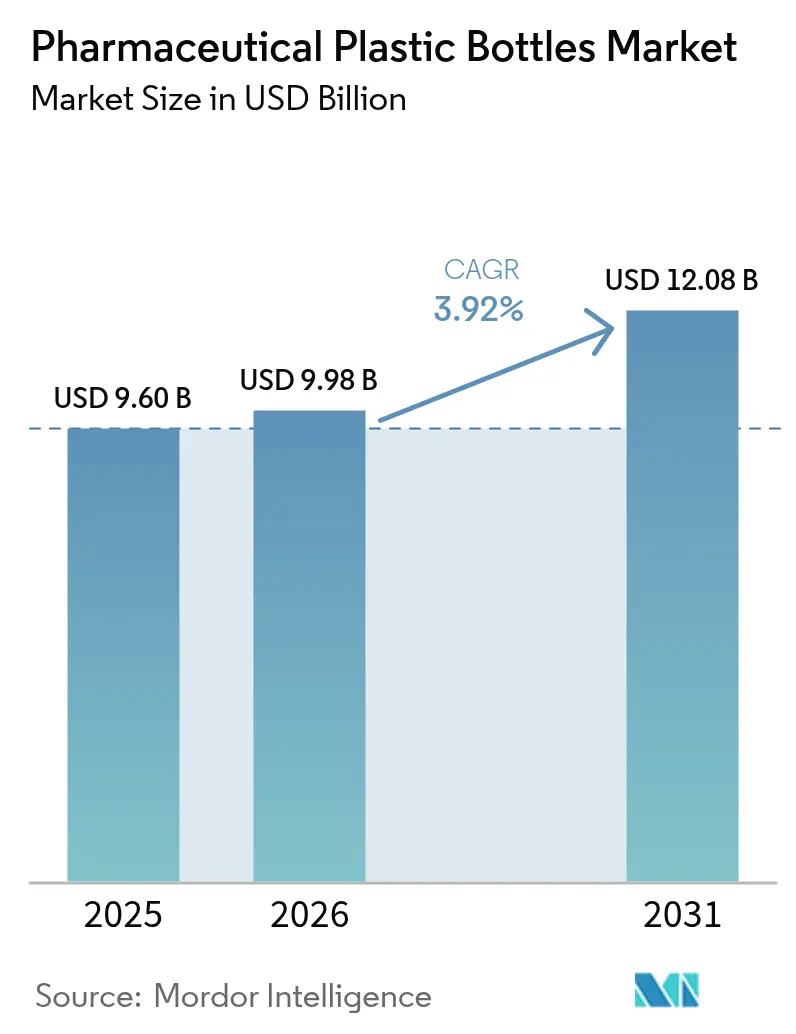
| Market Size (2026) | USD 9.98 Billion |
| Market Size (2031) | USD 12.08 Billion |
| Growth Rate (2026 - 2031) | 3.92% CAGR |
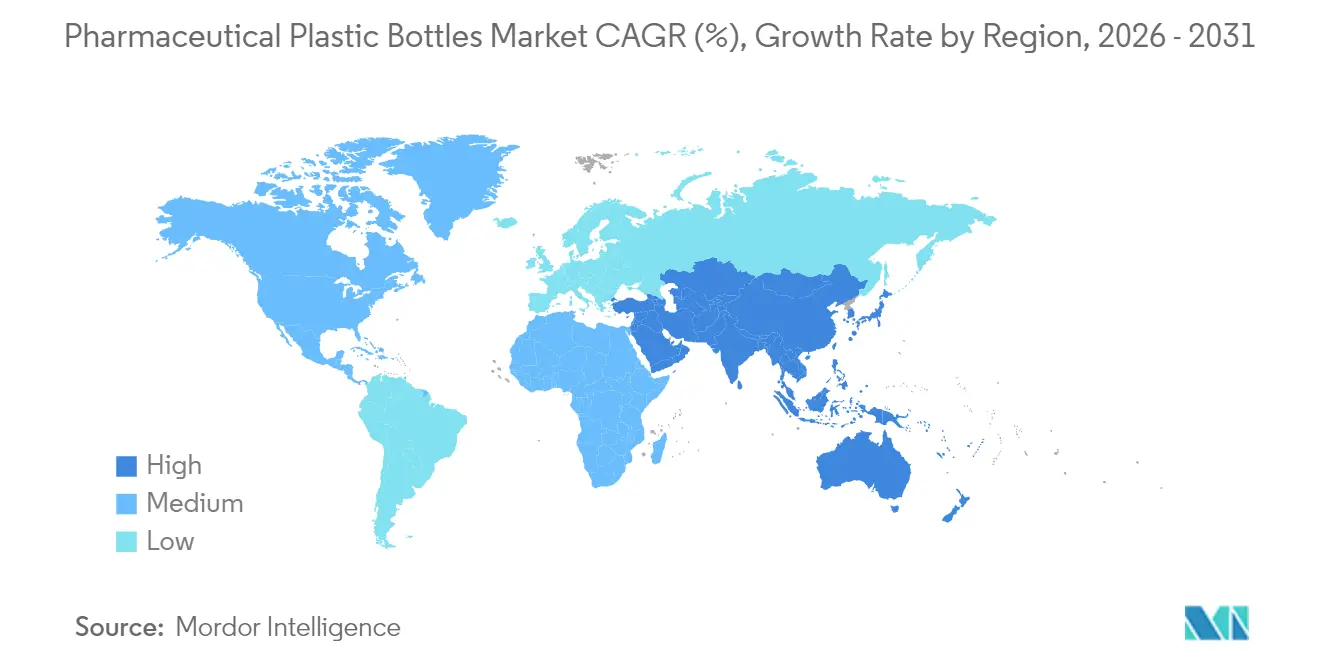
| Fastest Growing Market | Asia Pacific |
| Largest Market | North America |
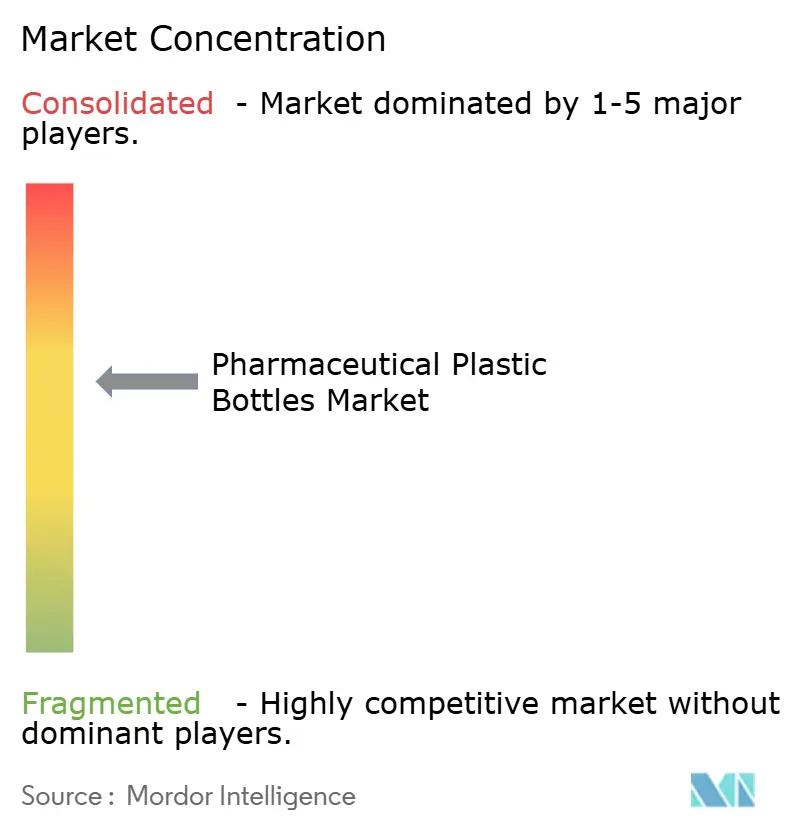
| Market Concentration | Medium |
Major Players
*Disclaimer: Major Players sorted in no particular order Image © Mordor Intelligence. Reuse requires attribution under CC BY 4.0. |
|
Pharmaceutical Plastic Bottles Market Analysis by Mordor Intelligence
The pharmaceutical plastic bottles market size in 2026 is estimated at USD 9.98 billion, growing from 2025 value of USD 9.60 billion with 2031 projections showing USD 12.08 billion, growing at 3.92% CAGR over 2026-2031. Rising biologics volumes underpin growth, stricter global serialization mandates, and broader adoption of child-resistant yet senior-friendly closures that satisfy FDA 16 CFR 1700 requirements.[1]FDA, “Child-Resistant Packaging Requirements,” Code of Federal Regulations, fda.gov Resin innovation, especially chemically recycled PET that meets USP and FDA purity standards, is opening fresh opportunities for premium liquid formulations. At the same time, Europe’s single-use plastic levies and polymer feedstock volatility add cost pressure, nudging producers toward material efficiency and closed-loop supply chains. Consolidation is intensifying after the April 2025 Amcor–Berry Global merger, which created USD 650 million in expected synergies and a new scale benchmark for the pharmaceutical plastic bottles market.
Key Report Takeaways
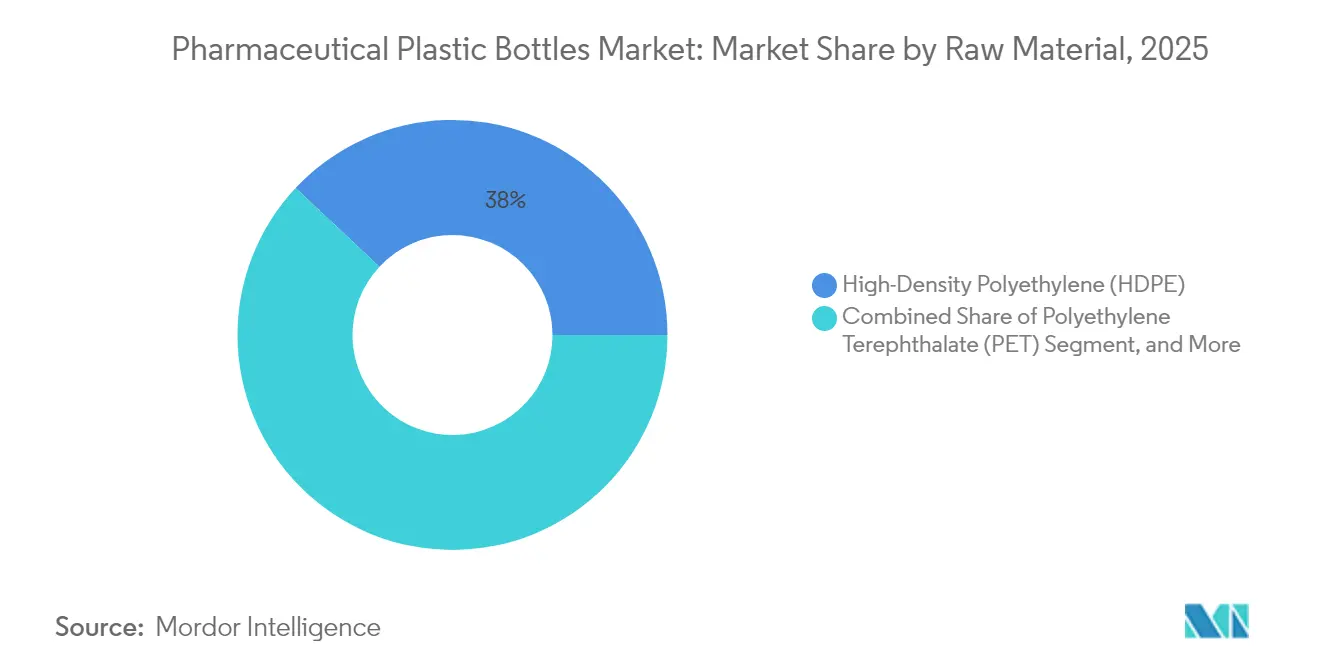
- By raw material, HDPE led with 38.02% share in 2025; PET is forecast to expand at a 5.28% CAGR through 2031.
- By bottle type, solid oral containers accounted for 41.88% revenue share in 2025, whereas nasal spray bottles are projected to grow at 5.44% CAGR to 2031.
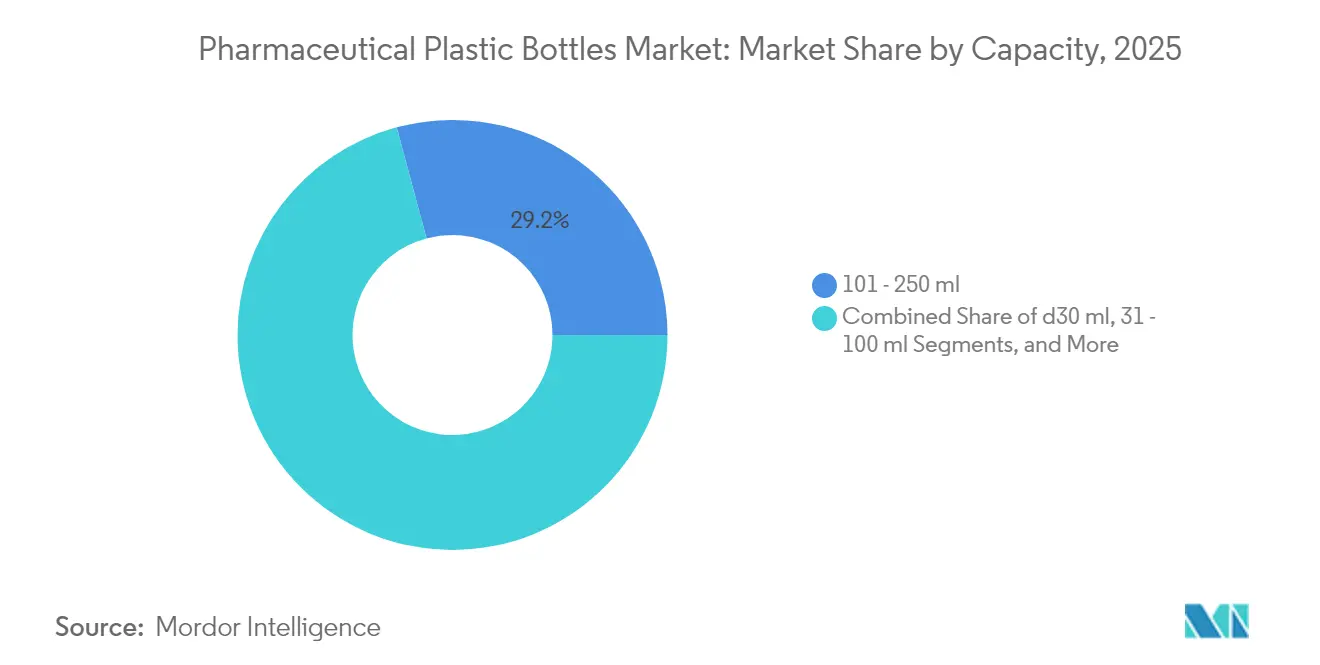
- By capacity, the 101–250 ml range captured 29.18% of the pharmaceutical plastic bottles market share in 2025; the ≤30 ml format is set to rise at a 5.05% CAGR between 2026 and 2031.
- By end user, generic drug manufacturers held 33.92% share of the pharmaceutical plastic bottles market size in 2025, while CDMOs are likely to post the fastest 6.18% CAGR through 2031.
- By geography, North America commanded a 39.55% share in 2025; Asia-Pacific is anticipated to register a 7.05% CAGR over the outlook period.
Note: Market size and forecast figures in this report are generated using Mordor Intelligence’s proprietary estimation framework, updated with the latest available data and insights as of 2026.
Global Pharmaceutical Plastic Bottles Market Trends and Insights
Drivers Impact Analysis*
| Driver | (~) % Impact on CAGR Forecast | Geographic Relevance | Impact Timeline |
|---|---|---|---|
| Child-resistant, senior-friendly closures | +0.8% | Global, stronger in North America & EU | Medium term (2-4 years) |
| Scale-up of liquid biologics | +1.2% | Global, concentrated in developed markets | Long term (≥4 years) |
| Personalized home-care regimens | +0.6% | North America & EU, expanding to APAC | Medium term (2-4 years) |
| U.S. manufacturing re-shoring | +0.4% | North America, global spillover | Long term (≥4 years) |
| Serialization in emerging markets | +0.7% | APAC core, Latin America & MEA | Short term (≤2 years) |
| Chemical-recycling grade PET | +0.5% | EU leadership, spread to North America & APAC | Long term (≥4 years) |
| Source: Mordor Intelligence | |||
Increasing Shift Toward Child-Resistant, Senior-Friendly Closures
Rising life expectancy and regulatory refinements have recast closure design priorities. The FDA now tests both child resistance and senior accessibility, pushing suppliers toward torque-balancing mechanisms and novel grip geometries. AptarGroup’s two-step push-turn caps exemplify the pivot to ergonomic safety, and adoption is accelerating as the global population aged 65+ doubles by 2050. Producers investing in these dual-function systems gain an edge in the pharmaceutical plastic bottles market because compliance has become a procurement prerequisite for large drug makers in the United States and the European Union.
Rapid Scale-Up of Biologics and Specialty Drugs in Liquid Form
Liquid biologics need high-barrier, low-extractable packaging. PET bottles coated with oxygen scavengers and Class VI-compliant HDPE containers now shield sensitive formulations, enabling room-temperature storage for select monoclonal antibodies. Clean-room bottle manufacturing that meets ISO 14644-1 has become table stakes, and capacity expansions announced by Gerresheimer and Stevanato Group underline the commercial opportunity. As biosimilar entrants lower treatment costs, more therapies shift from vials to oral and nasal formats, enlarging the addressable base for the pharmaceutical plastic bottles market.
Rise of Personalized Home-Care Medication Regimens
Payers and providers are moving chronic and specialty therapies into the home, spurring demand for smaller, digitally enabled bottles. Start-ups such as CurifyLabs embed NFC tags that transmit dosing data to cloud dashboards for clinicians. These smart containers mesh with serialization rules, closing feedback loops on adherence. The resulting need for on-demand, batch-size-one production is nudging packaging vendors to adopt 3-D printing for rapid mold creation, adding flexibility that large-volume generic lines lack.
Re-shoring of Pharma Manufacturing in the United States
Washington’s industrial policy has unlocked fresh line-time for domestic packagers. Eli Lilly’s USD 2.1 billion facility expansions anchor new clusters that favor local resin sourcing and short supply chains. While onshore labor costs are higher, nearer-to-plant delivery minimizes inventory days and strengthens compliance oversight. Consequently, North American converters that certify to cGMP Part 210-211 standards are winning long-term contracts, reinforcing the pharmaceutical plastic bottles market’s regional concentration.
Restraints Impact Analysis*
| Restraint | (~) % Impact on CAGR Forecast | Geographic Relevance | Impact Timeline |
|---|---|---|---|
| European single-use plastic taxation | -0.9% | EU-focused, policy spillover | Short term (≤2 years) |
| Glass-to-polymer shift reversal for injectables | -0.6% | Global, premium biologics | Medium term (2-4 years) |
| Volatile crude-derived feedstock prices | -0.7% | Global, regional variations | Short term (≤2 years) |
| Scarce pharma-grade recyclate supply | -0.4% | Global, EU & North America | Long term (≥4 years) |
| Source: Mordor Intelligence | |||
Stringent Single-Use Plastic Taxation in Europe
Germany now levies EUR 0.80 per kg on single-use plastic packaging, and Italy and Spain apply similar schemes. This adds roughly 3-5% to bottle unit costs, narrowing margins for generic drug packagers that compete on pennies per pack. To stay competitive, converters are trimming wall thickness, substituting bio-based PE, and certifying closed-loop supply agreements with recyclers. Until chemical recycling scales, however, price headwinds will restrain the pharmaceutical plastic bottles market across Europe.
Volatility in Crude-Derived Polymer Feedstock Prices
Propylene spot prices swung 15–20% in 2024 as geopolitics disrupted refining flows.[2]U.S. Energy Information Administration, “Petroleum & Other Liquids Data,” eia.gov Given multi-year bottle supply contracts and strict change-control, converters cannot flex formulas quickly. Larger firms hedge resin with forward contracts; smaller players swallow margin hits or exit. Resulting consolidation is visible in the Amcor–Berry tie-up, which pools resin purchasing power and stabilizes cost structure in the pharmaceutical plastic bottles market.
*Our forecasts treat driver/restraint impacts as directional, not additive. The impact forecasts reflect baseline growth, mix effects, and variable interactions.
Segment Analysis
By Raw Material: PET’s Rise Challenges HDPE’s Reign
HDPE generated 38.02% of the pharmaceutical plastic bottles market revenue in 2025, anchored by moisture-barrier strength and low cost for solid oral drugs. The pharmaceutical plastic bottles market size for HDPE packaging was roughly USD 3.65 billion that year. Producers leverage existing high-speed extrusion blow-molding lines, enabling generic manufacturers to hit price points below USD 0.05 per 100-ml bottle. However, PET’s 5.28% CAGR through 2031 signals a gradual hand-off. Chemical recycling delivers near-virgin clarity that reassures regulators inspecting biologic and pediatric formulations, and PET’s compatibility with oxygen scavenger coatings extends shelf life. Leading converters have converted shuttle lines to two-stage ISBM to capture the pharmaceutical plastic bottles market share in high-value liquids. Further PET growth depends on securing FDA Letters of No Objection for each recycled feedstock stream, a process still viewed as cumbersome by mid-tier suppliers.
Over the forecast horizon, PP will protect its niche in closure systems needing chemical and steam-sterilization resilience, while LDPE maintains relevance in squeeze-tip ophthalmic brands despite slower volume growth. The industry’s pivot toward USP <665> plastic systems widens test scope for extractables, obliging resin makers to refine additive packages. This evolution should moderate HDPE’s dominance yet reinforce a multi-material equilibrium where application fit trumps cost alone, sustaining a balanced competitive field within the pharmaceutical plastic bottles market.


By Bottle Type: Solid Oral Containers Still Rule, but Nasal Spray Systems Surge
Solid oral containers captured 41.88% of 2025 revenue, reflecting continued tablet and capsule prevalence in chronic disease therapies. The pharmaceutical plastic bottles market size, linked to these containers, reached USD 4.02 billion. Standardized 40- and 100-dram formats run efficiently on high-speed filling lines and integrate readily with vision-based inspection. Conversely, nasal spray bottles-projected to climb 5.44% CAGR-are redefining growth prospects. Aptar’s FDA-cleared neffy epinephrine spray signals a broader transition from autoinjectors to intranasal delivery. Devices demand tight dimensional tolerances and metal-free pumps like APF’s Futurity, lifting ASPs fourfold versus oral bottles. Liquid syrup and oral-care rinse bottles sustain moderate growth, buoyed by cough-cold and dental hygiene segments but exposed to sugar-reduction trends.
Manufacturers that master clean-room assembly of nasal actuators extend their value chain share and insulate margins. This specialization raises entry barriers and, by extension, supports price discipline in a segment where clinical performance and device precision outweigh lowest-cost supply, influencing the overall profitability of the pharmaceutical plastic bottles market.
By Capacity: Mid-Volume Formats Dominate as Micro-Doses Gain Momentum
The 101–250 ml band owned 29.18% of shipments in 2025, reflecting standard prescription runs and pediatric antibiotics packaged in this sweet spot. Yet the ≤30 ml tier is sprinting at a 5.05% CAGR as precision oncology and orphan-drug doses shrink. Smart caps with embedded microchips fit easily onto these smaller bottles, aligning with remote-care models. Over 250 ml formats serve institutional pharmacies and long-term-care facilities, but unit‐dose regulations are steering hospitals toward verified single-patient packs, limiting upside.
As personalized therapies proliferate, demand forecasts favor agile blow–fill–seal platforms that switch cavities in under one hour, supporting economies at much lower run lengths. Suppliers able to amortize tooling tweaks across many micro-dose SKUs will claim the fastest-growing slice of the pharmaceutical plastic bottles market.
By End User: Generics Provide Volume; CDMOs Provide Velocity
Generic drug makers accounted for 33.92% of 2025 bottle consumption, equating to roughly USD 3.26 billion in the pharmaceutical plastic bottles market size. They procure commoditized HDPE and PP formats under two-year master service agreements that prize cost certainty. CDMOs, although smaller today, are scaling faster at 6.18% CAGR. They manage low-volume, high-mix biologics and rely on flex-cell molding islands rather than traditional high-cavitation tools, a profile that commands 30–40% higher margins. PCI Pharma’s recent expansion into digital serialization suites positions it to capture outsourced packaging inflows. Meanwhile, branded pharma prioritizes tamper-evident aesthetics, often specifying bespoke colorants approved via drug master files, a practice that entrenches long vendor relationships but keeps annual volume modest.
The growing complexity and compliance load favor Tier-1 suppliers with audited global footprints, ensuring that end-user segments converge on fewer trusted partners, subtly increasing concentration in the pharmaceutical plastic bottles industry.
Geography Analysis
North America led the pharmaceutical plastic bottles market with 39.55% share in 2025, thanks to entrenched manufacturing, regulatory rigor, and federal incentives that encourage onshoring. The U.S. FDA’s exacting approval pathway effectively filters out low-spec imports and rewards domestic cGMP facilities. Canada’s specialty fillers and Mexico’s cost-efficient molding plants play complementary roles, leveraging USMCA corridor logistics for quick-turn distribution.
Asia-Pacific, forecast to post a 7.05% CAGR, is the acceleration engine of the pharmaceutical plastic bottles market. China’s extended National Essential Drugs List is swelling liquid antibiotic production, while India’s generics powerhouse status fuels HDPE bottle usage. ASEAN states are harmonizing GMP standards under the Pharmaceutical Product Working Group, facilitating intra-regional contract packaging. Japan and South Korea, though smaller in volume, lead in high-precision nasal devices and smart closures that feed global evidence of concept demand.
Europe remains a pivotal but cost-challenged arena. Plastic tax surcharges levied in Germany, Italy, and Spain dampen margins, yet they also propel early adoption of chemically recycled PET. The United Kingdom’s dual-regime reality after Brexit necessitates parallel regulatory filings, increasing administrative overhead. Eastern European converters, especially in Poland and Hungary, are courting Western CDMOs with lower labor rates and EU-wide quality certifications, keeping the pharmaceutical plastic bottles market competitive within the bloc.
South America’s momentum centers on Brazil’s ANVISA-mandated serialization, which is driving capex across filling and packaging lines. The Middle East & Africa show nascent but rising demand; Saudi Arabia’s Vision 2030 localization agenda is subsidizing sterile packaging parks, hoping to curb import reliance. Collectively, these emerging regions represent diversification hedges for global vendors confronting mature-market saturation.
Mordor Intelligence provides coverage of the pharmaceutical plastic bottles market across other key regional markets, including North America, Asia, Latin America, Europe, and Middle East and Africa, each with their regulatory frameworks and demand patterns.

Competitive Landscape
Moderate fragmentation defines today’s pharmaceutical plastic bottles market, but the consolidation drumbeat grows louder. Amcor’s absorption of Berry Global in April 2025 created a USD 24 billion revenue giant wielding unrivaled resin buying power and multi-technology capability. Synergies target USD 650 million, much of which arises from network optimization across 250+ plants. Competitors such as Gerresheimer accelerate European PET recycling projects while reinforcing glass leadership to hedge material bets. AptarGroup strengthens moat around patented dual-function closures, recording double-digit growth in its Pharma division after FDA clearance of neffy nasal spray components.
Fierce differentiation now rests on three vectors: serialization readiness, recyclate integration, and device-level innovation. Start-ups integrating IoT sensors commandeer the smart-pack niche, partnering with CDMOs for rapid market entry. Conversely, smaller regional blow molders lacking capital for 2D-matrix coding upgrades face acquisition or exit. Intellectual-property filings rose 12% in 2024, dominated by barrier-layer chemistry and tamper-evident indicators, underscoring a pivot from pure-play commodity bottles to function-rich solutions. The pharmaceutical plastic bottles industry is thus drifting toward an oligopoly where scale and science converge.
Pharmaceutical Plastic Bottles Industry Leaders
-
Amcor plc
-
Gerresheimer AG
-
AptarGroup, Inc. (Aptar Pharma)
-
O.Berk Company LLC
-
Alpha Packaging, Inc.
- *Disclaimer: Major Players sorted in no particular order

Recent Industry Developments
- April 2025: Amcor completed its merger with Berry Global, unlocking USD 650 million in projected synergies and a broad multi-material footprint.
- March 2025: AptarGroup secured FDA approval for its neffy nasal spray system, opening a new epinephrine administration pathway.
- February 2025: Gerresheimer committed EUR 50 million (USD 53.5 million) to expand European pharma-grade PET and HDPE capacity.
- January 2025: Alpha Packaging bought Pro-Pac Packaging for USD 85 million to deepen its Asia-Pacific pharmaceutical bottle presence.


Global Pharmaceutical Plastic Bottles Market Report Scope
As plastic bottles are lightweight and easier to handle, the adoption of these bottles is growing. Manufacturers prefer the use of plastic bottles due to lower costs of production and a variety of innovations that can occur. Since they will be used in the pharmaceutical industry, they will be made keeping in mind the environmental issues and hazardous effects. The Pharmaceutical Plastic Bottles Market is segmented By Raw Material (Polyethylene Terephthalate, Poly Propylene, Low-density Poly Ethylene, High-density Poly Ethylene), By Type (Solid Containers, Dropper Bottles, Nasal Spray Bottles, Liquid Bottles, Oral Care), and Geography.
| Polyethylene Terephthalate (PET) |
| High-Density Polyethylene (HDPE) |
| Low-Density Polyethylene (LDPE) |
| Polypropylene (PP) |
| Other Raw Materials |
| Solid Oral Containers |
| Dropper Bottles |
| Nasal Spray Bottles |
| Liquid Syrup Bottles |
| Oral-Care Rinse Bottles |
| ≤30 ml |
| 31 – 100 ml |
| 101 – 250 ml |
| 251 – 500 ml |
| >500 ml |
| Branded Pharmaceutical Manufacturers |
| Generic Drug Manufacturers |
| Contract Development and Manufacturing Organizations (CDMOs) |
| Over-the-Counter (OTC) Product Companies |
| North America | United States | |
| Canada | ||
| Mexico | ||
| South America | Brazil | |
| Argentina | ||
| Rest of South America | ||
| Europe | United Kingdom | |
| Germany | ||
| France | ||
| Spain | ||
| Italy | ||
| Rest of Europe | ||
| Asia-Pacific | China | |
| India | ||
| Japan | ||
| Australia | ||
| South Korea | ||
| Rest of Asia-Pacific | ||
| Middle East and Africa | Middle East | Saudi Arabia |
| United Arab Emirates | ||
| Turkey | ||
| Rest of Middle East | ||
| Africa | South Africa | |
| Kenya | ||
| Rest of Africa | ||
| By Raw Material | Polyethylene Terephthalate (PET) | ||
| High-Density Polyethylene (HDPE) | |||
| Low-Density Polyethylene (LDPE) | |||
| Polypropylene (PP) | |||
| Other Raw Materials | |||
| By Bottle Type | Solid Oral Containers | ||
| Dropper Bottles | |||
| Nasal Spray Bottles | |||
| Liquid Syrup Bottles | |||
| Oral-Care Rinse Bottles | |||
| By Capacity | ≤30 ml | ||
| 31 – 100 ml | |||
| 101 – 250 ml | |||
| 251 – 500 ml | |||
| >500 ml | |||
| By End User | Branded Pharmaceutical Manufacturers | ||
| Generic Drug Manufacturers | |||
| Contract Development and Manufacturing Organizations (CDMOs) | |||
| Over-the-Counter (OTC) Product Companies | |||
| By Geography | North America | United States | |
| Canada | |||
| Mexico | |||
| South America | Brazil | ||
| Argentina | |||
| Rest of South America | |||
| Europe | United Kingdom | ||
| Germany | |||
| France | |||
| Spain | |||
| Italy | |||
| Rest of Europe | |||
| Asia-Pacific | China | ||
| India | |||
| Japan | |||
| Australia | |||
| South Korea | |||
| Rest of Asia-Pacific | |||
| Middle East and Africa | Middle East | Saudi Arabia | |
| United Arab Emirates | |||
| Turkey | |||
| Rest of Middle East | |||
| Africa | South Africa | ||
| Kenya | |||
| Rest of Africa | |||


Key Questions Answered in the Report
What is the current value of the pharmaceutical plastic bottles market?
The pharmaceutical plastic bottles market size is USD 9.98 billion in 2026.
Which material leads usage in pharma bottle production?
HDPE holds the largest share at 38.02% in 2025.
Which region is growing fastest for pharmaceutical plastic bottles?
Asia-Pacific is advancing at a 7.05% CAGR through 2031.
Why are nasal spray bottles gaining traction?
Intranasal delivery offers rapid onset and improved adherence, leading to a 5.44% CAGR for nasal spray bottles.
How are sustainability rules influencing bottle design?
European plastic taxes and FDA purity standards push adoption of chemically recycled PET and lighter-weight formats.
What impact did the Amcor–Berry Global merger have?
The deal created a packaging leader expecting USD 650 million in synergies, reshaping competitive dynamics.
Page last updated on:


