Asia-Pacific Dog Food Market Size and Share
Market Overview
| Study Period | 2018 - 2031 |
|---|---|
| Forecast Data Period | 2026 - 2031 |
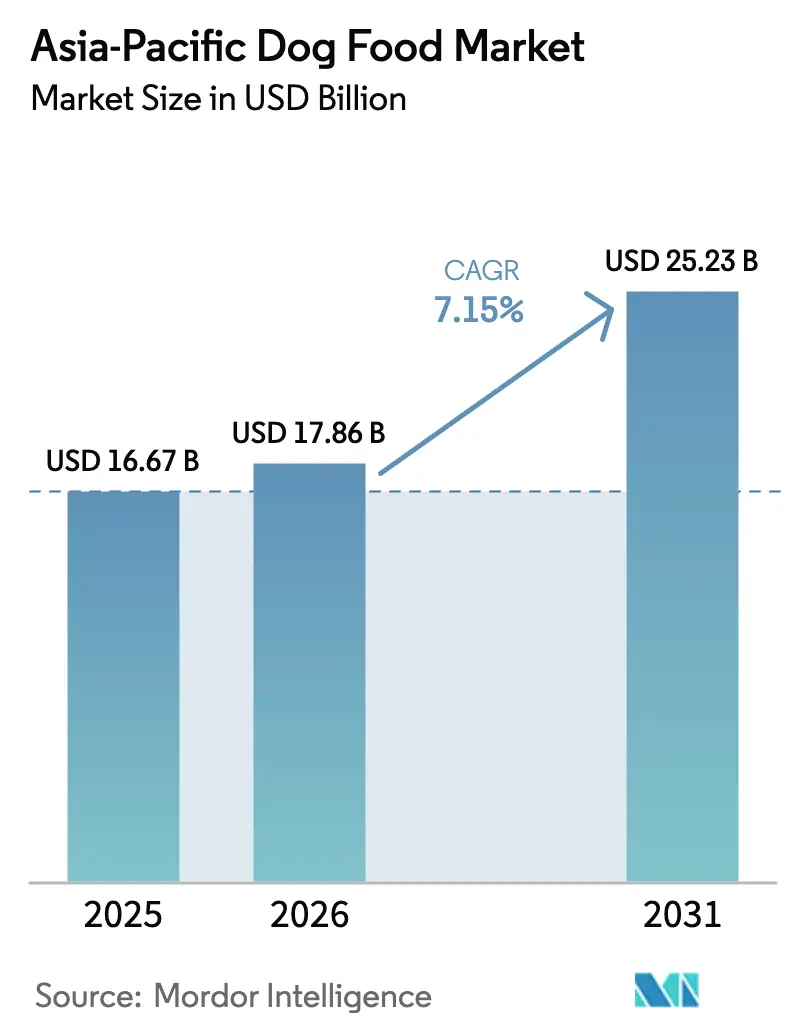
| Base Year Market Size (2025) | USD 16.67 Billion |
| Market Size (2026) | USD 17.86 Billion |
| Market Size (2031) | USD 25.23 Billion |
| Growth Rate (2026 - 2031) | 7.15% CAGR |
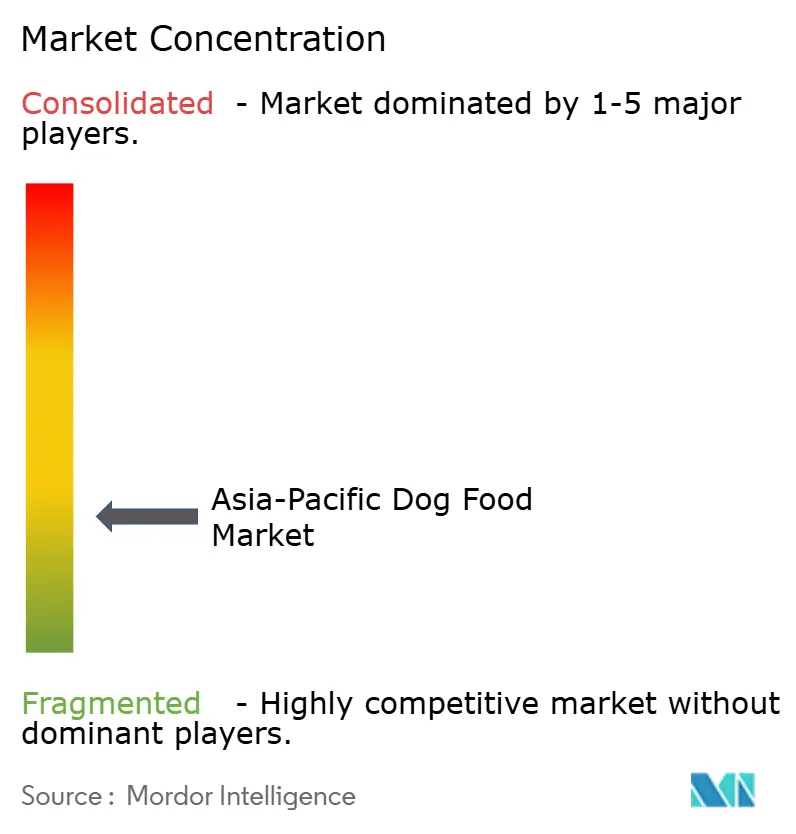
| Market Concentration | Low |
Major Players *Disclaimer: Major Players sorted in no particular order Image © Mordor Intelligence. Reuse requires attribution under CC BY 4.0. | |
Asia-Pacific Dog Food Market Analysis by Mordor Intelligence
The Asia-Pacific dog food market size was valued at USD 16.67 billion in 2025 and estimated to grow from USD 17.86 billion in 2026 to reach USD 25.23 billion by 2031, at a CAGR of 7.15% during the forecast period (2026-2031). The Asia-Pacific dog food market is gaining momentum from rapid pet humanization, premiumization trends, and the region’s expanding urban middle class. Demand focuses on dry kibble for its convenience, while wet formats and functional recipes cater to growing health concerns. Multinational manufacturers face stiff competition from agile domestic players leveraging digital channels, localized flavors, and alternative proteins. Policymaker incentives for local production and the expansion of cross-border logistics further stimulate the Asia-Pacific dog food market, even as swings in raw material costs and regulatory barriers temper profit margins.
Key Report Takeaways
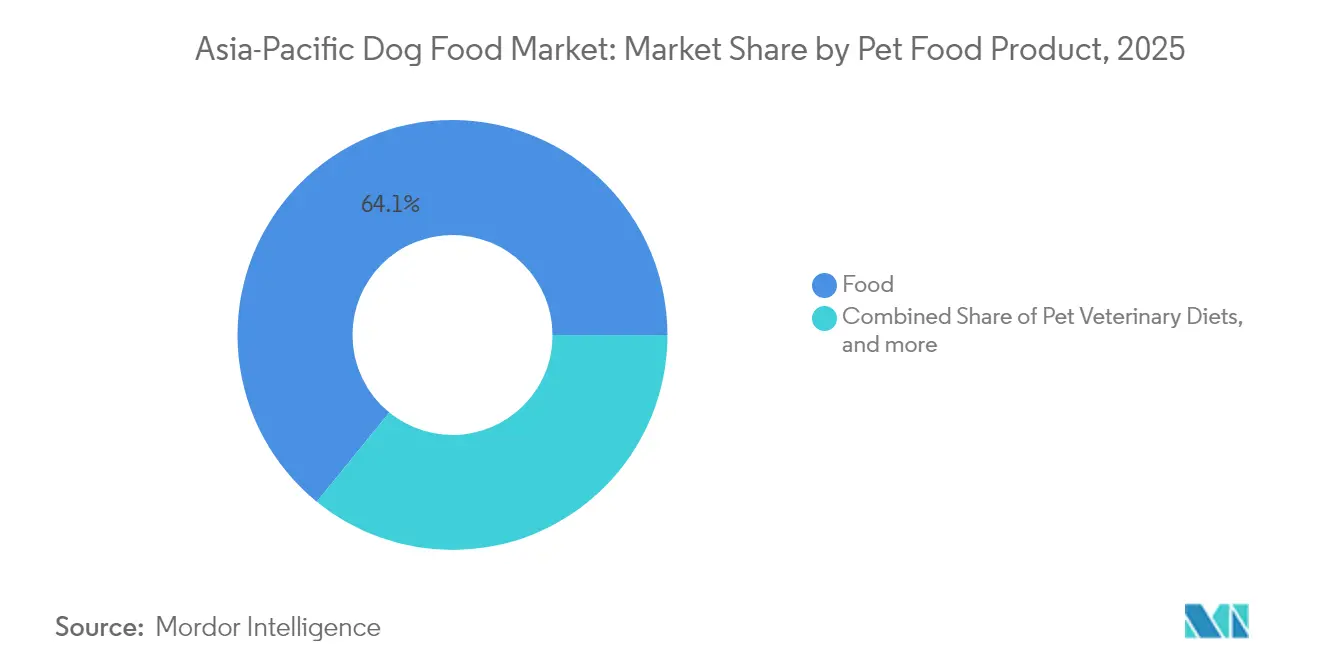
- By pet food product, food commanded 64.12% of the Asia-Pacific dog food market share in 2025 and is projected to advance at an 8.05% CAGR through 2031.
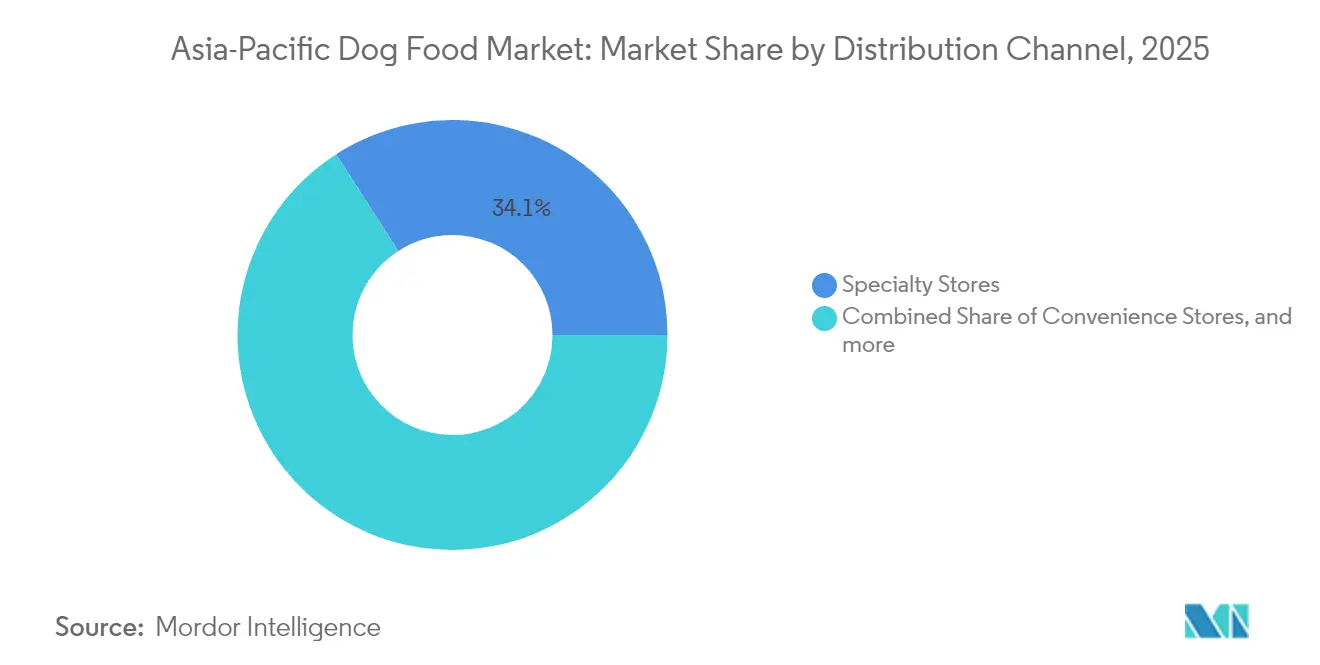
- By distribution channel, specialty stores led with a 34.10% revenue share in 2025, while convenience stores are projected to advance at a 9.55% CAGR to 2031.
- By country, China held 31.45% of the Asia-Pacific dog food market size in 2025; the Philippines is forecast to expand at a 11.58% CAGR between 2026 and 2031.
- Mars, Incorporated, Nestlé (Purina), General Mills Inc., Drools Pet Food Pvt. Ltd., and Hill’s Pet Nutrition collectively captured 20.3% of the revenue in 2024, underscoring a relatively low market share.
Note: Market size and forecast figures in this report are generated using Mordor Intelligence’s proprietary estimation framework, updated with the latest available data and insights as of 2026.
Asia-Pacific Dog Food Market Trends and Insights
Drivers Impact Analysis*
| Driver | (~) % Impact on CAGR Forecast | Geographic Relevance | Impact Timeline |
|---|---|---|---|
| Premiumization and Human-grade Ingredient Adoption | +2.1% | Global, strongest in China, Japan, South Korea | Medium term (2-4 years) |
| Surge in Online-to-Offline (O2O) Pet-Care Platforms | +1.8% | China, Southeast Asia core, spill-over to India | Short term (≤ 2 years) |
| Urban Middle-class Dog Ownership Growth | +1.5% | APAC urban centers, early gains in Manila, Bangkok, Jakarta | Long term (≥ 4 years) |
| Functional Formulations for Breed-specific Health Needs | +1.2% | Japan, Australia, expanding to China and India | Medium term (2-4 years) |
| Government Incentives for Domestic Pet-food Manufacturing | +0.9% | Thailand, Malaysia, Philippines, Vietnam | Medium term (2-4 years) |
| Expansion of Cross-border E-commerce Logistics | +0.6% | Global, with early gains in Singapore, Hong Kong | Short term (≤ 2 years) |
| Source: Mordor Intelligence | |||
Premiumization and Human-Grade Ingredient Adoption
Humanization elevates pet diets to household food standards across the Asia-Pacific dog food market. In China, 49% of owners now prioritize labels with all-natural ingredients, while 45% indicate an intention to make repeat purchases for personalized formulas in 2024. Mars Petcare partnered with Big Idea Ventures to sponsor regional startups developing human-grade and sustainable ingredients. Thai producer Betagro expanded its Lopburi capacity and introduced Perfecta Holistic Grain Free recipes, featuring fresh meat as the primary ingredient. Premium buyers also value packaging sustainability; surveys show willingness to pay more for carbon-neutral dog food. ISO 22000 and HACCP certification have become the baseline for high-end lines in Japan and Australia, intensifying product quality competition.
Surge in Online-to-Offline Pet-Care Platforms
Digital retail reshapes every layer of the Asia-Pacific dog food market. E-commerce already accounts for roughly 50% of Chinese sales, and brand-owned flagship stores dominate the platform charts. Nestlé Purina achieved double-digit growth in Greater China in 2024, driven by an aggressive online promotion of Pro Plan. Shopee and TikTok enable small Philippine and Indonesian brands to enter cross-border markets at a low cost[1]Source: Chen Zhenzhi, “Shanxi Securities Pet Food Special Report,” shanxisecurities.com. Royal Canin India’s partnership with GekkoVet demonstrates O2O’s reach beyond sales into veterinary telemedicine and digital diagnostics. Supply-side players respond as AFB International anchors Asia-Pacific headquarters in Thailand to shorten e-commerce fulfillment cycles. Compliance demands range from data privacy statutes to diverse cross-border payment rules across more than 15 jurisdictions in the Asia-Pacific region.
Urban Middle-Class Dog Ownership Growth
Rising disposable income, aging populations, and shrinking household sizes underpin steady growth in the Asia-Pacific dog food market. China’s urban dog population climbed from 50.85 million in 2021 to 51.75 million in 2023, while pet owners jumped to 70.43 million[2]Source: Wei Hongmei, “Pet Food Industry Deep-Dive Report: Market Expansion and Domestic Rise,” dongguansecurities.com. Philippine pet food imports increased, reflecting the booming pet ownership market. Taiwan reports an average annual expenditure of USD 891 per pet, with food accounting for 41% of the budget in 2024. South Korea is subsidizing the adoption of pet insurance to support its 7.2 million pet owners. Municipal licensing schemes, from Shanghai to Sydney, standardize pet registration and vaccination, thereby strengthening data collection that guides policymaking and product innovation.
Functional Formulations for Breed-Specific Health Needs
Scientific advances in nutrition drive demand for specialized dog food formulations targeting specific health conditions and breed characteristics across Asia-Pacific markets. Prescription veterinary diets demonstrate sophisticated market development in India, with brands like Farmina VetLife, Royal Canin Veterinary Diet, and Vivaldis offering specialized formulations for hepatic, renal, gastrointestinal, and hypoallergenic conditions at premium price points. Veolia Bioconversion Malaysia secured EU TRACES certification for insect meal exports, widening the functional-protein pool. Veterinary-exclusive SKUs command premium shelf prices, although licensing rules for therapeutic formulas vary sharply between Australia, Japan, and Indonesia.
Restraints Impact Analysis*
| Restraint | (~) % Impact on CAGR Forecast | Geographic Relevance | Impact Timeline |
|---|---|---|---|
| Price Volatility of Meat-based Raw Materials | -1.4% | Global, acute impact in import-dependent markets | Short term (≤ 2 years) |
| Stringent Novel Protein Import Regulations | -0.8% | China, Japan, Australia regulatory frameworks | Long term (≥ 4 years) |
| Intensifying Competition from Fresh Home-cooked Dog Meals | -0.6% | Urban China, Japan, South Korea | Medium term (2-4 years) |
| Supply-chain Disruptions from Regional Geopolitical Tensions | -0.5% | Cross-border trade corridors, shipping routes | Short term (≤ 2 years) |
| Source: Mordor Intelligence | |||
Price Volatility of Meat-Based Raw Materials
The Asia-Pacific dog food market is facing cost spikes for chicken meal, lamb, and fish oil due to trade-policy shifts and disease outbreaks. Import-dependent markets such as Japan paid 22% more for rendered chicken fat in 2024 than in 2023. Australian droughts cut beef-trimming exports, while Brazil’s shipping bottlenecks raised freight costs to Southeast Asia. Manufacturers hedge their risks with long-term contracts, plant protein substitution, and process yield optimization. Yet frequent price reviews strain retailer relations and erode consumer trust in stable shelf pricing.
Stringent Novel-Protein Import Regulations
China’s Ministry of Agriculture continues to restrict insect and cultured proteins to pilot projects, delaying mass-market rollouts. Australia’s feed-ingredient code mandates exhaustive allergen and biosecurity dossiers for non-traditional proteins, prolonging approval cycles to 18 months. Japanese regulators demand double-blind digestibility trials for alternative proteins, inflating R&D budgets. These barriers slow differentiation and may limit the Asia-Pacific dog food market’s shift toward sustainable formulations.
*Our forecasts treat driver/restraint impacts as directional, not additive. The impact forecasts reflect baseline growth, mix effects, and variable interactions.
Segment Analysis
By Pet Food Product: Food retains core supremacy
Food accounted for 64.12% of the Asia-Pacific dog food market share in 2025 and is projected to grow at an 8.05% CAGR through 2031. Dry kibble accounted for nearly high share of the food volume due to its affordability and ease of storage, whereas wet meals captured taste-driven households and senior dog segments. Freeze-dried powders and air-dried strips broaden premium positioning with high meat inclusions. The Asia-Pacific dog food market size for veterinary diets is forecast to reach high by 2030, propelled by dermatologist-directed kibble for atopic breeds. Supplements enriched with omega-3, glucosamine, and probiotics bridge preventive-care gaps, bolstering cross-selling in Japan and Australia. Regulatory pathways require separate registration for functional add-ons, which extends commercialization timelines.
In second-tier cities, demand tilts toward mid-range dry formulas that mimic premium features, such as joint-support claims, yet remain price-competitive. Ingredient localization strategies—such as Thai jasmine-rice carbohydrates or New Zealand grass-fed lamb proteins differentiate SKUs and reduce freight costs. Multinationals embed R&D labs in Shanghai and Bangkok to accelerate the development of prototypes with native flavors. Domestic champions leverage agile co-manufacturing to rotate seasonal recipes, deepening user engagement in the Asia-Pacific dog food market.


By Distribution Channel: Specialty maintains authority, convenience rises
Specialty pet retailers accounted for 34.10% of the Asia-Pacific dog food market size in 2025, prized for their expert advice and curated shelves that justify premium price tags. Yet, the Asia-Pacific dog food market size through convenience stores is projected to increase significantly at a 9.55% CAGR to 2031, due to late-night urban shopping patterns and micro-format outlets inside subway stations. Online pure players post the highest SKU depth, but omnichannel loyalty programs by brick-and-mortar chains narrow the gap. High-growth micro-fulfillment centers cut last-mile costs for bulky kibble shipments under 10 kg.
In emerging economies like Vietnam and Indonesia, mom-and-pop stores still anchor rural distribution. Brand owners run community vet-clinic pop-ups to educate and upsell. Subscription services offering monthly deliveries of 5 kg sacks reduce stock-out risk and collect data that refine personalization algorithms. Regulatory requirements for feed safety labeling online mirror those for offline rules, and ASEAN harmonization efforts may soon standardize declarations.
Geography Analysis
China commanded 31.45% of the Asia-Pacific dog food market size in 2025, underpinned by double-digit e-commerce penetration and policy support for domestic brands. Digital ecosystems on Tmall accelerate innovation cycles, with hundreds of private-label SKUs launched monthly. The Ministry of Agriculture’s licensing clampdown resulted in the weeding out of more than 300 small processors, thereby boosting consumer confidence.
Regulatory frameworks implemented by the Ministry of Agriculture and Rural Affairs in industry entry thresholds while supporting qualified domestic producers through streamlined licensing processes. The Philippines is forecast to expand at a 11.58% CAGR between 2026 and 2031. Imports increased annually from 2020-2024, reaching 176 million kg worth. Mars holds one-third share, but upstarts such as TopBreed gain ground by pricing 15% lower. Government feed-mill grants aim to trim the nation’s dog-food trade deficit by 2028, reshaping supply dynamics within the Asia-Pacific dog food market. Japan and Australia are among the mature pet economies. Japan’s aging demographic values therapeutic foods, pushing veterinary-diet penetration to retail value. Australia leans on premium wet formats; co-manufacturing deals in New Zealand and domestic ocean freight shorten supply chains. Southeast Asia particularly Thailand, Indonesia, and Vietnam logs 8%-plus growth as middle-class formation meets supportive agro-industrial policies. India’s sizeable canine base is still under-monetized, but initiatives like Drools’ USD 30 million vet-clinic expansion could unlock latent demand.
Competitive Landscape
Mars, Incorporated, Nestlé (Purina), General Mills Inc., Drools Pet Food Pvt. Ltd., and Hill’s Pet Nutrition collectively captured 20.3% of the revenue in 2024, underscoring a relatively low market share. They lead through brand heritage, multi-format portfolios, and extensive R&D. Still, their collective share in China slipped in 2021 as local outfits captured digital shelf space. Mars’ USD 138 million Tianjin plant attests to renewed localization efforts.
Domestic challengers differentiate on local ingredient narratives and lower price points. Chinese label NatureBridge markets sea-cucumber-infused kibble, while Thailand’s i-Tail expands premium wet-food capacity by 18.7% via a new Samut Sakhon facility. Technology is a battleground: AI-driven diet personalizers and 3D-printed treats are no longer prototypes but early commercial offerings. Veolia Bioconversion’s EU-certified insect meal enhances the sustainability positioning of brand partners across Malaysia and Singapore.
Strategic alliances bloom. Mars and Big Idea Ventures are funding Asia-Pacific startups that explore cell-based chicken and fermented mycoproteins. Nestlé Purina ties with China’s Alibaba Cloud to apply machine learning to pet-owner datasets. Hill’s collaborates with Korean vet chains to pilot subscription oncology diets. Licensing and HACCP compliance often dictate partnership choices, as smaller firms lean on large players’ regulatory muscle to export.
Asia-Pacific Dog Food Industry Leaders
Colgate-Palmolive Company (Hill's Pet Nutrition Inc.)
General Mills Inc.
Mars Incorporated
Nestle (Purina)
Drools Pet Food Pvt. Ltd.
- *Disclaimer: Major Players sorted in no particular order

Recent Industry Developments
- May 2024: Mars Petcare has completed the production ramp-up at its USD 138 million facility in Tianjin, China, achieving an annual capacity of over 250,000 metric tons for dry, wet, and treat production, with dedicated R&D capabilities to serve the Greater China and export markets.
- July 2023: Hill's Pet Nutrition introduced its new MSC (Marine Stewardship Council) certified pollock and insect protein products for pets with sensitive stomachs and skin lines. They contain vitamins, omega-3 fatty acids, and antioxidants.
- April 2023: Mars Incorporated opened its first pet food research and development center in the Asia-Pacific region. This new facility, known as the Asia-Pacific pet center, will support the company's product development efforts.


Asia-Pacific Dog Food Market Report Scope
Food, Pet Nutraceuticals/Supplements, Pet Treats, Pet Veterinary Diets are covered as segments by Pet Food Product. Convenience Stores, Online Channel, Specialty Stores, Supermarkets/Hypermarkets are covered as segments by Distribution Channel. Australia, China, India, Indonesia, Japan, Malaysia, Philippines, Taiwan, Thailand, Vietnam are covered as segments by Country.
| Food | By Sub Product | Dry Pet Food | By Sub Dry Pet Food | Kibbles |
| Other Dry Pet Food | ||||
| Wet Pet Food | ||||
| Pet Nutraceuticals/Supplements | By Sub Product | Milk Bioactives | ||
| Omega-3 Fatty Acids | ||||
| Probiotics | ||||
| Proteins and Peptides | ||||
| Vitamins and Minerals | ||||
| Other Nutraceuticals | ||||
| Pet Treats | By Sub Product | Crunchy Treats | ||
| Dental Treats | ||||
| Freeze-dried and Jerky Treats | ||||
| Soft and Chewy Treats | ||||
| Other Treats | ||||
| Pet Veterinary Diets | By Sub Product | Derma Diets | ||
| Diabetes | ||||
| Digestive Sensitivity | ||||
| Obesity Diets | ||||
| Oral Care Diets | ||||
| Renal | ||||
| Urinary tract disease | ||||
| Other Veterinary Diets |
| Convenience Stores |
| Online Channel |
| Specialty Stores |
| Supermarkets/Hypermarkets |
| Other Channels |
| Australia |
| China |
| India |
| Indonesia |
| Japan |
| Malaysia |
| Philippines |
| Taiwan |
| Thailand |
| Vietnam |
| Rest of Asia-Pacific |
| By Pet Food Product | Food | By Sub Product | Dry Pet Food | By Sub Dry Pet Food | Kibbles |
| Other Dry Pet Food | |||||
| Wet Pet Food | |||||
| Pet Nutraceuticals/Supplements | By Sub Product | Milk Bioactives | |||
| Omega-3 Fatty Acids | |||||
| Probiotics | |||||
| Proteins and Peptides | |||||
| Vitamins and Minerals | |||||
| Other Nutraceuticals | |||||
| Pet Treats | By Sub Product | Crunchy Treats | |||
| Dental Treats | |||||
| Freeze-dried and Jerky Treats | |||||
| Soft and Chewy Treats | |||||
| Other Treats | |||||
| Pet Veterinary Diets | By Sub Product | Derma Diets | |||
| Diabetes | |||||
| Digestive Sensitivity | |||||
| Obesity Diets | |||||
| Oral Care Diets | |||||
| Renal | |||||
| Urinary tract disease | |||||
| Other Veterinary Diets | |||||
| By Distribution Channel | Convenience Stores | ||||
| Online Channel | |||||
| Specialty Stores | |||||
| Supermarkets/Hypermarkets | |||||
| Other Channels | |||||
| By Country | Australia | ||||
| China | |||||
| India | |||||
| Indonesia | |||||
| Japan | |||||
| Malaysia | |||||
| Philippines | |||||
| Taiwan | |||||
| Thailand | |||||
| Vietnam | |||||
| Rest of Asia-Pacific | |||||


Market Definition
- FUNCTIONS - Pet foods are usually intended to provide complete and balanced nutrition to the pet but are primarily used as functional products. The scope includes the food and supplements consumed by pets including veterinary diets. Supplements/nutraceuticals that are directly supplied to pets are considered within the scope.
- RESELLERS - Companies engaged in reselling of pet food without value addition have been excluded from the market scope, in order to avoid double counting.
- END CONSUMERS - Pet owners are considered to be the end-consumers in the market studied.
- DISTRIBUTION CHANNELS - Supermarkets/hypermarkets, specialty stores, convenience stores, online channels and other channels are considered within the scope. The stores which are exclusively providing pet related basic and custom products are considered within the scope of specialty stores.
| Keyword | Definition |
|---|---|
| Pet Food | The scope of pet food includes the food that is eatable by pets including food, treats, veterinary diets, and nutraceuticals/supplements. |
| Food | Food is animal feed intended for consumption by pets. It is formulated to provide essential nutrients and meet the dietary needs of various types of pets, including dogs, cats, and other animals. These are generally segmented into dry and wet pet foods. |
| Dry Pet Food | Dry pet foods may be extruded/baked (kibbles) or flaked. They have a lower moisture content, typically around 12-20%. |
| Wet Pet Food | Wet pet food, also known as canned pet food or moist pet food, generally has a higher moisture content compared to dry pet food, often ranging from 70-80%. |
| Kibbles | Kibbles are dry, processed pet food in small, bite-sized pieces or pellets. They are specifically formulated to provide balanced nutrition for various domestic animals, such as dogs, cats, and other animals. |
| Treats | Pet Treats are special food items or rewards given to pets, to show affection, and encourage good behavior. They are especially used during training. Pet treats are made from various combinations of meat or meat-derived materials with other ingredients. |
| Dental Treats | Pet dental treats are specialized treats that are formulated to promote good oral hygiene in pets. |
| Crunchy Treats | It is a type of pet treat that has a firm and crispy texture which can be a good source of nutrition for pets. |
| Soft and chewy treats | Soft and Chewy pet treats are a type of pet food product that is formulated to be easy to chewy and digest. They are usually made from soft and pliable ingredients, such as meat, poultry, or vegetables, that have been blended and formed into bite-sized pieces or strips. |
| Freeze-dried & Jerky Treats | Freeze-dried and jerky treats are snacks given to pets, that are prepared through a special preservation process, without damaging the nutritional content, resulting in long-lasting, nutrient-rich treats. |
| Urinary Tract Disease Diets | These are commercial diets that are specifically formulated to promote urinary health and reduce the risk of urinary tract infections and other urinary problems. |
| Renal Diets | These are specialized pet foods formulated to support the health of pets with kidney disease or renal insufficiency. |
| Digestive Sensitivity Diets | Digestive-sensitive diets are specially formulated to meet the nutritional needs of pets with digestive issues such as food intolerances, allergies, and sensitivities. These diets are designed to be easily digestible and to reduce the symptoms of digestive problems in pets. |
| Oral Care Diets | Oral care diets for pets are specially formulated diets produced to promote oral health and hygiene in pets. |
| Grain-Free Pet Food | Pet food that does not contain common grains like wheat, corn, or soy. Grain-free diets are often preferred by pet owners seeking alternative options or if their pets have specific dietary sensitivities. |
| Premium Pet Food | High-quality pet food formulated with superior ingredients often offers additional nutritional benefits compared to standard pet food. |
| Natural Pet Food | Pet food made from natural ingredients, with minimal processing and without artificial preservatives. |
| Organic Pet Food | Pet food is produced using organic ingredients, free from synthetic pesticides, hormones, and genetically modified organisms (GMOs). |
| Extrusion | A manufacturing process used to produce dry pet food, where ingredients are cooked, mixed, and shaped under high pressure and temperature. |
| Other Pets | Other pets include birds, fish, rabbits, hamsters, ferrets, and reptiles. |
| Palatability | The taste, texture, and aroma of pet food influence its appeal and acceptance by pets. |
| Complete and Balanced Pet Food | Pet food that provides all essential nutrients in appropriate proportions to meet the nutritional needs of pets without additional supplementation. |
| Preservatives | These are the substances that are added to pet food to extend its shelf life and prevent spoilage. |
| Nutraceuticals | Food products that offer health benefits beyond basic nutrition, often contain bioactive compounds with potential therapeutic effects. |
| Probiotics | Live beneficial bacteria that promote a healthy balance of gut flora, supporting digestive health and immune function in pets. |
| Antioxidants | Compounds that help neutralize harmful free radicals in the body, promoting cellular health and supporting the immune system in pets. |
| Shelf-Life | The duration of which pet food remains safe and nutritionally viable for consumption after its production date. |
| Prescription diet | Specialized pet food formulated to address specific medical conditions under veterinary supervision. |
| Allergen | A substance that can cause allergic reactions in some pets, leading to food allergies or sensitivities. |
| Canned food | Wet pet food that is packed in cans and contains higher moisture content than dry food. |
| Limited ingredient diet (LID) | Pet food formulated with a reduced number of ingredients to minimize potential allergens. |
| Guaranteed Analysis | The minimum or maximum levels of certain nutrients present in pet food. |
| Weight management | Pet food designed to help pets maintain a healthy weight or support weight loss efforts. |
| Other Nutraceuticals | It includes prebiotics, antioxidants, digestive fiber, enzymes, essential oils and herbs. |
| Other Veterinary Diets | It includes weight management diets, skin and coat health, cardiac care, and joint care. |
| Other Treats | It includes rawhides, mineral blocks, lickables, and catnips. |
| Other Dry Foods | It includes cereal flakes, mixers, meal toppers, freeze-dried foods, and air-dried foods. |
| Other Animals | It includes birds, fish, reptiles, and small animals (rabbits, ferrets, hamsters). |
| Other Distribution Channels | It includes veterinary clinics, local unregulated stores, and feed and farm stores. |
| Proteins and Peptides | Proteins are large molecules composed of basic units called amino acids which help in the growth and development of pets. Peptides are the short string of 2 to 50 amino acids. |
| Omega-3 fatty acids | Omega-3 fatty acids are essential polyunsaturated fats that play a crucial role in the overall health and well-being of Pets |
| Vitamins | Vitamins are the essential organic compounds that are essential for vital physiological functioning. |
| Minerals | Minerals are naturally occurring inorganic substances that are essential for various physiological functions in pets. |
| CKD | Chronic Kidney Disease |
| DHA | Docosahexaenoic Acid |
| EPA | Eicosapentaenoic Acid |
| ALA | Alpha-linolenic Acid |
| BHA | Butylated Hydroxyanisol |
| BHT | Butylated Hydroxytoluene |
| FLUTD | Feline Lower Urinary Tract Disease |


Research Methodology
Mordor Intelligence follows a four-step methodology in all our reports.
- Step-1: IDENTIFY KEY VARIABLES: In order to build a robust forecasting methodology, the variables and factors identified in Step-1 are tested against available historical market numbers. Through an iterative process, the variables required for market forecast are set and the model is built on the basis of these variables.
- Step-2: Build a Market Model: Market-size estimations for the forecast years are in nominal terms. Inflation is not a part of the pricing, and the average selling price (ASP) is kept constant throughout the forecast period.
- Step-3: Validate and Finalize: In this important step, all market numbers, variables and analyst calls are validated through an extensive network of primary research experts from the market studied. The respondents are selected across levels and functions to generate a holistic picture of the market studied.
- Step-4: Research Outputs: Syndicated Reports, Custom Consulting Assignments, Databases & Subscription Platforms


