Asia-Pacific Cat Food Market Size and Share
Market Overview
| Study Period | 2018 - 2031 |
|---|---|
| Forecast Data Period | 2026 - 2031 |
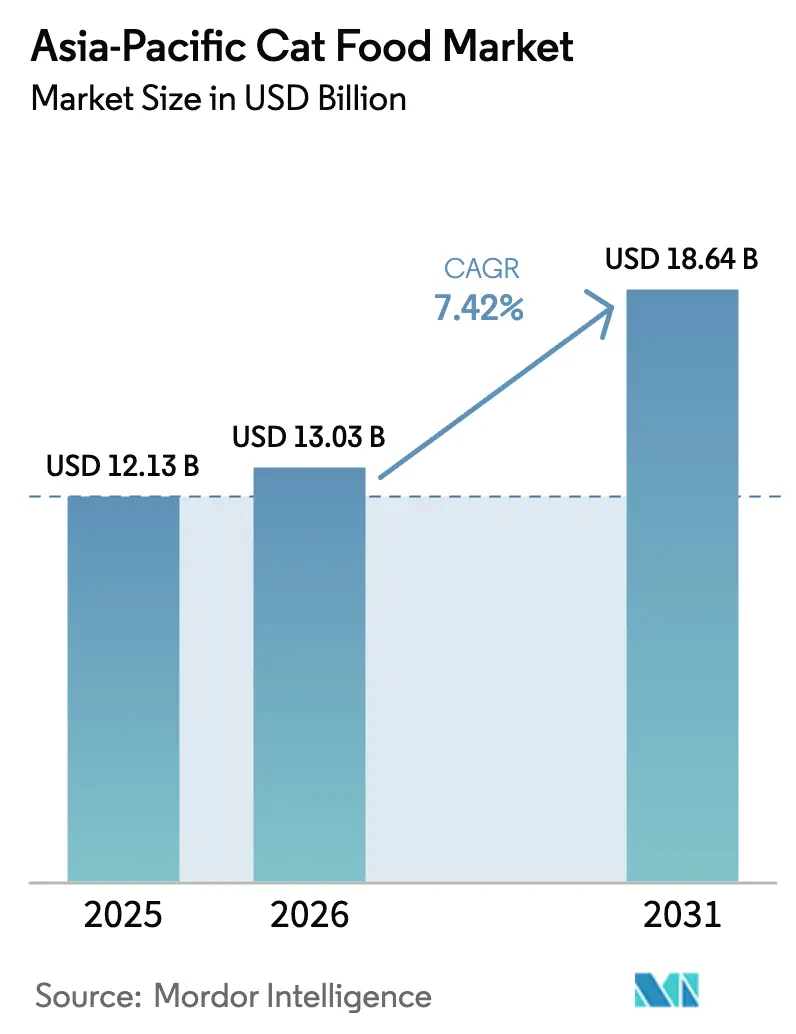
| Base Year Market Size (2025) | USD 12.13 Billion |
| Market Size (2026) | USD 13.03 Billion |
| Market Size (2031) | USD 18.64 Billion |
| Growth Rate (2026 - 2031) | 7.42% CAGR |
| Market Concentration | Low |
Major Players *Disclaimer: Major Players sorted in no particular order Image © Mordor Intelligence. Reuse requires attribution under CC BY 4.0. | |
Asia-Pacific Cat Food Market Analysis by Mordor Intelligence
The Asia-Pacific cat food market size is expected to grow from USD 12.13 billion in 2025 to USD 13.03 billion in 2026 and is forecast to reach USD 18.64 billion by 2031 at 7.42% CAGR over 2026-2031. Continued pet humanization, premium-price nutrition, and widening e-commerce access are sustaining this trajectory. China anchors growth through its large cat population and rapidly expanding premium segment, while India achieves double-digit volume gains driven by urbanization and income growth. Supply chains remain vulnerable to raw material price fluctuations, as evidenced by the 2024 price swings in fishmeal and fish oil, prompting manufacturers to hedge commodity risk. Specialty retailers still hold the largest share of the offline market, but online channels are scaling fastest as mobile shopping becomes more habitual, especially in China and Taiwan. Competitive intensity is low, with domestic Chinese brands having built a 40% online share, yet multinationals such as Mars, Incorporated and Nestlé S.A.(Purina) preserve leadership in premium and veterinary diets through strong R&D and brand equity.
Key Report Takeaways
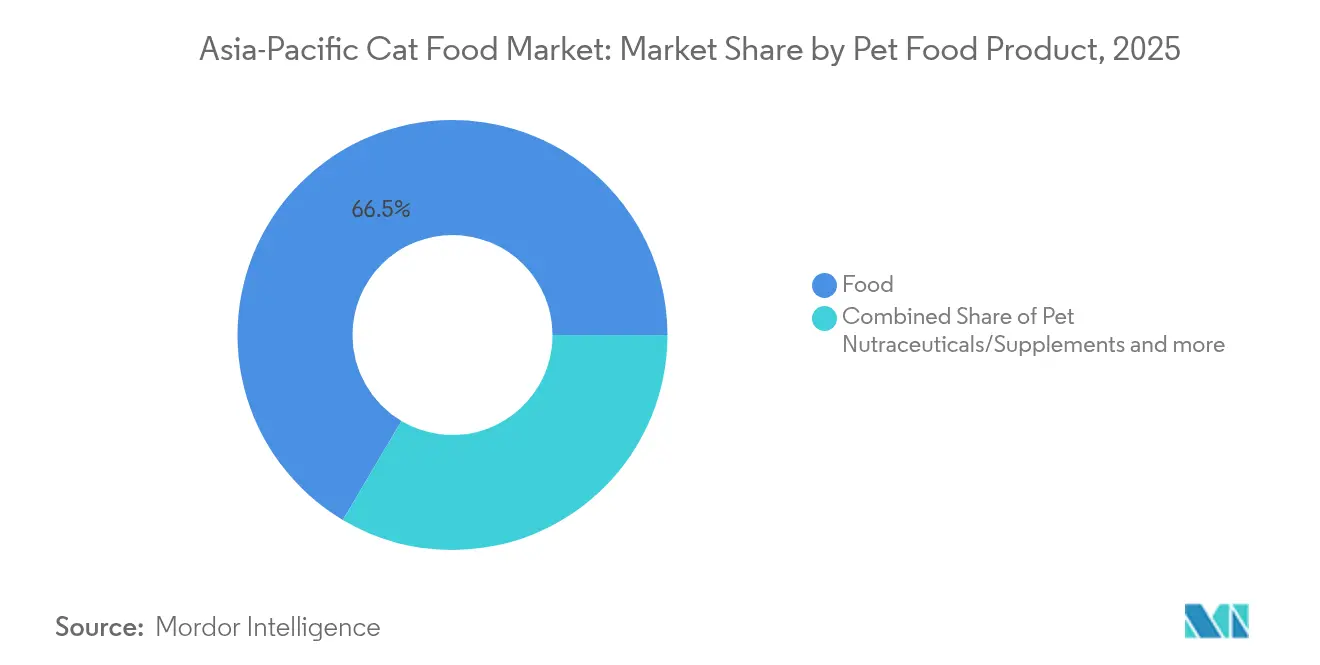
- By pet food product category, traditional food accounted for 66.48% of the Asia-Pacific cat food market share in 2025, while nutraceuticals and supplements are forecasted to expand at a 10.33% CAGR through 2031.
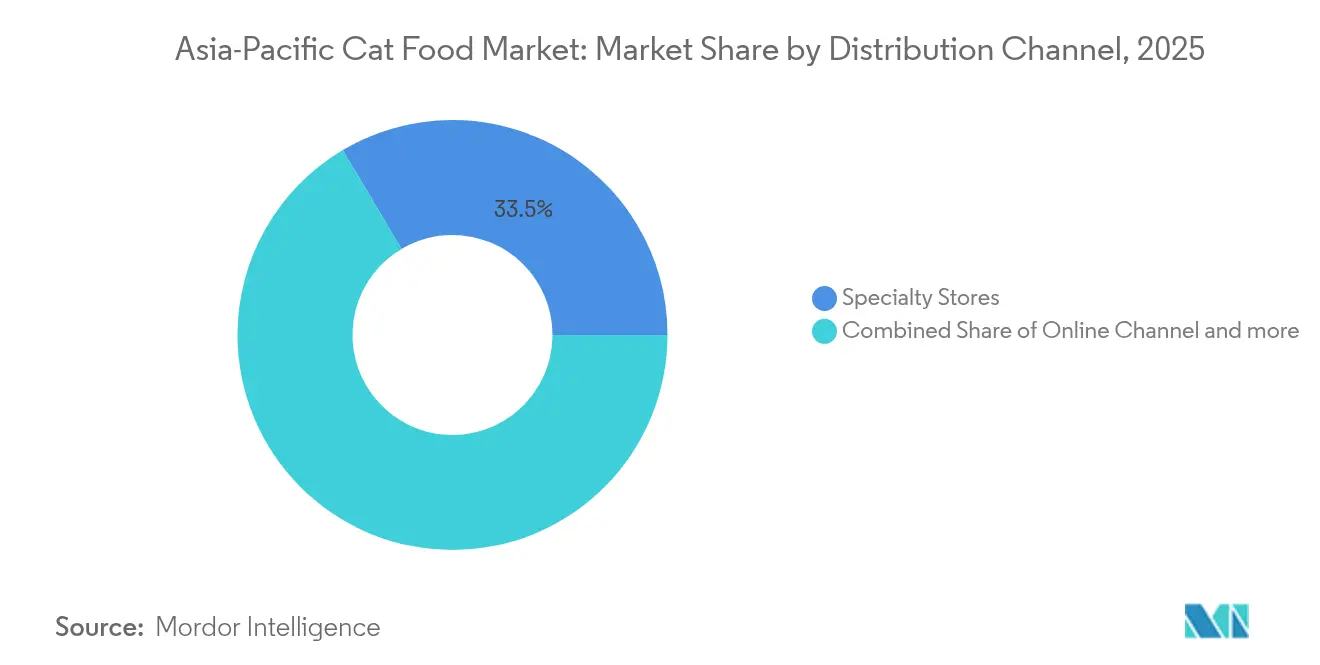
- By distribution channel, specialty stores led the Asia-Pacific cat food market with a 33.52% revenue share in 2025; online platforms are projected to advance at a 10.54% CAGR through 2031.
- By Country, China accounted for 40.12% of the Asia-Pacific cat food market size in 2025, and is projected to register a 10.08% CAGR from 2026 to 2031.
- Mars, Incorporated, Nestlé S.A. (Purina), General Mills Inc., ADM, and Hill’s Pet Nutrition collectively captured 13.78% of the revenue in 2025, with a fragmented landscape.
Note: Market size and forecast figures in this report are generated using Mordor Intelligence’s proprietary estimation framework, updated with the latest available data and insights as of 2026.
Asia-Pacific Cat Food Market Trends and Insights
Drivers Impact Analysis*
| Driver | (~) % Impact on CAGR Forecast | Geographic Relevance | Impact Timeline |
|---|---|---|---|
| Humanization-driven premiumization | +1.8% | Global, strongest in China, Japan, Australia | Medium term (2-4 years) |
| Rising middle-class disposable income | +1.5% | India, Southeast Asia core, spill-over to China tier-2 cities | Long term (≥ 4 years) |
| Expansion of e-commerce pet platforms | +1.2% | China, India, Southeast Asia | Short term (≤ 2 years) |
| Growing cat ownership in urban centers | +1.0% | Asia-Pacific urban centers, particularly India, China, Philippines | Medium term (2-4 years) |
| Shift toward single-serve sustainable pouches | +0.8% | Japan, Australia, urban China | Medium term (2-4 years) |
| Insect-protein farming initiatives | +0.5% | Australia, Thailand, early adoption in Singapore | Long term (≥ 4 years) |
| Source: Mordor Intelligence | |||
Humanization-Driven Premiumization
Premium positioning is redefining the Asia-Pacific cat food market as owners increasingly treat cats as family members. Chinese shoppers now allocate a rising share of discretionary spending to life-stage formulas containing probiotics and joint-care ingredients[1]Source: China Cooperation Trade Enterprises Association, “2025 China Pet Food Industry Report,” ccea.org.cn. In Japan, an aging pet population is spurring demand for senior and indoor diets. Australian buyers expect full ingredient transparency, with surveys showing 80% willing to pay extra for traceable sourcing. Price acceptance has widened with mid-to-high-end SKUs, priced at USD 21–36 per kilogram, and captured a significant share of China’s value sales in 2024. This premium tier also enjoys higher gross margins, helping manufacturers offset commodity price volatility and fund product innovation. As a result, the Asia-Pacific cat food market continues to introduce specialty SKUs, including hairball control, digestive support, and low-glycemic recipes.
Rising Middle-Class Disposable Income
Urban Asian households are allocating a greater portion of their income to pet care. Chinese cat owners spent an average of RMB 2,020 (approximately USD 285) per cat in 2024, representing a notable year-over-year increase. In India, salaried millennials in megacities view premium cat food as a convenient health assurance. Indonesia’s pet food imports recorded a high share between 2021 and 2024, underscoring a structural shift from table scraps to commercial products. Such consumption upgrades enhance the Asia-Pacific cat food market by expanding the buyer base for higher-value products. Even in the Philippines, the retail cat food value reached USD 10 million in 2024, growing 8.02% due to condominium living and a preference for smaller pets.
Expansion of E-Commerce Pet Platforms
Digital shopping is normalizing bulk and subscription purchasing. Online sales already represent a good share of China’s cat food turnover and exceed that in Taiwan. Marketplace algorithms recommend complementary treats and litter, thus lifting basket sizes and retention rates. Short-video platforms have emerged as formidable sales channels by pairing influencer content with instant checkout facilities. For brands, direct-to-consumer models improve gross margin capture and yield first-party data for product refinement. As connectivity deepens, the Asia-Pacific cat food market is expected to continue shifting toward virtual shelves, compressing the role of traditional wholesalers.
Growing Cat Ownership in Urban Centers
Space constraints and lifestyle compatibility are making cats increasingly popular in Asia’s dense cities. Indian metropolitan areas witness increasing cat adoption among young professionals, driven by apartment living suitability and lower maintenance requirements. Urban lifestyle compatibility positions cats as preferred pets for space-constrained environments, creating sustained demand growth independent of overall pet market expansion. The Philippines and Vietnam also register above-market growth in urban cat adoptions, driven by apartment living and lower maintenance costs. Rising ownership underpins baseline volume growth in the Asia-Pacific cat food market, creating predictable demand for daily feeding products as well as treats and supplements.
Restraints Impact Analysis*
| Restraint | (~) % Impact on CAGR Forecast | Geographic Relevance | Impact Timeline |
|---|---|---|---|
| Volatile raw meat and fish prices | -1.2% | Global, acute impact on Thailand, Vietnam production | Short term (≤ 2 years) |
| Import tariffs and non-tariff barriers | -0.9% | China-US trade, regional RCEP benefits partially offset | Medium term (2-4 years) |
| Food-safety recalls eroding trust | -0.7% | Taiwan, South Korea, spillover to regional markets | Short term (≤ 2 years) |
| Rise of homemade/raw feeding trends | -0.6% | Australia, Japan, urban South Korea | Medium term (2-4 years) |
| Source: Mordor Intelligence | |||
Volatile Raw Meat and Fish Prices
Fishmeal spot prices climbed 16% in 2024, reaching USD 2,200 per metric ton, while fish oil doubled to USD 7,500 per metric ton as El Niño cut Peruvian anchovy landings[2]Source: Food and Agriculture Organization, “International Markets for Fisheries and Aquaculture Products,” fao.org. These spikes compressed margins across the Asia-Pacific cat food market, as protein inputs represent up to 65% of the finished goods' cost. Many producers responded by forward-buying inventory, reformulating recipes with poultry or insect meal, and passing selective price increases to consumers. However, prolonged volatility risks slowing premium adoption if shoppers down-trade to economy SKUs.
Import Tariffs and Non-Tariff Barriers
Despite the Regional Comprehensive Economic Partnership lowering average duties, bilateral frictions remain. China retains elevated tariffs on select United States pet food items, while Indonesia enforces strict import registration that prolongs customs clearance. Companies serving the Asia-Pacific cat food market must therefore navigate varying annotation, certification, and labeling rules, which raise working-capital requirements. The added friction particularly burdens smaller exporters and may limit assortment diversity for consumers.
*Our forecasts treat driver/restraint impacts as directional, not additive. The impact forecasts reflect baseline growth, mix effects, and variable interactions.
Segment Analysis
By Pet Food Product: Functional Additives Accelerate Premium Trade-Up
Traditional food controlled 66.48% of the Asia-Pacific cat food market in 2025. Within that base, wet recipes posted high single-digit growth in the Philippines, as moisture content supports urinary health in tropical climates. Nutraceuticals and supplements are forecast to advance at a 10.33% CAGR, the fastest among all product types, as owners seek proactive solutions for digestion, immunity, and joint mobility. Probiotic sachets, omega-3 chews, and vitamin gels command premium shelf prices and often sell through veterinary channels, thereby enhancing their perceived credibility. Manufacturers capitalize on this shift by bundling functional treats with subscription deliveries, thus embedding recurring revenue streams into the Asia-Pacific cat food market.
Veterinary diets for renal and digestive care present a niche yet expanding opportunity. Their science-based positioning aligns well with maturing pet populations in Japan and Australia. Domestic Chinese producers are now investing in research alliances to comply with AAFCO nutrient standards, aiming to capture a share of the market from established Western brands. As cost curves for specialty ingredients fall, functional SKUs are expected to lift the overall Asia-Pacific cat food market size while differentiating brands beyond flavor and format.


By Distribution Channel: Digital Commerce Gains Structural Momentum
Specialty stores retained 33.52% of sales in 2025, due to curated assortments and grooming services that foster shopper loyalty. Yet online platforms registered an 10.54% CAGR, the highest among all channels, converting browsing into one-click replenishment for busy urban owners. In China, live-stream showcases allow influencers to demonstrate palatability tests, accelerating category penetration. Taiwan’s free-delivery thresholds and auto-ship discounts have also normalized carton-level purchasing. Despite this surge, supermarkets and hypermarkets remain relevant for impulse buying and trial packs, especially in tier-2 and tier-3 cities, where digital logistics are still in the early stages of development.
Artificial intelligence recommendation engines are set to personalize feeding plans based on breed, age, and activity data harvested from smart collars. Such tech integration further embeds the Asia-Pacific cat food market into broader pet-care ecosystems, heightening switching costs and improving lifetime value metrics for digitally native brands.
Geography Analysis
China dominates the Asia-Pacific cat food market, holding a 40.12% value share, driven by a record 71.53 million pet cats and the accelerated premiumization among Gen-Z owners, who favor domestically produced grain-free formulas. E-commerce penetration exceeds that of traditional brick-and-mortar stores, and domestic brands now account for a significant share of online transactions, underscoring their competitive parity against multinational incumbents. Government revisions to the Pet Feed Management Measures in 2025 are projected to tighten labeling discipline, thereby elevating trust in compliant brands.
China is the fastest-growing territory, forecasted to grow at a 10.08% CAGR through 2031, as middle-class households transition from homemade fare to commercial diets. Awareness campaigns by veterinarians and retailers are reshaping feeding habits, while the rise of apartment living favors cats over dogs due to space constraints. Organized retail is expanding through mall-based pet superstores and mobile apps, collectively improving access to branded nutrition and lifting the Asia-Pacific cat food market size, attributable in India.
Developed markets continue to set high standards for formulation and packaging. Japan’s cat population of nearly 9 million underscores steady replacement demand for super-premium indoor diets, whereas Australian buyers prioritize recyclable packaging and sustainably sourced proteins. Southeast Asia offers manufacturing and export leverage: Thailand shipped pet food worth THB 85 billion (USD 2.67 billion) in 2024, ranking second globally and supplying both regional and Western customers. The Philippines logged high sales in cat food sales during 2024, propelled by condominium culture and wet-food preference. These diverse growth vectors affirm the long-term expansion potential of the Asia-Pacific cat food market.
Competitive Landscape
Mars, Incorporated, Nestlé S.A. (Purina), General Mills Inc., Archer Daniels Midland, and Hill’s Pet Nutrition collectively captured 14.1% of the revenue in 2024, underscoring a fragmented landscape. Mars, Incorporated and Nestlé S.A. (Purina) lead in premium dry and veterinary diets, leveraging multinational R&D pipelines, but local challengers are scaling rapidly online. Chinese brand Maifudi achieved RMB 1.192 billion (USD 167 million) in e-commerce sales in 2024, representing annual growth. Mars, Incorporated expanded its Northeast China plant in October 2024 with a USD 137.7 million upgrade to add premium pouch lines targeting export markets[3]Source: Pet Food Industry, “Mars Expands Premium Cat Food Production in China,” petfoodindustry.com.
Strategic plays include investments in alternative proteins, commitments to recyclable packaging, and AI-enabled subscription services. Nestlé S.A. (Purina) inaugurated a wet-food factory in South Korea to capitalize on the growing trend of moisture-rich diets, while General Mills acquired a regional premium brand portfolio to expand its channel coverage. Domestic players differentiate through localized flavors such as tuna-shrimp blends favored in coastal China, and through price positioning that undercuts imports.
Supply-chain depth also shapes competitiveness. Thailand offers cost-efficient manufacturing and strong food-safety certification, allowing contract manufacturers to private-label for Western retailers. In contrast, Australian firms market provenance and ingredient purity to premium-tirers across Southeast Asia. Overall, innovation cadence coupled with route-to-market agility will determine share shifts within the Asia-Pacific cat food market over the next five years.
Asia-Pacific Cat Food Industry Leaders
Colgate-Palmolive Company (Hill's Pet Nutrition Inc.)
General Mills Inc.
Nestle S.A. (Purina)
Archer Daniels Midland
Mars, Incorporated
- *Disclaimer: Major Players sorted in no particular order

Recent Industry Developments
- May 2024: Mars, Incorporated announced USD 137.7 million facility expansion in China to support growing domestic demand and export capabilities, featuring advanced production lines for premium cat food formulations and sustainable packaging solutions.
- July 2023: Hill's Pet Nutrition introduced its new MSC (Marine Stewardship Council) certified pollock and insect protein products for pets with sensitive stomachs and skin lines. They contain vitamins, omega-3 fatty acids, and antioxidants.
- May 2023: Nestle S.A. (Purina) launched new cat treats under the Friskies "Friskies Playfuls - treats" brand. These treats are round in shape and are available in chicken and liver and salmon, and shrimp flavors for adult cats.


Asia-Pacific Cat Food Market Report Scope
Food, Pet Nutraceuticals/Supplements, Pet Treats, and Pet Veterinary Diets are covered as segments by Pet Food Product. Convenience Stores, Online Channel, Specialty Stores, and Supermarkets/Hypermarkets are covered as segments by the Distribution Channel. Australia, China, India, Indonesia, Japan, Malaysia, Philippines, Taiwan, Thailand, and Vietnam are covered as segments by Country.
| Food | By Sub Product | Dry Pet Food | By Sub Dry Pet Food | Kibbles |
| Other Dry Pet Food | ||||
| Wet Pet Food | ||||
| Pet Nutraceuticals/Supplements | By Sub Product | Milk Bioactives | ||
| Omega-3 Fatty Acids | ||||
| Probiotics | ||||
| Proteins and Peptides | ||||
| Vitamins and Minerals | ||||
| Other Nutraceuticals | ||||
| Pet Treats | By Sub Product | Crunchy Treats | ||
| Dental Treats | ||||
| Freeze-dried and Jerky Treats | ||||
| Soft & Chewy Treats | ||||
| Other Treats | ||||
| Pet Veterinary Diets | By Sub Product | Derma Diets | ||
| Diabetes | ||||
| Digestive Sensitivity | ||||
| Obesity Diets | ||||
| Oral Care Diets | ||||
| Renal | ||||
| Urinary tract disease | ||||
| Other Veterinary Diets |
| Convenience Stores |
| Online Channel |
| Specialty Stores |
| Supermarkets/Hypermarkets |
| Other Channels |
| Australia |
| China |
| India |
| Indonesia |
| Japan |
| Malaysia |
| Philippines |
| Taiwan |
| Thailand |
| Vietnam |
| Rest of Asia-Pacific |
| By Pet Food Product | Food | By Sub Product | Dry Pet Food | By Sub Dry Pet Food | Kibbles |
| Other Dry Pet Food | |||||
| Wet Pet Food | |||||
| Pet Nutraceuticals/Supplements | By Sub Product | Milk Bioactives | |||
| Omega-3 Fatty Acids | |||||
| Probiotics | |||||
| Proteins and Peptides | |||||
| Vitamins and Minerals | |||||
| Other Nutraceuticals | |||||
| Pet Treats | By Sub Product | Crunchy Treats | |||
| Dental Treats | |||||
| Freeze-dried and Jerky Treats | |||||
| Soft & Chewy Treats | |||||
| Other Treats | |||||
| Pet Veterinary Diets | By Sub Product | Derma Diets | |||
| Diabetes | |||||
| Digestive Sensitivity | |||||
| Obesity Diets | |||||
| Oral Care Diets | |||||
| Renal | |||||
| Urinary tract disease | |||||
| Other Veterinary Diets | |||||
| By Distribution Channel | Convenience Stores | ||||
| Online Channel | |||||
| Specialty Stores | |||||
| Supermarkets/Hypermarkets | |||||
| Other Channels | |||||
| By Country | Australia | ||||
| China | |||||
| India | |||||
| Indonesia | |||||
| Japan | |||||
| Malaysia | |||||
| Philippines | |||||
| Taiwan | |||||
| Thailand | |||||
| Vietnam | |||||
| Rest of Asia-Pacific | |||||


Market Definition
- FUNCTIONS - Pet foods are usually intended to provide complete and balanced nutrition to the pet but are primarily used as functional products. The scope includes the food and supplements consumed by pets including veterinary diets. Supplements/nutraceuticals that are directly supplied to pets are considered within the scope.
- RESELLERS - Companies engaged in reselling of pet food without value addition have been excluded from the market scope, in order to avoid double counting.
- END CONSUMERS - Pet owners are considered to be the end-consumers in the market studied.
- DISTRIBUTION CHANNELS - Supermarkets/hypermarkets, specialty stores, convenience stores, online channels and other channels are considered within the scope. The stores which are exclusively providing pet related basic and custom products are considered within the scope of specialty stores.
| Keyword | Definition |
|---|---|
| Pet Food | The scope of pet food includes the food that is eatable by pets including food, treats, veterinary diets, and nutraceuticals/supplements. |
| Food | Food is animal feed intended for consumption by pets. It is formulated to provide essential nutrients and meet the dietary needs of various types of pets, including dogs, cats, and other animals. These are generally segmented into dry and wet pet foods. |
| Dry Pet Food | Dry pet foods may be extruded/baked (kibbles) or flaked. They have a lower moisture content, typically around 12-20%. |
| Wet Pet Food | Wet pet food, also known as canned pet food or moist pet food, generally has a higher moisture content compared to dry pet food, often ranging from 70-80%. |
| Kibbles | Kibbles are dry, processed pet food in small, bite-sized pieces or pellets. They are specifically formulated to provide balanced nutrition for various domestic animals, such as dogs, cats, and other animals. |
| Treats | Pet Treats are special food items or rewards given to pets, to show affection, and encourage good behavior. They are especially used during training. Pet treats are made from various combinations of meat or meat-derived materials with other ingredients. |
| Dental Treats | Pet dental treats are specialized treats that are formulated to promote good oral hygiene in pets. |
| Crunchy Treats | It is a type of pet treat that has a firm and crispy texture which can be a good source of nutrition for pets. |
| Soft and chewy treats | Soft and Chewy pet treats are a type of pet food product that is formulated to be easy to chewy and digest. They are usually made from soft and pliable ingredients, such as meat, poultry, or vegetables, that have been blended and formed into bite-sized pieces or strips. |
| Freeze-dried & Jerky Treats | Freeze-dried and jerky treats are snacks given to pets, that are prepared through a special preservation process, without damaging the nutritional content, resulting in long-lasting, nutrient-rich treats. |
| Urinary Tract Disease Diets | These are commercial diets that are specifically formulated to promote urinary health and reduce the risk of urinary tract infections and other urinary problems. |
| Renal Diets | These are specialized pet foods formulated to support the health of pets with kidney disease or renal insufficiency. |
| Digestive Sensitivity Diets | Digestive-sensitive diets are specially formulated to meet the nutritional needs of pets with digestive issues such as food intolerances, allergies, and sensitivities. These diets are designed to be easily digestible and to reduce the symptoms of digestive problems in pets. |
| Oral Care Diets | Oral care diets for pets are specially formulated diets produced to promote oral health and hygiene in pets. |
| Grain-Free Pet Food | Pet food that does not contain common grains like wheat, corn, or soy. Grain-free diets are often preferred by pet owners seeking alternative options or if their pets have specific dietary sensitivities. |
| Premium Pet Food | High-quality pet food formulated with superior ingredients often offers additional nutritional benefits compared to standard pet food. |
| Natural Pet Food | Pet food made from natural ingredients, with minimal processing and without artificial preservatives. |
| Organic Pet Food | Pet food is produced using organic ingredients, free from synthetic pesticides, hormones, and genetically modified organisms (GMOs). |
| Extrusion | A manufacturing process used to produce dry pet food, where ingredients are cooked, mixed, and shaped under high pressure and temperature. |
| Other Pets | Other pets include birds, fish, rabbits, hamsters, ferrets, and reptiles. |
| Palatability | The taste, texture, and aroma of pet food influence its appeal and acceptance by pets. |
| Complete and Balanced Pet Food | Pet food that provides all essential nutrients in appropriate proportions to meet the nutritional needs of pets without additional supplementation. |
| Preservatives | These are the substances that are added to pet food to extend its shelf life and prevent spoilage. |
| Nutraceuticals | Food products that offer health benefits beyond basic nutrition, often contain bioactive compounds with potential therapeutic effects. |
| Probiotics | Live beneficial bacteria that promote a healthy balance of gut flora, supporting digestive health and immune function in pets. |
| Antioxidants | Compounds that help neutralize harmful free radicals in the body, promoting cellular health and supporting the immune system in pets. |
| Shelf-Life | The duration of which pet food remains safe and nutritionally viable for consumption after its production date. |
| Prescription diet | Specialized pet food formulated to address specific medical conditions under veterinary supervision. |
| Allergen | A substance that can cause allergic reactions in some pets, leading to food allergies or sensitivities. |
| Canned food | Wet pet food that is packed in cans and contains higher moisture content than dry food. |
| Limited ingredient diet (LID) | Pet food formulated with a reduced number of ingredients to minimize potential allergens. |
| Guaranteed Analysis | The minimum or maximum levels of certain nutrients present in pet food. |
| Weight management | Pet food designed to help pets maintain a healthy weight or support weight loss efforts. |
| Other Nutraceuticals | It includes prebiotics, antioxidants, digestive fiber, enzymes, essential oils and herbs. |
| Other Veterinary Diets | It includes weight management diets, skin and coat health, cardiac care, and joint care. |
| Other Treats | It includes rawhides, mineral blocks, lickables, and catnips. |
| Other Dry Foods | It includes cereal flakes, mixers, meal toppers, freeze-dried foods, and air-dried foods. |
| Other Animals | It includes birds, fish, reptiles, and small animals (rabbits, ferrets, hamsters). |
| Other Distribution Channels | It includes veterinary clinics, local unregulated stores, and feed and farm stores. |
| Proteins and Peptides | Proteins are large molecules composed of basic units called amino acids which help in the growth and development of pets. Peptides are the short string of 2 to 50 amino acids. |
| Omega-3 fatty acids | Omega-3 fatty acids are essential polyunsaturated fats that play a crucial role in the overall health and well-being of Pets |
| Vitamins | Vitamins are the essential organic compounds that are essential for vital physiological functioning. |
| Minerals | Minerals are naturally occurring inorganic substances that are essential for various physiological functions in pets. |
| CKD | Chronic Kidney Disease |
| DHA | Docosahexaenoic Acid |
| EPA | Eicosapentaenoic Acid |
| ALA | Alpha-linolenic Acid |
| BHA | Butylated Hydroxyanisol |
| BHT | Butylated Hydroxytoluene |
| FLUTD | Feline Lower Urinary Tract Disease |


Research Methodology
Mordor Intelligence follows a four-step methodology in all our reports.
- Step-1: IDENTIFY KEY VARIABLES: In order to build a robust forecasting methodology, the variables and factors identified in Step-1 are tested against available historical market numbers. Through an iterative process, the variables required for market forecast are set and the model is built on the basis of these variables.
- Step-2: Build a Market Model: Market-size estimations for the forecast years are in nominal terms. Inflation is not a part of the pricing, and the average selling price (ASP) is kept constant throughout the forecast period.
- Step-3: Validate and Finalize: In this important step, all market numbers, variables and analyst calls are validated through an extensive network of primary research experts from the market studied. The respondents are selected across levels and functions to generate a holistic picture of the market studied.
- Step-4: Research Outputs: Syndicated Reports, Custom Consulting Assignments, Databases & Subscription Platforms


