Asia-Pacific Pet Treats Market Size and Share
Market Overview
| Study Period | 2017 - 2030 |
|---|---|
| Forecast Data Period | 2025 - 2030 |
| Historical Data Period | 2017 - 2023 |
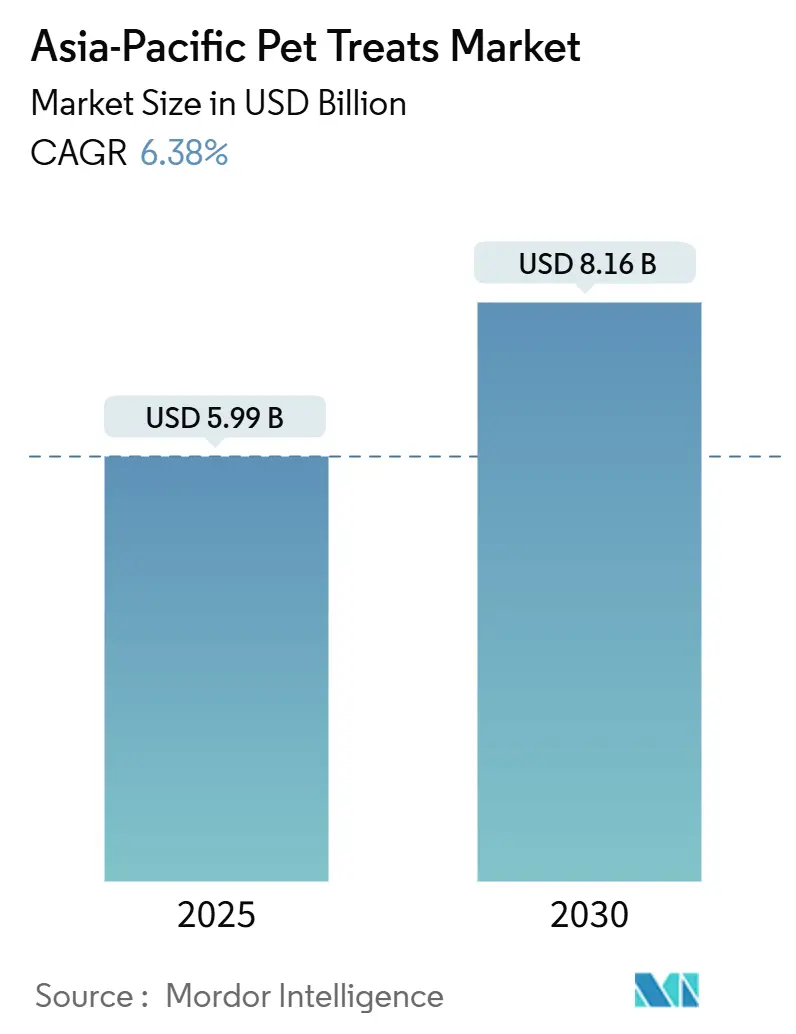
| Market Size (2025) | USD 5.99 Billion |
| Market Size (2030) | USD 8.16 Billion |
| Growth Rate (2025 - 2030) | 6.38% CAGR |
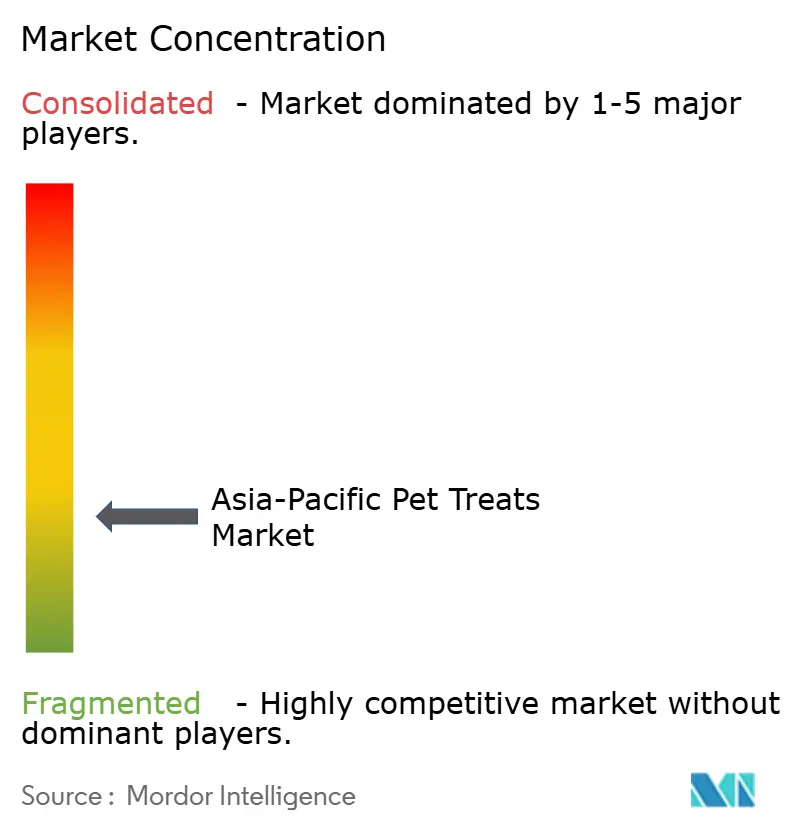
| Market Concentration | Low |
Major Players *Disclaimer: Major Players sorted in no particular order Image © Mordor Intelligence. Reuse requires attribution under CC BY 4.0. | |
Asia-Pacific Pet Treats Market Analysis by Mordor Intelligence
The Asia Pacific pet treats market size is USD 5.99 billion in 2025 and is forecast to reach USD 8.16 billion by 2030, reflecting a 6.38% CAGR. Rising pet-humanization, premium positioning of functional formulations, and rapid e-commerce adoption drive the steady revenue climb. Dental treats lead to value creation because preventive oral-care messaging resonates with urban pet parents. Dogs still dominate overall volume, yet accelerating cat ownership lifts the fastest-growing segment. The channel mix is shifting as specialty outlets keep authority status while online marketplaces register double-digit annual traffic gains.
Key Report Takeaways
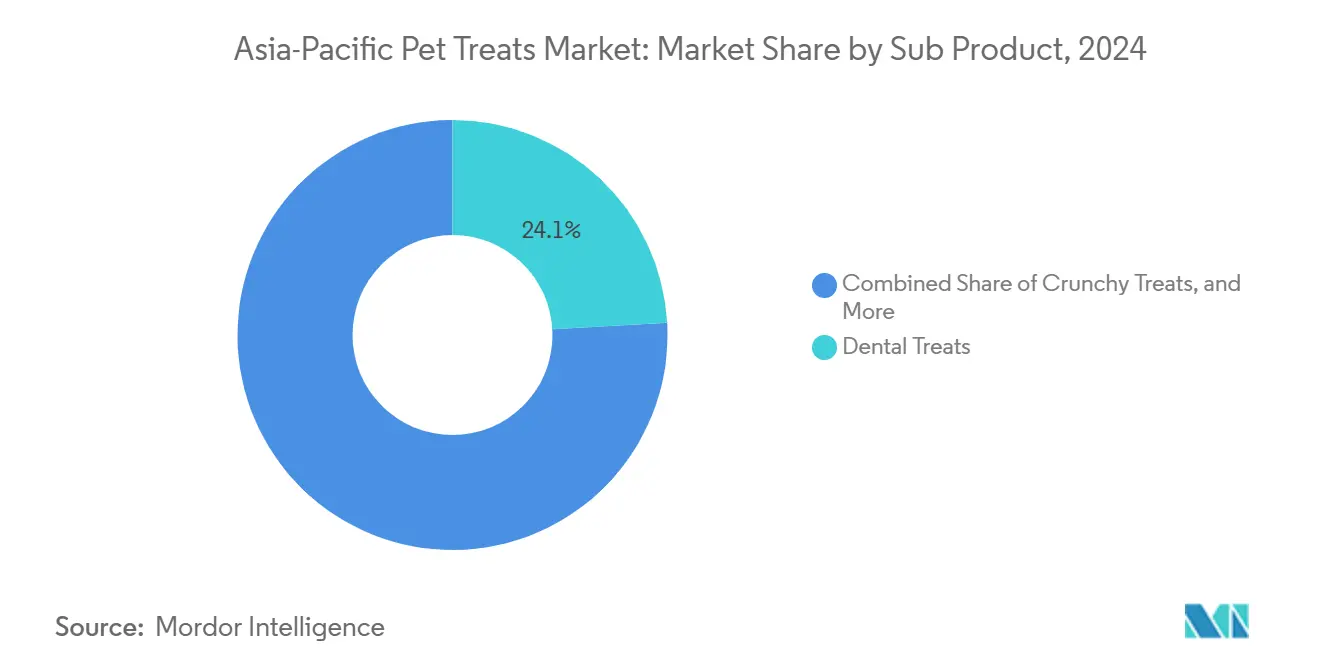
- By sub product, dental treats led with a 24.1% revenue share of the Asia Pacific pet treats market in 2024, while the same category is advancing at a 6.7% CAGR through 2030.
- By pets, dogs captured 51.1% of the Asia Pacific pet treats market share in 2024, whereas the cat segment records the highest projected CAGR at 8.3% to 2030.
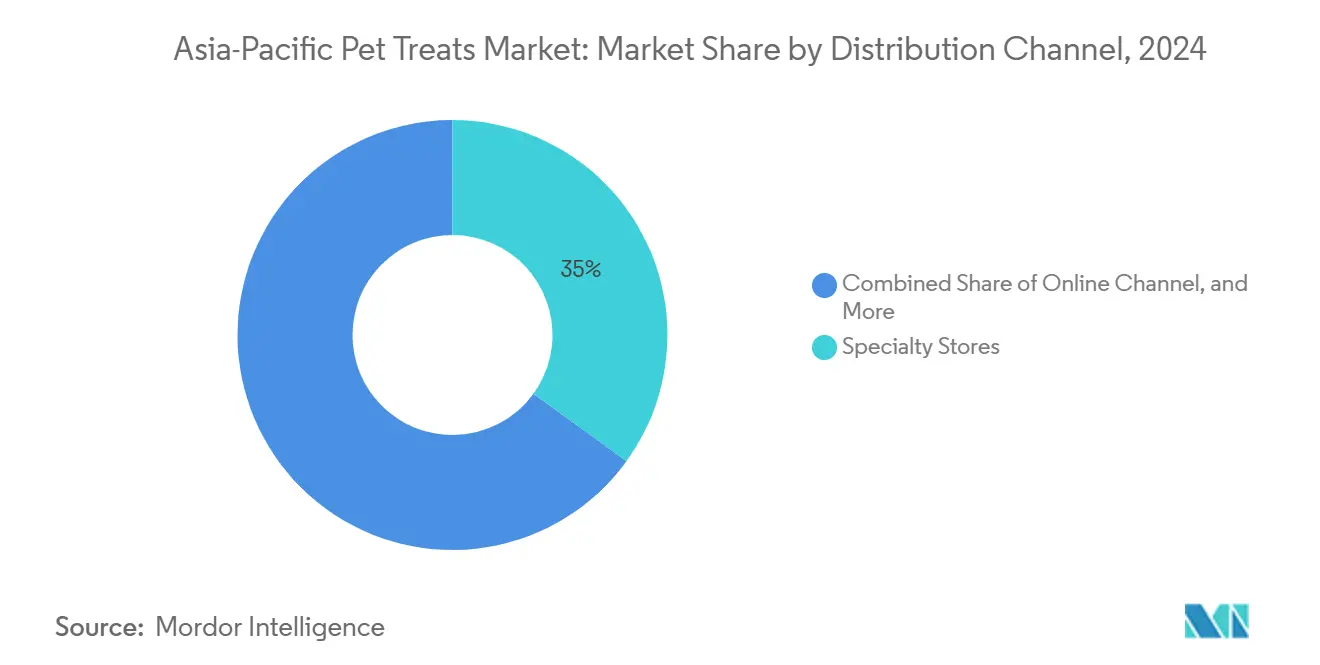
- By distribution channel, specialty stores held 35.0% of the Asia Pacific pet treats market size in 2024, while online channels are set to expand at a 9.4% CAGR to 2030.
- By country, China dominated with 35.8% of the Asia Pacific pet treats market size in 2024, whereas India is projected to post the fastest 11.6% CAGR through 2030.
- The Asia-Pacific pet treats market exhibits a fragmented competitive landscape comprising global conglomerates and regional specialists. The market shows moderate consolidation, with companies such as Mars, Incorporated, Colgate-Palmolive Company (Hill's Pet Nutrition, Inc.), General Mills Inc., ADM, and EBOS Group Limited holding significant market share of 20.1% in 2024.
Asia-Pacific Pet Treats Market Trends and Insights
Drivers Impact Analysis*
| Driver | (~) % Impact on CAGR Forecast | Geographic Relevance | Impact Timeline |
|---|---|---|---|
| Rising pet ownership and humanization | +1.8% | Core Asia-Pacific metros, spillover to emerging markets | Long term (≥ 4 years) |
| Premiumization and functional-treat demand | +1.2% | Urban Japan and Australia, widening across the region | Medium term (2-4 years) |
| E-commerce expansion across Asia-Pacific | +0.9% | China, India, Southeast Asia | Short term (≤ 2 years) |
| Growing disposable incomes in emerging economies | +0.7% | India, Indonesia, Vietnam, and Philippines | Long term (≥ 4 years) |
| Veterinarian-led preventive oral-care campaigns | +0.6% | China, Japan, Australia, and Singapore | Medium term (2-4 years) |
| Tariff-cutting regional trade pacts enabling cross-border private-label exports | +0.4% | RCEP (Regional Comprehensive Economic Partnership) and CPTPP (Comprehensive and Progressive Agreement for Trans-Pacific Partnership) member nations | Medium term (2-4 years) |
| Source: Mordor Intelligence | |||


Rising Pet Ownership and Humanization
Pet humanization is transforming purchasing patterns across Asia Pacific, as pet owners provide their companion animals with healthcare, nutrition, and lifestyle products traditionally meant for human family members. Dogs remain the predominant pets in India in 2024, with 63% of pet owners having dogs and 42% having cats[1]Source: Ministry of Fisheries Animal Husbandry and Dairying, “All-India Pet Ownership Survey 2024,” Government of India, dahd.gov.in. This trend is particularly strong in urban areas, where smaller households develop deeper emotional connections with pets, increasing their willingness to purchase premium-priced functional treats that target specific health concerns. Veterinary associations in developed markets like Japan and Australia, where pet insurance penetration exceeds 15%, are implementing companion animal welfare standards that further support this humanization trend. This transformation has created consistent demand for treats marketed as health supplements rather than basic rewards, significantly changing product development priorities throughout the region.
Premiumization and Functional-Treat Demand
Functional treats incorporating probiotics, joint health supplements, and dental care formulations capture disproportionate value creation as pet owners prioritize preventive health measures. Premium positioning allows manufacturers to achieve gross margins 40-60 percent higher than standard treat categories, while functional claims justify price premiums that insulate against commodity cost inflation. Japanese and Australian markets lead adoption of science-backed formulations, with regulatory frameworks supporting health claims that meet AAFCO (Association of American Feed Control Officials) nutritional standards. This premiumization trend extends beyond developed markets, as emerging economies demonstrate a willingness to trade up when functional benefits align with perceived value propositions for beloved companion animals.
E-commerce Expansion Across Asia-Pacific
Digital commerce channels revolutionize pet treat distribution by enabling direct-to-consumer relationships and subscription-based purchasing models that increase customer lifetime value. Online platforms like Tmall, JD.com, and regional e-commerce leaders capture 25-30 percent of pet care sales in major urban markets, offering convenience and product variety impossible in physical retail formats. Cross-border e-commerce facilitates market entry for international brands while enabling local manufacturers to reach previously inaccessible geographic segments. The channel shift creates data advantages for companies investing in digital capabilities, allowing personalized product recommendations and targeted marketing that traditional retail cannot match.
Growing Disposable Incomes in Emerging Economies
Rising household incomes in India, Indonesia, Vietnam, and the Philippines create new market tiers as middle-class expansion drives pet ownership adoption and spending power for premium products. India's pet care market grew 25 percent annually through 2024, with urban households increasingly viewing pet treats as essential rather than discretionary purchases. This income growth enables trading up from basic biscuits to functional treats, creating volume expansion opportunities for manufacturers who adapt formulations and pricing to local preferences. Currency stability and economic growth projections support sustained purchasing power increases that benefit the entire pet care value chain.
Restraints Impact Analysis*
| Restraint | (~) % Impact on CAGR Forecast | Geographic Relevance | Impact Timeline |
|---|---|---|---|
| Mass-market price sensitivity | -1.5% | Tier-2 and tier-3 cities in emerging Asia Pacific markets | Short term (≤ 2 years) |
| Fragmented regulatory frameworks and compliance costs | -0.8% | All Asia-Pacific nations with varying standards | Long term (≥ 4 years) |
| Homemade/raw-feeding substitution in tier-2 cities | -0.6% | Secondary cities in India, Indonesia, the Philippines, and Vietnam | Medium term (2-4 years) |
| Climate-driven protein-commodity price volatility | -0.4% | Global supply chains are affecting every Asia-Pacific producer | Short term (≤ 2 years) |
| Source: Mordor Intelligence | |||
Mass-market Price Sensitivity
Price-conscious consumers in emerging economies limit premium product adoption, particularly in tier-2 and tier-3 cities, where discretionary spending on pet products competes with essential household needs. Economic pressures from inflation and currency fluctuations intensify price sensitivity, forcing manufacturers to balance ingredient quality with affordability constraints that can compromise product differentiation strategies. Local competitors leverage cost advantages through simplified formulations and packaging, creating downward pricing pressure that challenges international brands' margin expectations. This sensitivity particularly impacts functional treat categories where premium positioning becomes difficult to justify in price-sensitive market segments.
Fragmented Regulatory Frameworks and Compliance Costs
Divergent regulatory standards across Asia-Pacific countries create substantial compliance costs and market entry barriers, particularly for smaller manufacturers lacking resources to navigate multiple approval processes. China's evolving pet food regulations, Japan's strict import requirements, and Australia's biosecurity protocols each demand separate product registrations and facility certifications that can exceed USD 500,000 per market entry. Regulatory influence from AAFCO (Association of American Feed Control Officials) standards adoption varies significantly between countries, creating confusion about acceptable health claims and ingredient specifications [3]Source: Ministry of Agriculture Forestry and Fisheries, “Act on Ensuring the Safety of Pet Food,” Government of Japan, maff.go.jp. These fragmented requirements slow innovation cycles and favor established players with regulatory expertise over emerging competitors.
*Our forecasts treat driver/restraint impacts as directional, not additive. The impact forecasts reflect baseline growth, mix effects, and variable interactions.
Segment Analysis
By Sub Product: Dental Treats Lead Functional Innovation
Dental treats capture 24.1% market share in 2024 while simultaneously achieving the fastest growth at 6.7% CAGR through 2030, reflecting the convergence of pet humanization trends with preventive healthcare awareness. This dual leadership position demonstrates how functional benefits create sustainable competitive advantages, as veterinary endorsements and clinical efficacy studies differentiate dental formulations from commodity treat categories.
The shift toward functional positioning reflects broader industry evolution from simple reward products to health-focused nutrition solutions. Regulatory frameworks supporting dental health claims in developed markets like Japan and Australia enable premium pricing strategies that offset higher ingredient and research costs. Other treat categories including training biscuits and seasonal novelties face commoditization pressures but retain importance for market share maintenance and distribution relationship building across diverse retail channels.


By Pets: Dogs Dominate While Cats Accelerate
Dogs command 51.1% market share in 2024, leveraging their larger size, social training requirements, and established treat-giving traditions across Asia-Pacific cultures. The segment's dominance is further strengthened by dogs' higher preference for treats compared to other pets, along with their natural desire to chew and their requirement for training aids. The increasing demand for dental treats, crunchy treats, and freeze-dried treats among dog owners particularly drives the market. Additionally, the growing trend of pet humanization and the increasing willingness of pet parents to spend on premium and functional treats for their dogs have contributed significantly to this segment's market leadership.
Cats exhibit the highest growth trajectory at 8.3% CAGR through 2030, with 30% of pet owners having a cat in 2024 [2]Source: Insurance Council of Australia, “Pet Insurance Statistics 2024,” insurancecouncil.com.au. This growth is driven by increased urban pet adoption and better understanding of feline nutritional requirements that differ from dog dietary needs. The market expansion is supported by demand for specialized products like dental treats and freeze-dried options. Cat owners' growing awareness of treats' role in dental care and behavioral enrichment contributes to market development. The increasing preference for premium treats with natural ingredients, high meat content, and minimal processing supports continued market growth.
By Distribution Channel: Digital Disruption Reshapes Retail
Specialty stores maintain a 35.0% market share in 2024 through expert staff guidance and premium product curation. Specialty shops remain an important secondary channel. They continue to play a significant role because of their trained staff, curated product ranges, and access to premium and functional pet treats that appeal to knowledgeable or health-conscious pet owners.
Online channels surge at 9.4% CAGR through 2030 as digital natives embrace e-commerce convenience and subscription models. This channel's prominence is driven by several key factors, including the convenience of home delivery, wider product selection, and competitive pricing through various e-commerce platforms. Major online platforms like Taobao and Tmall in China, Lazada in Thailand, and Bow and Wow in the Philippines have significantly contributed to this channel's growth. The segment has particularly benefited from the increasing digitalization of retail in key markets like China, Japan, and Indonesia, which together account for nearly 89% of online pet snacks sales in the region. The channel's success is further bolstered by features such as detailed product information, customer reviews, and the ability to compare prices across different brands, making it particularly attractive to modern pet owners who prioritize convenience and informed decision-making in their purchasing behavior.
Geography Analysis
China dominates with a 35.8% market share in 2024, leveraging its massive pet population, established e-commerce infrastructure, and rising disposable incomes that support premium product adoption. China's market leadership reflects its unique combination of massive scale, digital commerce sophistication, and rapid pet humanization trends that drive premium product adoption across tier-1 cities. The country's regulatory environment continues evolving with new pet food safety standards and import requirements that create compliance costs but ultimately support market premiumization by eliminating substandard competitors.
India emerges as the fastest-growing market at 11.6% CAGR through 2030, driven by rapid urbanization, expanding middle-class pet ownership, and increasing awareness of companion animal nutrition needs. India's exceptional growth trajectory stems from urbanization-driven pet adoption, expanding middle-class disposable incomes, and increasing awareness of companion animal nutrition needs among younger demographics. The market exhibits strong price sensitivity that favors local manufacturers and value-positioned products, though premium segments grow rapidly in metropolitan areas where pet humanization trends mirror developed market patterns.
Japan and Australia represent sophisticated markets with established regulatory frameworks, high veterinary visit frequencies, and consumer willingness to pay premium prices for science-backed functional products. These markets serve as innovation testbeds for new product concepts that can subsequently expand to emerging markets with appropriate adaptation for local preferences and pricing constraints. Southeast Asian countries including Thailand, Indonesia, Malaysia, and Vietnam offer attractive growth opportunities through rising incomes and pet adoption rates, though market development requires patience and investment in consumer education about commercial pet nutrition benefits.
Competitive Landscape
The Asia-Pacific pet treats market features a fragmented competitive landscape, comprising both global conglomerates and regional specialists. Global companies maintain strong market positions through established brand portfolios, research capabilities, and extensive distribution networks, while regional players compete through local market expertise and specialized product offerings. The market is fragmented, with companies such as Mars, Incorporated, Colgate-Palmolive Company (including Hill's Pet Nutrition, Inc.), General Mills Inc., ADM, and EBOS Group Limited holding a significant market share of 20.1% in 2024.
The market is characterized by increasing merger and acquisition activities as companies expand their geographical presence and product portfolios. Multinational companies acquire local manufacturers to strengthen their regional presence and access established distribution networks. Regional players form strategic alliances to enhance their market position. The increasing presence of private-label products and specialized premium treat manufacturers also shapes the competitive environment.
Success in the Asia-Pacific pet treats market requires companies to adapt to evolving consumer preferences and market dynamics. Companies must focus on product innovation, particularly in premium and functional treats segments, while maintaining strong relationships with veterinarians and pet specialty retailers. Developing e-commerce capabilities and direct-to-consumer channels is essential for market success. Companies also need to invest in sustainable packaging solutions and transparent sourcing practices to address consumer demand for environmentally responsible products.
Asia-Pacific Pet Treats Industry Leaders
Mars, Incorporated
Colgate-Palmolive Company (Hill's Pet Nutrition, Inc.)
General Mills Inc.
ADM
EBOS Group Limited
- *Disclaimer: Major Players sorted in no particular order

Recent Industry Developments
- May 2025: Nestlé Purina PetCare established a strategic partnership with Indian pet food manufacturer Drools to co-develop functional treat products specifically formulated for the South Asian market. The collaboration combines Purina's global R&D expertise with Drools' local market knowledge and distribution network to accelerate growth in India's rapidly expanding pet care segment.
- May 2023: Nestlé (Purina) launched new cat treats under the Friskies "Friskies Playfuls - treats" brand. These treats are round in shape and are available in chicken and liver and salmon and shrimp flavors for adult cats.
- May 2023: Vafo Praha, s.r.o. launched its new range of Brit RAW Freeze-dried treats and toppers for dogs. These products are made up of high-quality proteins and minimally processed ingredients for potential health benefits.


Asia-Pacific Pet Treats Market Report Scope
Crunchy Treats, Dental Treats, Freeze-dried and Jerky Treats, Soft & Chewy Treats are covered as segments by Sub Product. Cats, Dogs are covered as segments by Pets. Convenience Stores, Online Channel, Specialty Stores, Supermarkets/Hypermarkets are covered as segments by Distribution Channel. Australia, China, India, Indonesia, Japan, Malaysia, Philippines, Taiwan, Thailand, Vietnam are covered as segments by Country.
| Crunchy Treats |
| Dental Treats |
| Freeze-dried and Jerky Treats |
| Soft & Chewy Treats |
| Other Treats |
| Cats |
| Dogs |
| Other Pets |
| Convenience Stores |
| Online Channel |
| Specialty Stores |
| Supermarkets/Hypermarkets |
| Other Channels |
| Australia |
| China |
| India |
| Indonesia |
| Japan |
| Malaysia |
| Philippines |
| Taiwan |
| Thailand |
| Vietnam |
| Rest of Asia-Pacific |
| Sub Product | Crunchy Treats |
| Dental Treats | |
| Freeze-dried and Jerky Treats | |
| Soft & Chewy Treats | |
| Other Treats | |
| Pets | Cats |
| Dogs | |
| Other Pets | |
| Distribution Channel | Convenience Stores |
| Online Channel | |
| Specialty Stores | |
| Supermarkets/Hypermarkets | |
| Other Channels | |
| Country | Australia |
| China | |
| India | |
| Indonesia | |
| Japan | |
| Malaysia | |
| Philippines | |
| Taiwan | |
| Thailand | |
| Vietnam | |
| Rest of Asia-Pacific |


Market Definition
- FUNCTIONS - Pet foods are usually intended to provide complete and balanced nutrition to the pet but are primarily used as functional products. The scope includes the food and supplements consumed by pets including veterinary diets. Supplements/nutraceuticals that are directly supplied to pets are considered within the scope.
- RESELLERS - Companies engaged in reselling of pet food without value addition have been excluded from the market scope, in order to avoid double counting.
- END CONSUMERS - Pet owners are considered to be the end-consumers in the market studied.
- DISTRIBUTION CHANNELS - Supermarkets/hypermarkets, specialty stores, convenience stores, online channels and other channels are considered within the scope. The stores which are exclusively providing pet related basic and custom products are considered within the scope of specialty stores.
| Keyword | Definition |
|---|---|
| Pet Food | The scope of pet food includes the food that is eatable by pets including food, treats, veterinary diets, and nutraceuticals/supplements. |
| Food | Food is animal feed intended for consumption by pets. It is formulated to provide essential nutrients and meet the dietary needs of various types of pets, including dogs, cats, and other animals. These are generally segmented into dry and wet pet foods. |
| Dry Pet Food | Dry pet foods may be extruded/baked (kibbles) or flaked. They have a lower moisture content, typically around 12-20%. |
| Wet Pet Food | Wet pet food, also known as canned pet food or moist pet food, generally has a higher moisture content compared to dry pet food, often ranging from 70-80%. |
| Kibbles | Kibbles are dry, processed pet food in small, bite-sized pieces or pellets. They are specifically formulated to provide balanced nutrition for various domestic animals, such as dogs, cats, and other animals. |
| Treats | Pet Treats are special food items or rewards given to pets, to show affection, and encourage good behavior. They are especially used during training. Pet treats are made from various combinations of meat or meat-derived materials with other ingredients. |
| Dental Treats | Pet dental treats are specialized treats that are formulated to promote good oral hygiene in pets. |
| Crunchy Treats | It is a type of pet treat that has a firm and crispy texture which can be a good source of nutrition for pets. |
| Soft and chewy treats | Soft and Chewy pet treats are a type of pet food product that is formulated to be easy to chewy and digest. They are usually made from soft and pliable ingredients, such as meat, poultry, or vegetables, that have been blended and formed into bite-sized pieces or strips. |
| Freeze-dried & Jerky Treats | Freeze-dried and jerky treats are snacks given to pets, that are prepared through a special preservation process, without damaging the nutritional content, resulting in long-lasting, nutrient-rich treats. |
| Urinary Tract Disease Diets | These are commercial diets that are specifically formulated to promote urinary health and reduce the risk of urinary tract infections and other urinary problems. |
| Renal Diets | These are specialized pet foods formulated to support the health of pets with kidney disease or renal insufficiency. |
| Digestive Sensitivity Diets | Digestive-sensitive diets are specially formulated to meet the nutritional needs of pets with digestive issues such as food intolerances, allergies, and sensitivities. These diets are designed to be easily digestible and to reduce the symptoms of digestive problems in pets. |
| Oral Care Diets | Oral care diets for pets are specially formulated diets produced to promote oral health and hygiene in pets. |
| Grain-Free Pet Food | Pet food that does not contain common grains like wheat, corn, or soy. Grain-free diets are often preferred by pet owners seeking alternative options or if their pets have specific dietary sensitivities. |
| Premium Pet Food | High-quality pet food formulated with superior ingredients often offers additional nutritional benefits compared to standard pet food. |
| Natural Pet Food | Pet food made from natural ingredients, with minimal processing and without artificial preservatives. |
| Organic Pet Food | Pet food is produced using organic ingredients, free from synthetic pesticides, hormones, and genetically modified organisms (GMOs). |
| Extrusion | A manufacturing process used to produce dry pet food, where ingredients are cooked, mixed, and shaped under high pressure and temperature. |
| Other Pets | Other pets include birds, fish, rabbits, hamsters, ferrets, and reptiles. |
| Palatability | The taste, texture, and aroma of pet food influence its appeal and acceptance by pets. |
| Complete and Balanced Pet Food | Pet food that provides all essential nutrients in appropriate proportions to meet the nutritional needs of pets without additional supplementation. |
| Preservatives | These are the substances that are added to pet food to extend its shelf life and prevent spoilage. |
| Nutraceuticals | Food products that offer health benefits beyond basic nutrition, often contain bioactive compounds with potential therapeutic effects. |
| Probiotics | Live beneficial bacteria that promote a healthy balance of gut flora, supporting digestive health and immune function in pets. |
| Antioxidants | Compounds that help neutralize harmful free radicals in the body, promoting cellular health and supporting the immune system in pets. |
| Shelf-Life | The duration of which pet food remains safe and nutritionally viable for consumption after its production date. |
| Prescription diet | Specialized pet food formulated to address specific medical conditions under veterinary supervision. |
| Allergen | A substance that can cause allergic reactions in some pets, leading to food allergies or sensitivities. |
| Canned food | Wet pet food that is packed in cans and contains higher moisture content than dry food. |
| Limited ingredient diet (LID) | Pet food formulated with a reduced number of ingredients to minimize potential allergens. |
| Guaranteed Analysis | The minimum or maximum levels of certain nutrients present in pet food. |
| Weight management | Pet food designed to help pets maintain a healthy weight or support weight loss efforts. |
| Other Nutraceuticals | It includes prebiotics, antioxidants, digestive fiber, enzymes, essential oils and herbs. |
| Other Veterinary Diets | It includes weight management diets, skin and coat health, cardiac care, and joint care. |
| Other Treats | It includes rawhides, mineral blocks, lickables, and catnips. |
| Other Dry Foods | It includes cereal flakes, mixers, meal toppers, freeze-dried foods, and air-dried foods. |
| Other Animals | It includes birds, fish, reptiles, and small animals (rabbits, ferrets, hamsters). |
| Other Distribution Channels | It includes veterinary clinics, local unregulated stores, and feed and farm stores. |
| Proteins and Peptides | Proteins are large molecules composed of basic units called amino acids which help in the growth and development of pets. Peptides are the short string of 2 to 50 amino acids. |
| Omega-3 fatty acids | Omega-3 fatty acids are essential polyunsaturated fats that play a crucial role in the overall health and well-being of Pets |
| Vitamins | Vitamins are the essential organic compounds that are essential for vital physiological functioning. |
| Minerals | Minerals are naturally occurring inorganic substances that are essential for various physiological functions in pets. |
| CKD | Chronic Kidney Disease |
| DHA | Docosahexaenoic Acid |
| EPA | Eicosapentaenoic Acid |
| ALA | Alpha-linolenic Acid |
| BHA | Butylated Hydroxyanisol |
| BHT | Butylated Hydroxytoluene |
| FLUTD | Feline Lower Urinary Tract Disease |


Research Methodology
Mordor Intelligence follows a four-step methodology in all our reports.
- Step-1: IDENTIFY KEY VARIABLES: In order to build a robust forecasting methodology, the variables and factors identified in Step-1 are tested against available historical market numbers. Through an iterative process, the variables required for market forecast are set and the model is built on the basis of these variables.
- Step-2: Build a Market Model: Market-size estimations for the forecast years are in nominal terms. Inflation is not a part of the pricing, and the average selling price (ASP) is kept constant throughout the forecast period.
- Step-3: Validate and Finalize: In this important step, all market numbers, variables and analyst calls are validated through an extensive network of primary research experts from the market studied. The respondents are selected across levels and functions to generate a holistic picture of the market studied.
- Step-4: Research Outputs: Syndicated Reports, Custom Consulting Assignments, Databases & Subscription Platforms


