Market Overview
| Study Period | 2018 - 2031 |
|---|---|
| Forecast Data Period | 2026 - 2031 |
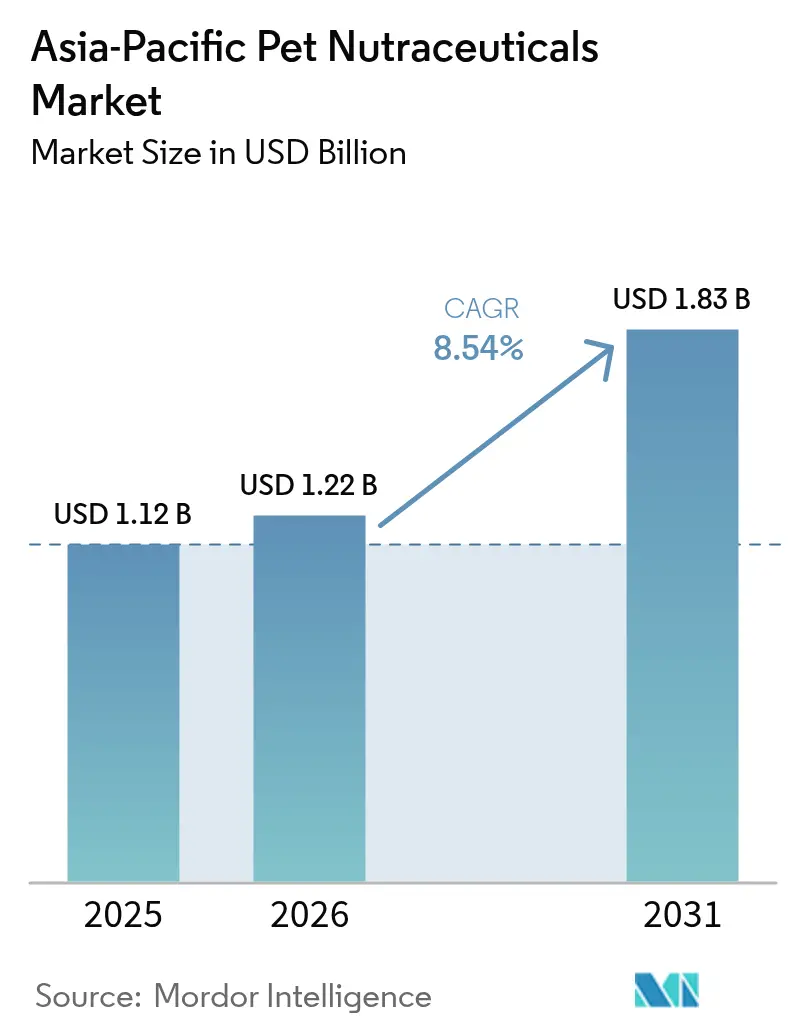
| Base Year Market Size (2025) | USD 1.12 Billion |
| Market Size (2026) | USD 1.22 Billion |
| Market Size (2031) | USD 1.83 Billion |
| Growth Rate (2026 - 2031) | 8.54% CAGR |
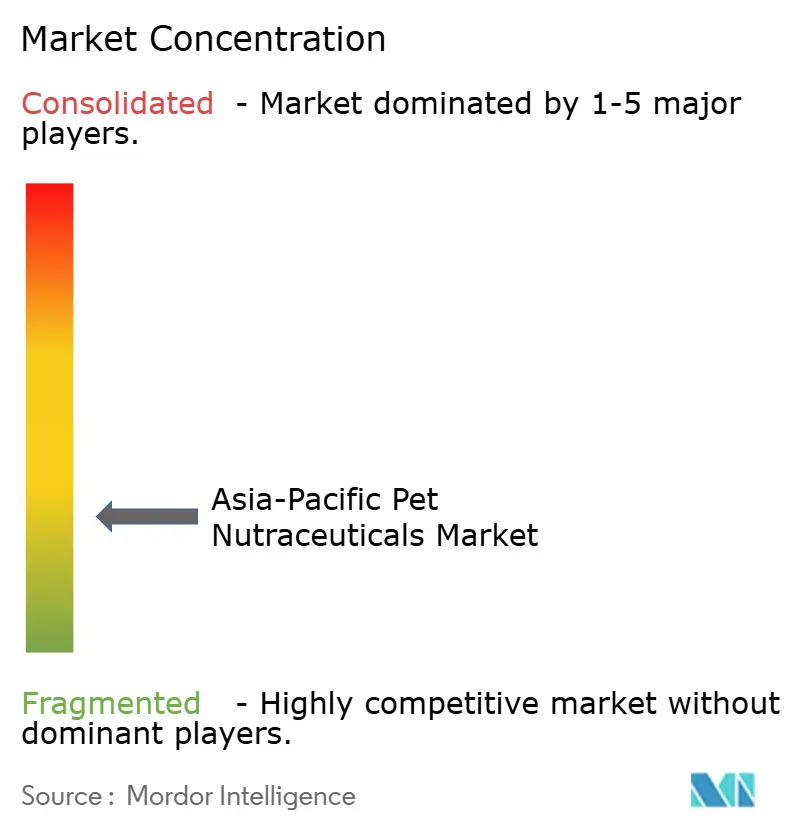
| Market Concentration | Low |
Major Players *Disclaimer: Major Players sorted in no particular order Image © Mordor Intelligence. Reuse requires attribution under CC BY 4.0. | |
Asia-Pacific Pet Nutraceuticals Market Analysis by Mordor Intelligence
The Asia-Pacific pet nutraceuticals market size is expected to grow from USD 1.12 billion in 2025 to USD 1.22 billion in 2026 and is forecast to reach USD 1.83 billion by 2031 at 8.54% CAGR over 2026-2031. Prevailing pet-humanization, growing disposable incomes, and steady regulatory harmonization together underpin this trajectory, allowing functional ingredients such as algae-sourced omega-3 oils to reach scale without marine supply-chain risks. E-commerce platforms deepen consumer access to specialized SKUs, while veterinary adoption of preventive health protocols widens supplement acceptance among owners. Ingredient cost deflation, particularly for microalgae EPA and DHA, further accelerates innovation cycles and lowers price thresholds. At the same time, culturally diverse Asia-Pacific consumer segments channel rising discretionary income toward premium formats that promise measurable health outcomes.
Key Report Takeaways
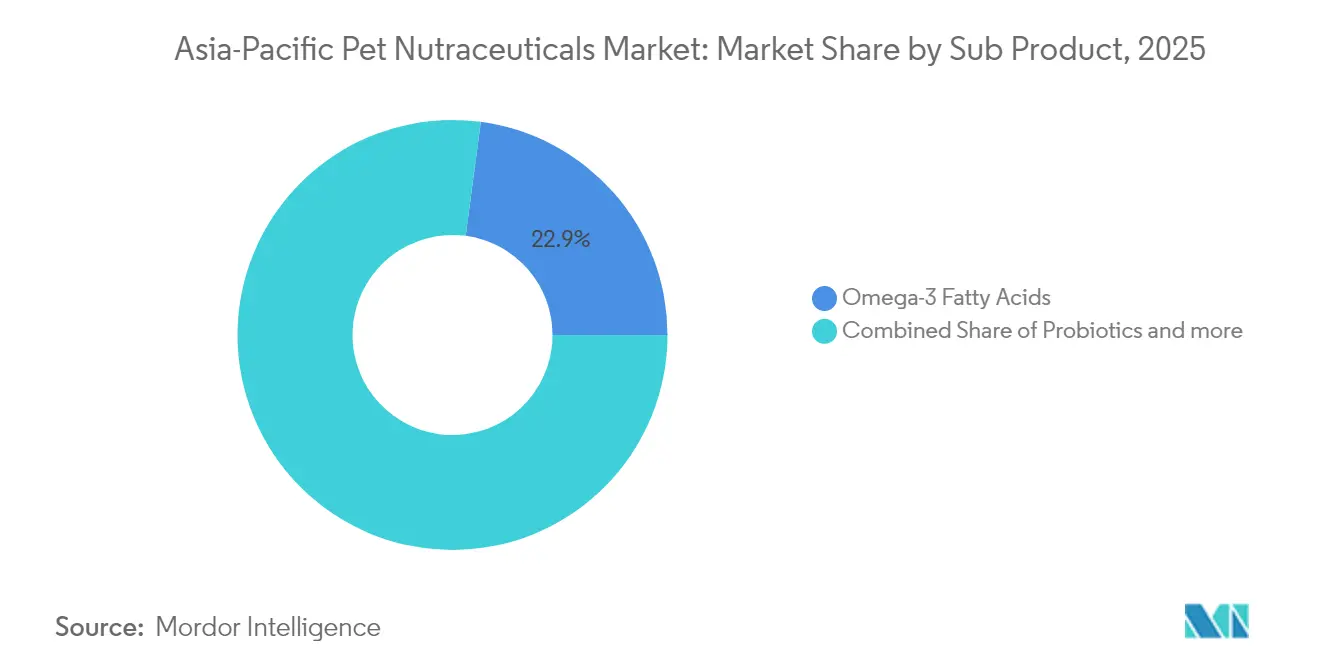
- By sub-product, omega-3 fatty acids led with 22.90% of the Asia-Pacific pet nutraceuticals market share in 2025 and retain the fastest growth outlook at 8.97% CAGR through 2031.
- By pets, dogs accounted for 55.70% of the Asia-Pacific pet nutraceuticals market size in 2025, while cats advanced at the highest 10.45% CAGR to 2031.
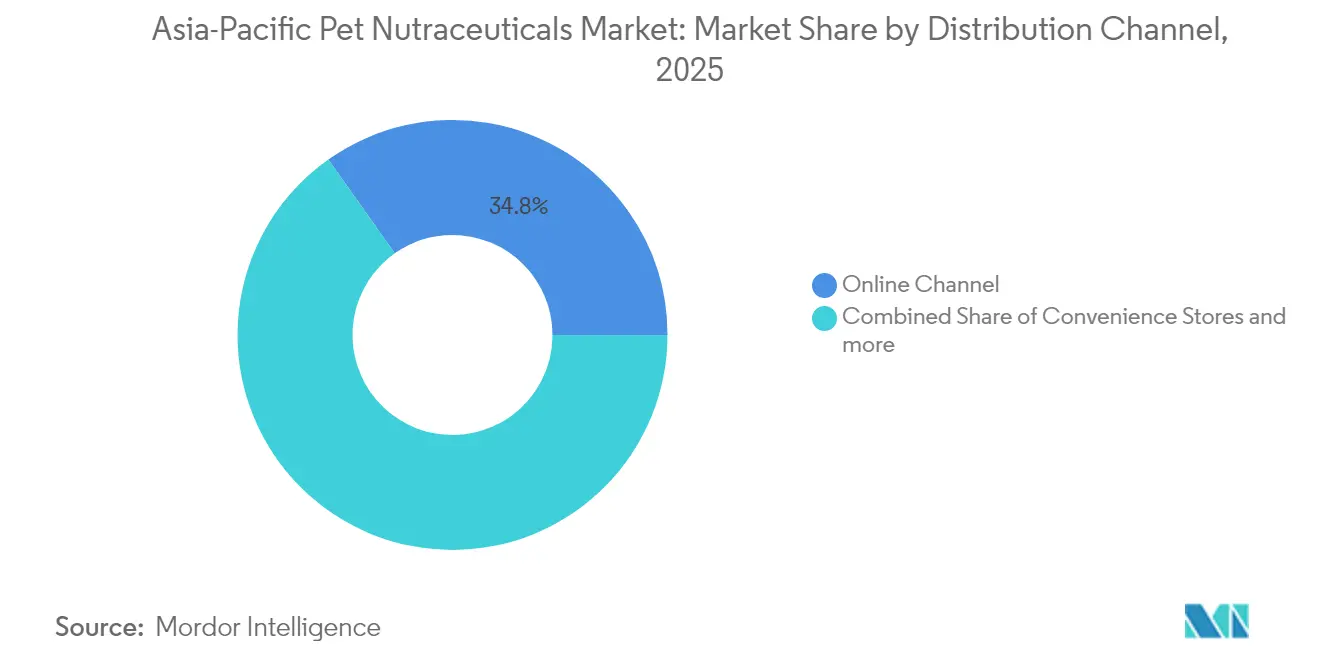
- By distribution channel, online platforms held 34.80% share of the Asia-Pacific pet nutraceuticals market size in 2025, and Specialty Stores retain the fastest growth outlook at 9.15% CAGR through 2031.
- By geography, China maintained 31.40% Asia-Pacific pet nutraceuticals market share in 2025, while Vietnam posts the quickest 11.25% CAGR through 2031.
- The Asia-Pacific pet supplement market exhibits a moderately fragmented structure, characterized by the presence of both global animal health conglomerates and specialized pet nutrition companies. Global players like Mars, Incorporated, EBOS Group Limited, ADM, Vetoquinol, and Alltech have held a market share of 25.7% in 2024
Note: Market size and forecast figures in this report are generated using Mordor Intelligence’s proprietary estimation framework, updated with the latest available data and insights as of 2026.
Asia-Pacific Pet Nutraceuticals Market Trends and Insights
Trends and Insights*
| Driver | (~) % Impact on CAGR Forecast | Geographic Relevance | Impact Timeline |
|---|---|---|---|
| Rising pet humanization and premiumization trend | +2.1% | China, Japan, and Australia | Long term (≥ 4 years) |
| Growth in e-commerce companion-animal channels | +1.8% | Southeast Asia, and Australia | Medium term (2-4 years) |
| Regulatory relaxation on functional ingredients | +1.2% | Asian, China | Medium term (2-4 years) |
| Veterinarian push for preventive health | +1.0% | Japan, Australia, and China | Long term (≥ 4 years) |
| Functional ingredient cost deflation | +0.8% | Regional | Short term (≤ 2 years) |
| Startup innovation in Asia-based D2C (Direct-to-customer) supplement brands | +0.5% | Urban China, Singapore, and Australia | Medium term (2-4 years) |
| Source: Mordor Intelligence | |||


Rising Pet Humanization and Premiumization Trend
Pet humanization trends across Asia-Pacific markets fundamentally reshape purchasing behaviors, with companion animals receiving healthcare investments comparable to family members. In Japan, per-pet annual food spending increased from Japanese Yen 21,650 (USD 142.45) in 2010 to Japanese Yen 37,272 (USD 245.25) in 2024, reflecting sustained premiumization that extends beyond basic nutrition into functional supplements [1]Source: Petfood Industry Asia Staff, “Japan Pet Food Spending Climbs Amid Premiumization,” Petfood Industry, petfoodindustry.com. This behavioral shift creates market receptivity for higher-priced nutraceuticals targeting specific health outcomes. Thai research demonstrates that health-conscious pet owners show a 53% likelihood of purchasing premium products versus 25% for non-health-conscious segments, indicating clear market segmentation opportunities.
Growth in E-Commerce Companion-Animal Channels
Digital commerce penetration eliminates traditional distribution barriers, enabling specialized nutraceutical brands to reach previously underserved markets across diverse geography. Australia's pet food market demonstrates this transformation, with online channels representing approximately 26% of total sales and carrying hundreds of freeze-dried SKUs compared to supermarkets' limited 18 SKU offerings. This channel expansion proves particularly valuable for nutraceuticals requiring educational content and veterinary endorsements, as platforms like Supertails integrate telehealth consultations with product sales, creating trust-building pathways that traditional retail cannot match.
Regulatory Relaxation on Functional Ingredients
Asian Traditional Medicines and Health Supplements Product Working Group creates standardized regulatory pathways through 10 core annexes, reducing time-to-market for novel functional ingredients across member countries. This harmonization particularly benefits algae-sourced omega-3 innovations, where companies like DSM-Firmenich launched DHAgold specifically for pet nutrition applications, offering supply chain stability compared to marine-sourced alternatives [2]Source: “dsm-firmenich Introduces DHAgold for Pet Nutrition,” dsm-firmenich, dsm-firmenich.com. China's Ministry of Agriculture and Rural Affairs registration requirements, while stringent, provide clear approval pathways for imported nutraceuticals meeting quality standards. The regulatory convergence enables multinational ingredient suppliers to achieve economies of scale across multiple Asia-Pacific markets simultaneously, reducing per-unit costs and accelerating innovation diffusion.
Veterinarian Push for Preventive Health
Veterinary professionals increasingly recommend preventive nutraceuticals as cost-effective alternatives to therapeutic interventions, creating professional endorsement channels that drive market acceptance. Clinical evidence supporting ingredients like PCSO-524 from New Zealand green-lipped mussel demonstrates efficacy comparable to NSAIDs (Nonsteroidal Anti-Inflammatory Drugs) for canine osteoarthritis, with peer-reviewed studies from Chulalongkorn University and other Asia-Pacific institutions building regional clinical credibility. This professional channel proves particularly valuable for complex formulations requiring dosage guidance and monitoring protocols.
Restraints Impact Analysis*
| Restraint | (~) % Impact on CAGR Forecast | Geographic Relevance | Impact Timeline |
|---|---|---|---|
| Ingredient price volatility | -1.5% | Asian cost-sensitive markets | Short term (≤ 2 years) |
| Limited clinical validation for Asian breeds | -0.8% | China, Japan, and Southeast Asia | Long term (≥ 4 years) |
| Fragmented distribution in emerging Asia-Pacific markets | -0.6% | Indonesia, Philippines, and Vietnam | Medium term (2-4 years) |
| Cultural resistance toward prophylactic supplements in certain countries | -0.4% | Rural Asia-Pacific regions | Long term (≥ 4 years) |
| Source: Mordor Intelligence | |||
Ingredient Price Volatility
Peruvian anchovy fisheries supply over 70% of global EPA and DHA, creating single-point-of-failure risks that manifest as price volatility across Asia-Pacific nutraceutical supply chains. The 2023 El Niño event severely reduced catch volumes, though 2024-2025 seasons show recovery patterns. This volatility particularly impacts cost-sensitive markets across Southeast Asia, where price elasticity remains high and consumers readily substitute products based on cost fluctuations. Marine-sourced omega-3 price swings force manufacturers to maintain dual-sourcing strategies or accept margin compression during supply shortages, creating competitive advantages for companies investing in algae-based alternatives that offer price stability and supply security.
Limited Clinical Validation for Asian Breeds
Research validation remains concentrated on Western dog breeds, creating evidence gaps for Asian-specific breeds that comprise significant market segments across China, Japan, and Southeast Asia. While studies demonstrate taurine deficiency patterns in Golden Retrievers fed grain-free diets, similar breed-specific research for Shiba Inus, Chow Chows, or other Asian breeds remains limited. This evidence gap constrains product development for breed-targeted formulations and limits veterinary confidence in recommending supplements for Asian breeds. Companies investing in breed-specific clinical trials could establish competitive moats, but the research investment requirements and regulatory approval timelines create barriers for smaller nutraceutical innovators seeking to enter Asia-Pacific markets with differentiated products.
*Our forecasts treat driver/restraint impacts as directional, not additive. The impact forecasts reflect baseline growth, mix effects, and variable interactions.
Segment Analysis
By Sub Product: Omega-3 Innovation Drives Market Leadership
Omega-3 fatty acids command 22.90% market share in 2025 while simultaneously achieving the fastest growth at 8.97% CAGR through 2031, reflecting both established market acceptance and ongoing innovation in sourcing and delivery mechanisms. This dual leadership position stems from breakthrough developments in microalgae cultivation, where companies like Corbion's AlgaPrime and DSM-Firmenich's DHAgold offer marine-equivalent EPA and DHA concentrations without supply chain volatilities associated with fish oil.
This segment's accelerated growth is driven by increasing awareness among pet owners about the multiple health benefits these supplements offer, including support for joint health, skin and coat maintenance, cognitive function, and cardiovascular health. The segment's growth is further bolstered by the rising trend of pet humanization and the increasing focus on preventive healthcare measures. Pet owners' growing understanding of omega-3 fatty acids in maintaining cell membrane structure and reducing health issues has made these supplements increasingly popular across the region.


By Pets: Dogs Dominance Meets Feline Growth Acceleration
Dogs maintain a commanding 55.70% market share in 2025, reflecting their larger population base and established supplement acceptance among pet owners across the Asia-Pacific markets. Clinical research demonstrates breed and species-specific supplement needs, with Golden Retrievers showing taurine deficiency patterns when fed grain-free diets, highlighting the importance of targeted nutritional interventions. The segment's dominance is further strengthened by dogs' higher dietary requirements and metabolic activity compared to other pets, necessitating more substantial nutritional supplementation. The higher consumption of nutraceuticals by dogs is also driven by their larger body size and greater muscle mass, requiring more proteins and essential nutrients. Additionally, the growing awareness among dog owners about preventive healthcare and the importance of nutritional supplements has contributed to the segment's market leadership.
Cats drive faster growth at 10.45% CAGR through 2031, indicating emerging recognition of feline-specific nutritional requirements and willingness to invest in specialized formulations. This growth differential reflects evolving veterinary understanding of species-specific metabolism, particularly regarding taurine requirements and cardiac health maintenance in felines. The segment's growth is further accelerated by the introduction of new, palatable nutraceutical products specifically formulated for cats, such as powders and mixers that address their unique nutritional needs. The rising awareness among cat owners about the importance of preventive healthcare and nutritional supplementation is also contributing to the segment's rapid expansion.
By Distribution Channel: Digital Transformation Reshapes Market Access
Online channels capture 34.80% market share in 2025 and grow at 8.95% CAGR through 2031, reflecting fundamental shifts in consumer purchasing behavior and the educational requirements inherent in nutraceutical sales. This channel dominance proves particularly pronounced in markets like Australia, where online platforms carry hundreds of specialized SKUs compared to traditional retail's limited offerings. Major e-commerce platforms like Boqii Holding Limited in China, Supertails in India, Pet Circle in Australia, and Taily Buddy in Thailand have played a crucial role in driving this segment's growth by offering diverse selections of pet dietary supplement brands and products. These platforms have further enhanced their value proposition by providing additional services such as grooming, training, and veterinary care consultations.
Specialty Stores retain the fastest growth outlook at 9.15% CAGR through 2031, catering to immediate purchase needs with their extended operating hours and accessible locations. These traditional brick-and-mortar channels maintain their relevance by offering personalized customer service, immediate product availability, and the ability to physically examine products before purchase, complementing the digital retail ecosystem in the region.Specialty stores represent a significant channel, offering expert guidance and specialized product knowledge to pet owners, along with premium and niche nutraceutical products that may not be readily available through other channels.
Geography Analysis
China's 31.40% market share in 2025 reflects both its massive pet population and rapid adoption of Western pet care practices. Regulatory frameworks under the Ministry of Agriculture and Rural Affairs create clear pathways for imported nutraceuticals, while domestic innovation accelerates through partnerships like China Pets' Wanpy brand collaboration with DSM for algal oil integration. E-commerce penetration reaches sophisticated levels, with platforms enabling same-day delivery of specialized supplements across major metropolitan areas.
Vietnam emerges as the fastest-growing market at 11.25% CAGR through 2031, driven by rising disposable incomes and cultural acceptance of preventive pet healthcare. The country's strategic position within Asian regulatory harmonization efforts creates advantages for companies seeking regional market entry, while local manufacturing capabilities support cost-effective distribution across Southeast Asia. Thailand shows particularly strong cultural acceptance, with 78% of health-conscious pet owners demonstrating willingness to purchase premium products, supported by social media influence and expert endorsements. The market demonstrates sophisticated product differentiation, with therapeutic foods and nutraceuticals targeting specific conditions like urinary tract and renal health gaining veterinary acceptance. Australia combines high per-pet spending with advanced e-commerce adoption, creating favorable conditions for specialized nutraceutical brands to achieve market penetration through digital channels.
Competitive Landscape
The Asia-Pacific pet supplement market exhibits a moderately fragmented structure, characterized by the presence of both global animal health conglomerates and specialized pet nutrition companies. Global players like Mars, Incorporated, EBOS Group Limited, ADM, Vetoquinol, and Alltech have held a market share of 25.7% in 2024 and are leveraging their extensive research capabilities, established brand portfolios, and widespread distribution networks to maintain significant market positions. These companies benefit from their ability to offer comprehensive pet care solutions and invest heavily in product development and marketing initiatives. Local players, while smaller in scale, maintain competitive positions in specific regional markets through their understanding of local preferences and established relationships with veterinary clinics and pet stores.
The market is witnessing increasing consolidation through strategic acquisitions and partnerships, particularly as global players seek to strengthen their presence in emerging markets. Companies are acquiring local manufacturers and distributors to gain immediate market access and expand their product offerings. Joint ventures and partnerships with research institutions and technology providers are becoming more common, enabling companies to enhance their innovation capabilities and develop advanced nutritional solutions. The competitive dynamics are further influenced by the entry of new players, particularly those focusing on natural and premium pet nutritional supplements.
Strategic patterns reveal technology-driven differentiation, with companies like dsm-firmenich investing in algae-sourced omega-3 alternatives that offer supply chain stability compared to marine-sourced ingredients. Emerging disruptors leverage digital channels and personalized nutrition approaches, exemplified by companies offering gene-custom supplements that achieved ¥900 million (USD 5.92 million) in China's market during 2024. The competitive landscape increasingly rewards companies that combine clinical validation with innovative delivery mechanisms, as demonstrated by PCSO-524 and EAB-277 formulations showing efficacy comparable to NSAIDs (Nonsteroidal Anti-Inflammatory Drugs) in peer-reviewed studies from regional academic institutions [3]Source: “Antinol Studies,” antinolstudies.com .
Asia-Pacific Pet Nutraceuticals Industry Leaders
Mars, Incorporated
ADM
Vetoquinol
EBOS Group Limited
Alltech
- *Disclaimer: Major Players sorted in no particular order

Recent Industry Developments
- April 2023: Mars Incorporated opened its first pet food research and development center in the Asia-Pacific region. This new facility, called the Asia-Pacific pet center, will support the company's product development.
- March 2023: Virbac launched its hyper-premium physiology range in India. It is available in leading veterinary clinics and key pet shops across eight cities in India.
- February 2023: ADM opened its new probiotics and postbiotics production facility in Spain. The facility will supply these supplements to Asia-Pacific and other region.


Asia-Pacific Pet Nutraceuticals Market Report Scope
Milk Bioactives, Omega-3 Fatty Acids, Probiotics, Proteins and Peptides, Vitamins and Minerals are covered as segments by Sub Product. Cats, Dogs are covered as segments by Pets. Convenience Stores, Online Channel, Specialty Stores, Supermarkets/Hypermarkets are covered as segments by Distribution Channel. Australia, China, India, Indonesia, Japan, Malaysia, Philippines, Taiwan, Thailand, Vietnam are covered as segments by Country.
Sub Product
| Milk Bioactives |
| Omega-3 Fatty Acids |
| Probiotics |
| Proteins and Peptides |
| Vitamins and Minerals |
| Other Nutraceuticals |
Pets
| Cats |
| Dogs |
| Other Pets |
Distribution Channel
| Convenience Stores |
| Online Channel |
| Specialty Stores |
| Supermarkets/Hypermarkets |
| Other Channels |
Country
| Australia |
| China |
| India |
| Indonesia |
| Japan |
| Malaysia |
| Philippines |
| Taiwan |
| Thailand |
| Vietnam |
| Rest of Asia-Pacific |
| Sub Product | Milk Bioactives |
| Omega-3 Fatty Acids | |
| Probiotics | |
| Proteins and Peptides | |
| Vitamins and Minerals | |
| Other Nutraceuticals | |
| Pets | Cats |
| Dogs | |
| Other Pets | |
| Distribution Channel | Convenience Stores |
| Online Channel | |
| Specialty Stores | |
| Supermarkets/Hypermarkets | |
| Other Channels | |
| Country | Australia |
| China | |
| India | |
| Indonesia | |
| Japan | |
| Malaysia | |
| Philippines | |
| Taiwan | |
| Thailand | |
| Vietnam | |
| Rest of Asia-Pacific |


Market Definition
- FUNCTIONS - Pet foods are usually intended to provide complete and balanced nutrition to the pet but are primarily used as functional products. The scope includes the food and supplements consumed by pets including veterinary diets. Supplements/nutraceuticals that are directly supplied to pets are considered within the scope.
- RESELLERS - Companies engaged in reselling of pet food without value addition have been excluded from the market scope, in order to avoid double counting.
- END CONSUMERS - Pet owners are considered to be the end-consumers in the market studied.
- DISTRIBUTION CHANNELS - Supermarkets/hypermarkets, specialty stores, convenience stores, online channels and other channels are considered within the scope. The stores which are exclusively providing pet related basic and custom products are considered within the scope of specialty stores.
| Keyword | Definition |
|---|---|
| Pet Food | The scope of pet food includes the food that is eatable by pets including food, treats, veterinary diets, and nutraceuticals/supplements. |
| Food | Food is animal feed intended for consumption by pets. It is formulated to provide essential nutrients and meet the dietary needs of various types of pets, including dogs, cats, and other animals. These are generally segmented into dry and wet pet foods. |
| Dry Pet Food | Dry pet foods may be extruded/baked (kibbles) or flaked. They have a lower moisture content, typically around 12-20%. |
| Wet Pet Food | Wet pet food, also known as canned pet food or moist pet food, generally has a higher moisture content compared to dry pet food, often ranging from 70-80%. |
| Kibbles | Kibbles are dry, processed pet food in small, bite-sized pieces or pellets. They are specifically formulated to provide balanced nutrition for various domestic animals, such as dogs, cats, and other animals. |
| Treats | Pet Treats are special food items or rewards given to pets, to show affection, and encourage good behavior. They are especially used during training. Pet treats are made from various combinations of meat or meat-derived materials with other ingredients. |
| Dental Treats | Pet dental treats are specialized treats that are formulated to promote good oral hygiene in pets. |
| Crunchy Treats | It is a type of pet treat that has a firm and crispy texture which can be a good source of nutrition for pets. |
| Soft and chewy treats | Soft and Chewy pet treats are a type of pet food product that is formulated to be easy to chewy and digest. They are usually made from soft and pliable ingredients, such as meat, poultry, or vegetables, that have been blended and formed into bite-sized pieces or strips. |
| Freeze-dried & Jerky Treats | Freeze-dried and jerky treats are snacks given to pets, that are prepared through a special preservation process, without damaging the nutritional content, resulting in long-lasting, nutrient-rich treats. |
| Urinary Tract Disease Diets | These are commercial diets that are specifically formulated to promote urinary health and reduce the risk of urinary tract infections and other urinary problems. |
| Renal Diets | These are specialized pet foods formulated to support the health of pets with kidney disease or renal insufficiency. |
| Digestive Sensitivity Diets | Digestive-sensitive diets are specially formulated to meet the nutritional needs of pets with digestive issues such as food intolerances, allergies, and sensitivities. These diets are designed to be easily digestible and to reduce the symptoms of digestive problems in pets. |
| Oral Care Diets | Oral care diets for pets are specially formulated diets produced to promote oral health and hygiene in pets. |
| Grain-Free Pet Food | Pet food that does not contain common grains like wheat, corn, or soy. Grain-free diets are often preferred by pet owners seeking alternative options or if their pets have specific dietary sensitivities. |
| Premium Pet Food | High-quality pet food formulated with superior ingredients often offers additional nutritional benefits compared to standard pet food. |
| Natural Pet Food | Pet food made from natural ingredients, with minimal processing and without artificial preservatives. |
| Organic Pet Food | Pet food is produced using organic ingredients, free from synthetic pesticides, hormones, and genetically modified organisms (GMOs). |
| Extrusion | A manufacturing process used to produce dry pet food, where ingredients are cooked, mixed, and shaped under high pressure and temperature. |
| Other Pets | Other pets include birds, fish, rabbits, hamsters, ferrets, and reptiles. |
| Palatability | The taste, texture, and aroma of pet food influence its appeal and acceptance by pets. |
| Complete and Balanced Pet Food | Pet food that provides all essential nutrients in appropriate proportions to meet the nutritional needs of pets without additional supplementation. |
| Preservatives | These are the substances that are added to pet food to extend its shelf life and prevent spoilage. |
| Nutraceuticals | Food products that offer health benefits beyond basic nutrition, often contain bioactive compounds with potential therapeutic effects. |
| Probiotics | Live beneficial bacteria that promote a healthy balance of gut flora, supporting digestive health and immune function in pets. |
| Antioxidants | Compounds that help neutralize harmful free radicals in the body, promoting cellular health and supporting the immune system in pets. |
| Shelf-Life | The duration of which pet food remains safe and nutritionally viable for consumption after its production date. |
| Prescription diet | Specialized pet food formulated to address specific medical conditions under veterinary supervision. |
| Allergen | A substance that can cause allergic reactions in some pets, leading to food allergies or sensitivities. |
| Canned food | Wet pet food that is packed in cans and contains higher moisture content than dry food. |
| Limited ingredient diet (LID) | Pet food formulated with a reduced number of ingredients to minimize potential allergens. |
| Guaranteed Analysis | The minimum or maximum levels of certain nutrients present in pet food. |
| Weight management | Pet food designed to help pets maintain a healthy weight or support weight loss efforts. |
| Other Nutraceuticals | It includes prebiotics, antioxidants, digestive fiber, enzymes, essential oils and herbs. |
| Other Veterinary Diets | It includes weight management diets, skin and coat health, cardiac care, and joint care. |
| Other Treats | It includes rawhides, mineral blocks, lickables, and catnips. |
| Other Dry Foods | It includes cereal flakes, mixers, meal toppers, freeze-dried foods, and air-dried foods. |
| Other Animals | It includes birds, fish, reptiles, and small animals (rabbits, ferrets, hamsters). |
| Other Distribution Channels | It includes veterinary clinics, local unregulated stores, and feed and farm stores. |
| Proteins and Peptides | Proteins are large molecules composed of basic units called amino acids which help in the growth and development of pets. Peptides are the short string of 2 to 50 amino acids. |
| Omega-3 fatty acids | Omega-3 fatty acids are essential polyunsaturated fats that play a crucial role in the overall health and well-being of Pets |
| Vitamins | Vitamins are the essential organic compounds that are essential for vital physiological functioning. |
| Minerals | Minerals are naturally occurring inorganic substances that are essential for various physiological functions in pets. |
| CKD | Chronic Kidney Disease |
| DHA | Docosahexaenoic Acid |
| EPA | Eicosapentaenoic Acid |
| ALA | Alpha-linolenic Acid |
| BHA | Butylated Hydroxyanisol |
| BHT | Butylated Hydroxytoluene |
| FLUTD | Feline Lower Urinary Tract Disease |


Research Methodology
Mordor Intelligence follows a four-step methodology in all our reports.
- Step-1: IDENTIFY KEY VARIABLES: In order to build a robust forecasting methodology, the variables and factors identified in Step-1 are tested against available historical market numbers. Through an iterative process, the variables required for market forecast are set and the model is built on the basis of these variables.
- Step-2: Build a Market Model: Market-size estimations for the forecast years are in nominal terms. Inflation is not a part of the pricing, and the average selling price (ASP) is kept constant throughout the forecast period.
- Step-3: Validate and Finalize: In this important step, all market numbers, variables and analyst calls are validated through an extensive network of primary research experts from the market studied. The respondents are selected across levels and functions to generate a holistic picture of the market studied.
- Step-4: Research Outputs: Syndicated Reports, Custom Consulting Assignments, Databases & Subscription Platforms


