Market Overview
| Study Period | 2021 - 2031 |
|---|---|
| Forecast Data Period | 2026 - 2031 |
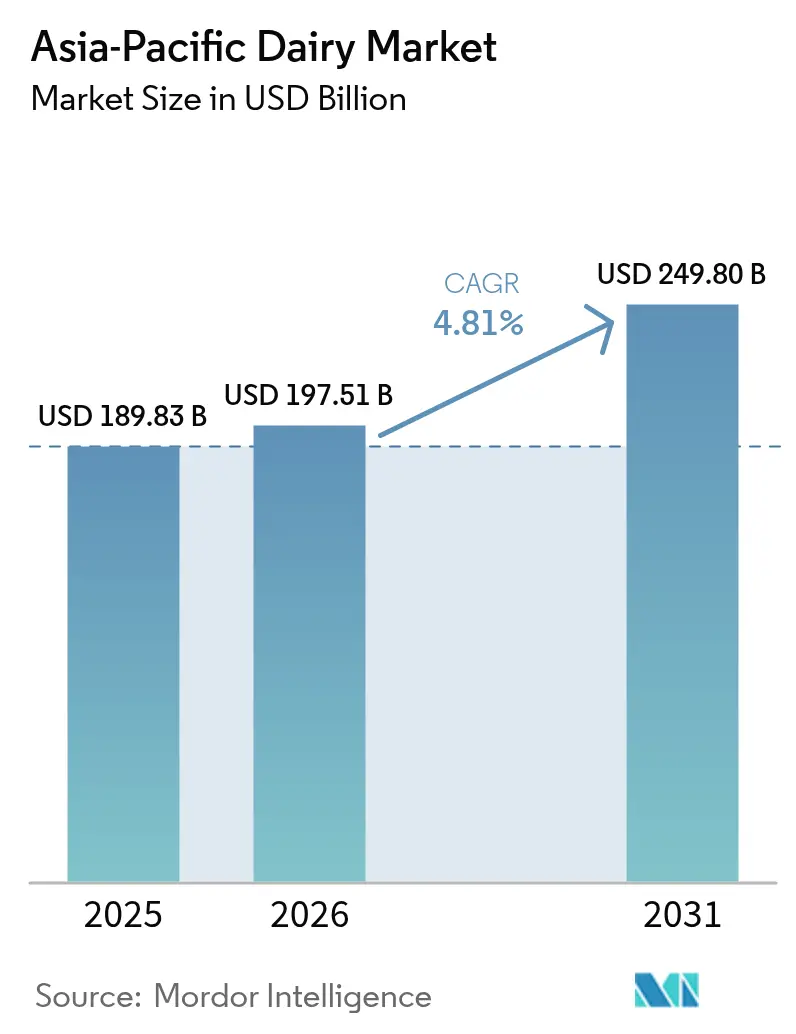
| Base Year Market Size (2025) | USD 189.83 Billion |
| Market Size (2026) | USD 197.51 Billion |
| Market Size (2031) | USD 249.80 Billion |
| Growth Rate (2026 - 2031) | 4.81% CAGR |
| Market Concentration | Medium |
Major Players
*Disclaimer: Major Players sorted in no particular order Image © Mordor Intelligence. Reuse requires attribution under CC BY 4.0. |
|
Asia-Pacific Dairy Market Analysis by Mordor Intelligence
The Asia-Pacific dairy market size was USD 189.83 billion in 2025 and is expected to reach USD 197.51 billion in 2026, and then to USD 249.80 billion by 2031, registering a CAGR of 4.81% between 2026 and 2031. This trajectory reflects structural shifts rather than simple volume accumulation. Urbanization in China pushed per capita dairy consumption from 36.1 kg in 2019 to 42.3 kg by 2024, while India's production base swelled to 230 million tonnes in 2024, cementing its position as the world's largest milk producer [1]Source: National Dairy Development Board, "ABOUT NDDB", nddb.coop. In contrast to mature Western markets, where premiumization fuels incremental gains, the region sees its revenue largely driven by first-time adoption and category expansion. As consumers shift from plain milk to enhanced products like drinkable yogurt, lactose-free UHT milk, and high-protein whey concentrates, average selling prices rise, providing producers a buffer against input-cost fluctuations. Additionally, with the rise of omnichannel distribution, especially e-commerce's temperature-controlled last-mile delivery, previously dormant demand has transformed into consistent repeat purchases. The competitive landscape remains balanced, enabling both cooperatives and multinationals to invest in premium SKUs without igniting destructive price wars.
Key Report Takeaways
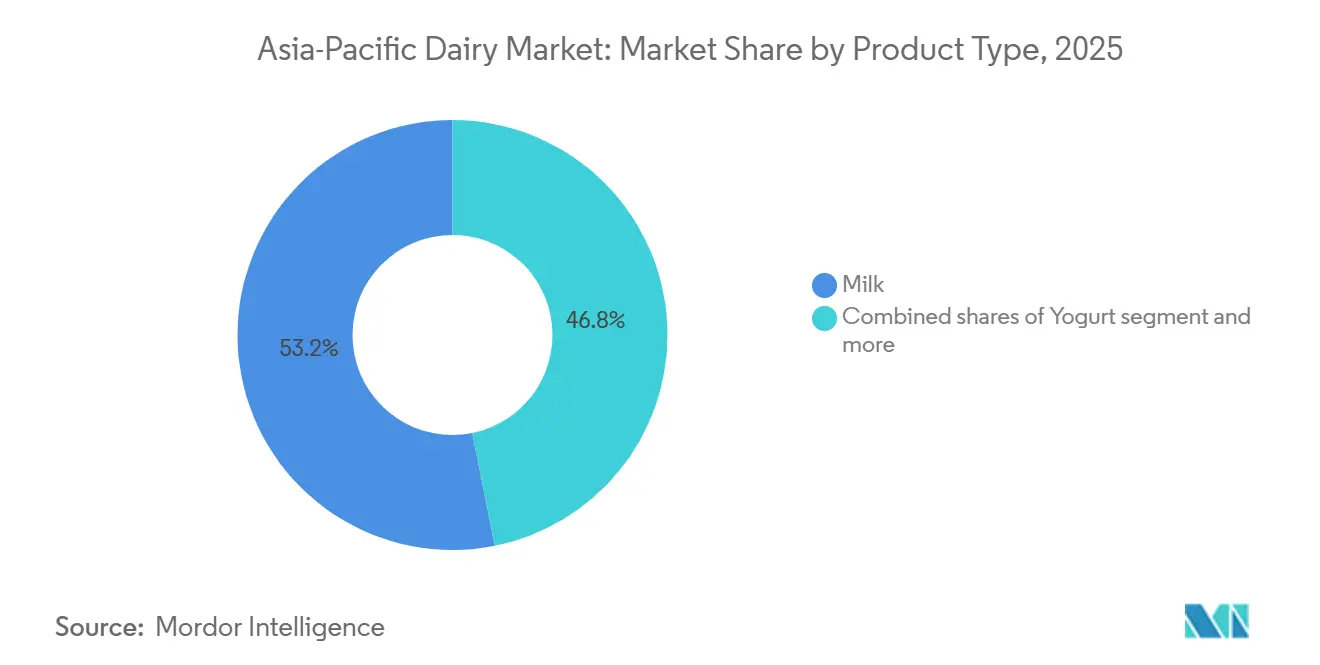
- By product type, milk commanded 53.19% of the Asia-Pacific dairy market share in 2025, while yogurt recorded the fastest 5.02% CAGR through 2031.
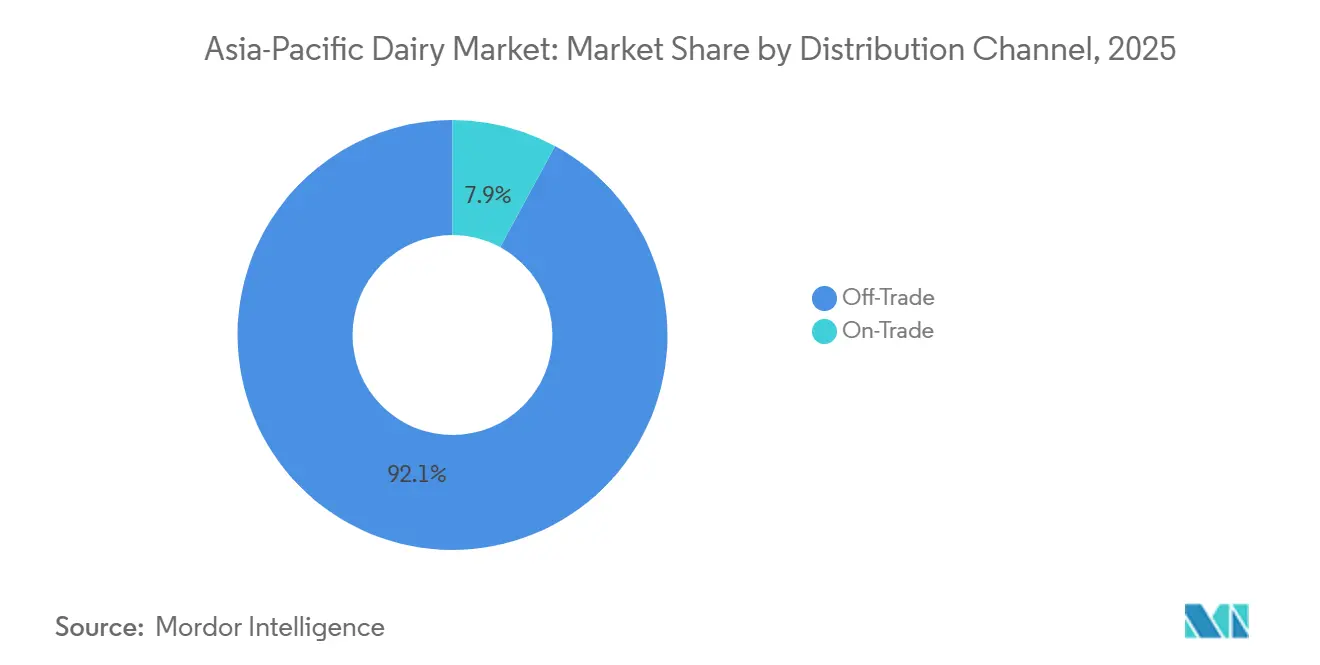
- By distribution channel, off-trade outlets held 92.01% revenue share of the Asia-Pacific dairy market size in 2025, whereas on-trade sales are advancing at a 5.21% CAGR to 2031.
- By geography, India contributed 51.22% of the 2025 value, yet China is projected to post a 5.74% CAGR, the highest among major markets.
Note: Market size and forecast figures in this report are generated using Mordor Intelligence’s proprietary estimation framework, updated with the latest available data and insights as of 2026.
Asia-Pacific Dairy Market Trends and Insights
Drivers Impact Analysis*
| Driver | (~) % Impact on CAGR Forecast | Geographic Relevance | Impact Timeline |
|---|---|---|---|
| Innovative processing techniques propel sector into premium categories | +0.8% | China, India, Southeast Asia | Medium term (2-4 years) |
| Strategic promotions boost nutritional awareness and sales | +0.7% | India, China, Indonesia | Short term (≤ 2 years) |
| Dairy products secure their place as a staple food | +0.9% | India, China, Vietnam | Long term (≥ 4 years) |
| Modern retail expands product accessibility and variety | +0.8% | Urban centers across APAC (Asia-Pacific) | Medium term (2-4 years) |
| Urbanization drives a shift towards western lifestyle trends | +0.9% | China, India, Indonesia, Vietnam | Long term (≥ 4 years) |
| Eased trade barriers pave the way for foreign market entry | +0.5% | ASEAN, India, Australia | Long term (≥ 4 years) |
| Source: Mordor Intelligence | |||
Innovative processing techniques propel sector into premium categories
Thanks to aseptic packaging and enzyme engineering, categories once thought unsuitable for tropical climates are now thriving. Tetra Pak's 2024 innovation in mascarpone technology boasts an impressive 8-month shelf life without refrigeration. This breakthrough paves the way for Italian-style desserts to make their debut in the Indonesian and Philippine markets, even with their inconsistent cold chains. In 2024, China's Yili rolled out lactose-free UHT milk, harnessing microbial lactase, and successfully wooed consumers who had shunned dairy in the past. Meanwhile, membrane filtration has achieved an 80% purity concentration of whey protein on a large scale, fueling the surging sports-nutrition market in Japan and South Korea. These technological strides not only enhance product preservation but also challenge and expand the definition of "dairy" in regions historically dominated by traditional fermentation and fresh consumption.
Strategic promotions boost nutritional awareness and sales
Government-backed campaigns and corporate nutrition initiatives are reshaping consumption norms. In 2024, India's National Dairy Development Board rolled out school milk programs, reaching 12 million children. This initiative aims to embed dairy as a daily staple in children's diets, rather than viewing it as a luxury. Nestlé India's "Nestlé a+ Nourish" campaign linked fortified milk to cognitive development. By leveraging endorsements from pediatricians, Nestlé successfully influenced purchasing decisions among the middle class. In Vietnam, Vinamilk collaborated with maternal health clinics, promoting yogurt as a vital component of prenatal nutrition. This strategy boosted sales in provinces where dairy consumption was previously minimal. These initiatives effectively tackle skepticism. Many Asian consumers still view milk primarily as a childhood staple or a remedy for illness, rather than recognizing its benefits for adult wellness.
Dairy products secure their place as a staple food
In Asia, dairy has transitioned from an occasional treat to a daily staple. In 2024, India's per capita dairy intake hit 459 grams daily, outpacing egg consumption and nearing global averages. Meanwhile, urbanization in China spurred a rise in dairy consumption from 36.1 kg in 2019 to 42.3 kg in 2024. This isn't just a fleeting trend; it's a fundamental shift. Breakfast cereals, café culture, and Western fast-food chains are now seamlessly incorporating milk, yogurt, and cheese into meals. In Vietnam, a dairy cooperative model that consolidates smallholder outputs and ensures pricing has led to year-round fresh milk availability in stores, a remarkable achievement compared to a decade ago. This evolution, from viewing dairy as a "foreign food" to recognizing it as an "everyday staple," signals robust long-term growth.
Modern retail expands product accessibility and variety
Supermarkets and e-commerce platforms have broken down distribution barriers, making dairy products accessible to a broader audience in Asia. In China, Hema Fresh stores, run by Alibaba, have implemented real-time inventory systems, allowing them to restock yogurt within just 2 hours. This not only minimizes spoilage but also broadens their product range. As a result, shoppers in Shenzhen now enjoy a selection of 47 yogurt variants, a significant jump from the 12 offered by traditional grocers. Meanwhile, in India, Reliance Retail has expanded its chilled dairy offerings to 1,200 stores in 2024. This move introduces branded cheese and butter to tier-2 cities, filling a gap left by local shops that lacked refrigeration. Furthermore, online platforms like BigBasket and JD.com are now managing temperature-controlled deliveries, ensuring premium dairy imports reach consumers even outside major metropolitan areas. This transformation in infrastructure is pivotal; it turns previously unfulfilled consumer interest in dairy into actual sales.
Restraints Impact Analysis*
| Restraint | (~) % Impact on CAGR Forecast | Geographic Relevance | Impact Timeline |
|---|---|---|---|
| Lactose intolerance limits market penetration efforts | -0.6% | East Asia, South Asia, Southeast Asia | Long term (≥ 4 years) |
| Regulatory disparities create notable trade frictions | -0.4% | ASEAN, India, China | Medium term (2-4 years) |
| Swift demand surge tests supply chain maturity | -0.5% | India, Indonesia, Vietnam | Medium term (2-4 years) |
| Immature cold chain compromises product quality | -0.5% | India, Indonesia, Philippines | Medium term (2-4 years) |
| Source: Mordor Intelligence | |||
Lactose intolerance limits market penetration efforts
In Asia, the genetic prevalence of lactase non-persistence highlights a significant challenge: 90% of East Asians, 70% of South Asians, and 60% of Southeast Asians face discomfort with unmodified dairy. While enzyme-treated milk and plant-based dairy alternatives provide solutions, they also fragment the market and dilute brand loyalty. For instance, a consumer transitioning to oat milk completely exits the dairy value chain. This challenge is intensified in Japan, where an aging population sees a natural decline in lactase production, leading many seniors to seek calcium-fortified substitutes. Companies are now compelled to invest in reformulating their products and educating consumers. However, these efforts come at a cost, eating into profit margins without a guaranteed shift in consumer behavior. Given that the challenge is rooted in biology rather than behavior, traditional marketing strategies alone may fall short.
Regulatory disparities create notable trade frictions
Divergent food-safety standards and import protocols force multinationals to operate parallel supply chains. India's FSSAI mandates specific fat percentages for "cheese," disqualifying European PDO variants that use different milk blends, while China's CFDA requires re-registration for every formulation tweak, delaying launches by 18 months[2]Source: FSSAI, "Mandates on specific fat percentages", fssai.gov.in. ASEAN's mutual recognition agreements are still a work in progress. As a result, yogurt approved in Thailand might undergo lab testing again in Indonesia. Such regulatory frictions have influenced Fonterra's decision to expand its UHT cream plant in New Zealand, steering clear of Southeast Asia. By centralizing production in New Zealand, Fonterra navigates a singular regulatory landscape, streamlining compliance, even if it incurs higher shipping costs. While RCEP's harmonization efforts promise to ease these barriers by 2028, for now, the landscape favors established players with strong local lobbying influence.
*Our forecasts treat driver/restraint impacts as directional, not additive. The impact forecasts reflect baseline growth, mix effects, and variable interactions.
Segment Analysis
By Product Type: Yogurt Outpaces Traditional Milk in Growth
In 2025, milk commanded a dominant 53.19% share of product-type value, buoyed by India's robust liquid consumption and China's stronghold on UHT. However, yogurt's impressive 5.02% CAGR projected through 2031 hints at a burgeoning wave of premiumization. Probiotic strains, notably Lactobacillus casei and Bifidobacterium lactis, have elevated yogurt from a mere health food to a sought-after functional beverage. In 2024, drinkable yogurt formats made a significant dent in China's yogurt sales. While cheese remains underpenetrated in the market, processed variants dominate retail sales. This trend underscores a limited culinary use, primarily in pizzas and sandwiches. Yet, there's a notable surge in foodservice demand, with restaurants and quick-service outlets now accounting for the bulk of China's cheese consumption, as highlighted by the China Dairy Industry Association. As bakery chains expand, butter and cream categories witness steady growth. However, the nation grapples with an import dependence, stemming from a domestic butterfat supply shortfall.
Year-round consumption in tropical climates fuels the popularity of dairy desserts, especially ice cream. Premium single-serve formats are making waves in convenience stores. In urban China, traditional Central Asian sour milk drinks are undergoing a transformation. Leveraging their kefir and kumis heritage, they're being marketed as modern gut-health beverages. In rural areas, where refrigeration is a luxury, condensed and powdered milk reign as pantry staples. Yet, as cold chain logistics improve, fresh and UHT variants are slowly taking their place. Innovations are reshaping the landscape; Mengniu's 2024 debut of a yogurt-cheese hybrid caters to those desiring protein without the culinary hassle. Meanwhile, flavored milk is evolving, with turmeric and matcha variants crafted for local tastes. The dairy industry is witnessing a paradigm shift: the transition from commodity milk to value-added products is not just a trend but a definitive move. Companies clinging to plain white milk risk losing out, as those innovating with functional, convenient, and culturally attuned products seize the margins. Regulatory bodies like FSSAI in India and CFDA in China play a dual role. While they ensure product safety, their stringent compliance costs create hurdles, favoring larger players equipped with in-house testing labs.


By Distribution Channel: On-Trade Gains as Cafés and QSRs Multiply
In 2025, off-trade channels captured a dominant 92.01% of the distribution share, largely thanks to supermarkets, hypermarkets, and e-commerce platforms. These platforms not only offer refrigeration and a diverse range of products but also emphasize price transparency. However, the on-trade sector, with a projected CAGR of 5.21% through 2031, signals a shift in Asian consumption patterns. Establishments like coffee shops, bubble tea outlets, and quick-service restaurants have emerged as primary touchpoints for the younger generation. For instance, Starbucks China, sourcing a hefty 180,000 tonnes of milk annually, is pivotal in introducing millions to lattes and cappuccinos, a departure from their traditional tea preference. Moreover, convenience stores such as 7-Eleven and FamilyMart are strategically placing chilled yogurt and flavored milk at checkout counters, turning what was once an impulse buy into a regular habit.
While specialist retailers, organic grocers, and health-food chains maintain a niche presence, their influence is undeniable. They curate artisanal cheeses and probiotic yogurts, setting the gold standard for quality. Meanwhile, warehouse clubs like Metro Cash & Carry are reshaping the landscape for foodservice buyers, offering bulk formats that challenge traditional distributors. The rise of the on-trade sector is not just a market trend; it's a cultural shift. Dairy products are becoming integral to social rituals, whether it's meeting friends at a café or grabbing a post-gym smoothie. This cultural embedding provides a buffer against economic downturns; while consumers might skip a grocery trip, their morning coffee remains non-negotiable. As a result, distribution strategies are evolving, emphasizing omnichannel integration. Retail packs now feature QR codes, granting access to recipes or loyalty points, effectively merging the off-trade purchase experience with on-trade engagement.
Geography Analysis
In 2025, India held a commanding 51.22% share of the regional dairy market, thanks to its annual production of 230 million tonnes and deep-rooted consumption habits tied to cuisine, religion, and daily nutrition. Amul's cooperative model, uniting 3.6 million smallholder farmers, guarantees stable procurement and bolsters rural incomes. Meanwhile, urban-centric private players like Nestlé India and Danone capitalize on branded, value-added products to command premium prices. With per capita consumption at 459 grams per day in 2024, still below global averages, there's evident growth potential as incomes rise and cold chains extend into rural areas. The National Dairy Plan, under government auspices, seeks to elevate productivity through genetic enhancements and optimized feeding, aiming for a target of 300 million tonnes by 2030.
China, boasting a 5.74% CAGR through 2031, emerges as the fastest-growing major player, fueled by urbanization, 65% of its populace now resides in cities, and rising disposable incomes that tilt towards premium products. In 2024, domestic production hit 41 million tonnes, yet significant imports, especially of cheese, butter, and infant formula, underscore quality perceptions and existing supply gaps. The dairy belt, spanning Inner Mongolia and Heilongjiang provinces, thrives on mechanized farming and superior genetics. Notably, China Shengmu made headlines by importing 8,100 Australian Holstein cows in 2024, a move aimed at elevating herd quality. With food-security concerns at the forefront, the government is aggressively pushing for self-sufficiency, channeling investments into expansive farms and processing facilities. However, environmental challenges related to water and land usage loom large, potentially stunting this expansion.
In the mature markets of Japan and Australia, growth is driven by innovation rather than sheer volume. Japan grapples with an aging populace and stagnant birth rates, compressing overall demand. Yet, niche segments like functional dairy, probiotic yogurts, and calcium-fortified milk are thriving, commanding premium prices. Industry giants Meiji and Morinaga are at the forefront, leading in research and development. Across the Tasman Sea, Australia's dairy sector, heavily export-oriented, recorded shipments worth AUD 3.2 billion in 2024, predominantly heading to China and Southeast Asia. However, challenges loom large: drought conditions and labor shortages, as highlighted by Dairy Australia, are constraining production. Meanwhile, the broader Asia-Pacific region, with nations like Vietnam, Indonesia, Thailand, and the Philippines, showcases immense growth potential, buoyed by youthful demographics and currently low consumption rates.
Competitive Landscape
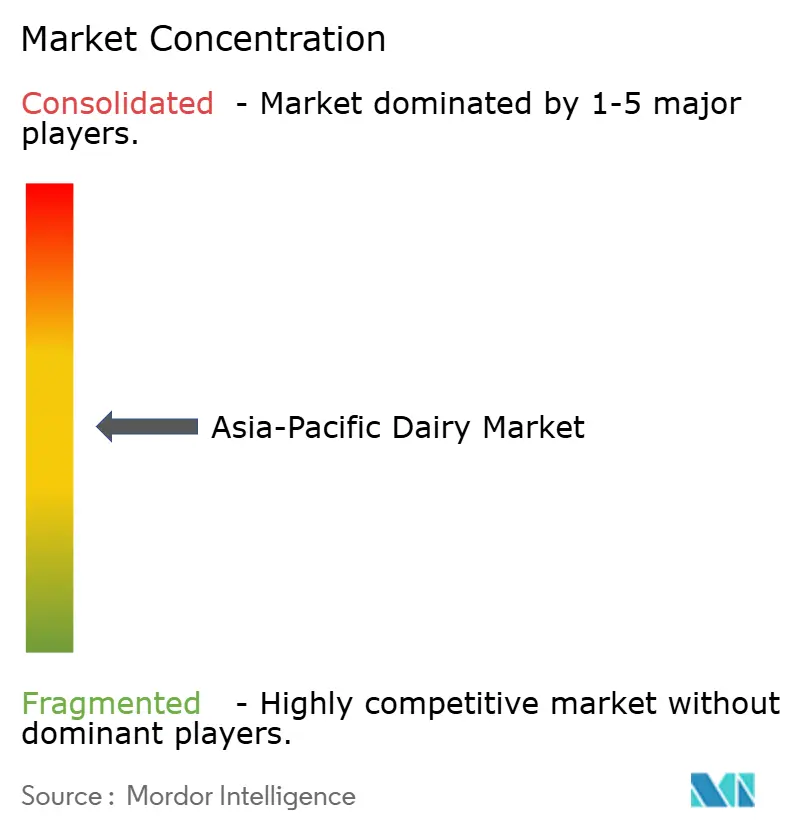
The Asia-Pacific dairy market exhibits moderate concentration, indicating a balance between dominant incumbents and agile challengers. Cooperatives like Amul and Fonterra wield structural advantages, farmer networks that ensure raw-milk supply and brand equity built over decades, while multinationals such as Nestlé, Danone, and FrieslandCampina leverage global R&D pipelines and premium positioning. Major market players include Gujarat Co-operative Milk Marketing Federation Ltd, Fonterra Co‑operative Group Limited, Inner Mongolia Mengniu Dairy (Group) Co., Ltd. (Mengniu), Nestlé S.A., and Danone S.A., among others.
Chinese giants Yili and Mengniu have scaled aggressively, with Mengniu's acquisition of Bellamy's Organic for AUD 1.5 billion (USD 1.0 billion) securing a foothold in infant formula, a category where trust and traceability command outsized margins. Strategy patterns cluster around three axes: geographic expansion into underpenetrated markets, premiumization through functional ingredients, and vertical integration to control quality from farm to shelf. Opportunities abound in categories like cheese and butter, where per capita consumption remains a fraction of Western levels, and in distribution channels like e-commerce and on-trade, where first-mover advantages persist.
Emerging disruptors include plant-dairy hybrids and enzyme-treated variants that address lactose intolerance without sacrificing taste, as well as direct-to-consumer brands bypassing traditional retail. Technology adoption is accelerating, Fonterra's digital traceability platform, launched in 2024, uses blockchain to verify milk provenance, appealing to quality-conscious Chinese consumers. Regulatory compliance remains a competitive moat; companies with ISO 22000 certification and FSSAI approvals can command shelf space and price premiums that smaller players cannot match. The sector's trajectory favors those who balance scale efficiencies with localized innovation, as homogeneous global brands struggle against regional tastes and purchasing power disparities.
Asia-Pacific Dairy Industry Leaders
-
Fonterra Co‑operative Group Limited
-
Inner Mongolia Mengniu Dairy (Group) Co., Ltd. (Mengniu)
-
Nestlé S.A.
-
Danone S.A.
-
Gujarat Co-operative Milk Marketing Federation Ltd.
- *Disclaimer: Major Players sorted in no particular order

Recent Industry Developments
- January 2026: China’s Yili Group held strategic partner conferences across Southeast Asia to deepen regional dairy cooperation and expand market reach for its dairy portfolio. Yili, expanding its global presence, is making significant strides in Southeast Asia and beyond, collaborating with partners to redefine the future of the global dairy sector.
- June 2025: France’s No. 1 frozen yogurt brand, Yogurt Factory, officially announced its entry into the Indian market through a strategic partnership with FranGlobal, the international business arm of Franchise India. Yogurt Factory aimed to revolutionize the Indian dessert landscape with its 0% fat, 100% gourmet frozen yogurt and an extensive range of smoothies, milkshakes, waffles, and bubble teas.
- April 2025: In a defining moment for India’s premium dairy segment, Britannia Industries Ltd officially launched its much-anticipated Greek yogurt range, marking a significant step forward in the brand’s innovation journey. Behind the polished packaging and market-ready product lay a story of ambition, collaboration, and an unwavering commitment to excellence. This launch was not just about introducing a new SKU; it was about creating an experience. One that embodied authenticity, bold flavor profiles, nutritional integrity, and a design-led consumer appeal that reflected the evolving tastes of the modern Indian shopper.


Asia-Pacific Dairy Market Report Scope
The dairy market refers to the economic exchange of dairy products, including milk, cheese, yogurt, and butter, as well as the supply and demand dynamics of these products. The Asia-Pacific Dairy Market is Segmented by Product Type (Butter, Cheese, Cream, Dairy Desserts, Milk, and More), Distribution Channel (Off-Trade and On-Trade), and Geography (Australia, China, India, Japan, and Rest of Asia-Pacific). The Market Forecasts are Provided in Terms of Value (USD) and Volume (Tons).
Product Type
| Butter | Salted Butter | |
| Unsalted Butter | ||
| Cheese | Natural Cheese | Cheddar |
| Cottage | ||
| Ricotta | ||
| Parmesan | ||
| Others | ||
| Processed Cheese | ||
| Cream | Fresh Cream | |
| Cooking Cream | ||
| Whippng Cream | ||
| Others | ||
| Dairy Desserts | Ice Cream | |
| Cheesecakes | ||
| Frozen Desserts | ||
| Others | ||
| Milk | Condensed milk | |
| Flavored Milk | ||
| Fresh Milk | ||
| UHT Milk | ||
| Powdered Milk | ||
| Yogurt | Drinkable | |
| Spoonable | ||
| Sour Milk Drinks | ||
Distribution Channel
| On-trade | |
| Off-trade | Convenience Stores |
| Specialist Retailers | |
| Supermarkets and Hypermarkets | |
| On-line Retail | |
| Others |
By Geography
| India |
| Japan |
| Australia |
| China |
| Indonesia |
| South Korea |
| Thailand |
| Singapore |
| Rest of Asia-Pacific |
| Product Type | Butter | Salted Butter | |
| Unsalted Butter | |||
| Cheese | Natural Cheese | Cheddar | |
| Cottage | |||
| Ricotta | |||
| Parmesan | |||
| Others | |||
| Processed Cheese | |||
| Cream | Fresh Cream | ||
| Cooking Cream | |||
| Whippng Cream | |||
| Others | |||
| Dairy Desserts | Ice Cream | ||
| Cheesecakes | |||
| Frozen Desserts | |||
| Others | |||
| Milk | Condensed milk | ||
| Flavored Milk | |||
| Fresh Milk | |||
| UHT Milk | |||
| Powdered Milk | |||
| Yogurt | Drinkable | ||
| Spoonable | |||
| Sour Milk Drinks | |||
| Distribution Channel | On-trade | ||
| Off-trade | Convenience Stores | ||
| Specialist Retailers | |||
| Supermarkets and Hypermarkets | |||
| On-line Retail | |||
| Others | |||
| By Geography | India | ||
| Japan | |||
| Australia | |||
| China | |||
| Indonesia | |||
| South Korea | |||
| Thailand | |||
| Singapore | |||
| Rest of Asia-Pacific | |||


Market Definition
- Butter - Butter is a yellow-to-white solid emulsion of fat globules, water, and inorganic salts produced by churning the cream from cows’ milk
- Dairy - Dairy product include milk and any of the foods made from milk, including butter, cheese, ice cream, yogurt, and condensed and dried milk.
- Frozen Desserts - Frozen dairy dessert means and includes products containing milk or cream and other ingredients which are frozen or semi-frozen prior to consumption, such as ice milk or sherbet, including frozen dairy desserts for special dietary purposes, and sorbet
- Sour Milk Drinks - Sour milk is thick, curdled milk, with a sour taste, obtained from the fermentation of milk. Sour milk drinks such as kefir, laban, buttermilk have been considered in the study
| Keyword | Definition |
|---|---|
| Cultured Butter | Cultured butter is prepared by having the raw butter go through chemical processing and has been added with certain emulsifiers and foreign ingredients. |
| Uncultured Butter | This type of butter is one which has not been processed in any way |
| Natural Cheese | The type of cheese in its most natural form. It is made from natural and simple products and ingredients, including fresh and natural salts, natural colors, enzymes, and high-quality milk. |
| Processed Cheese | Processed cheese undergoes the same processes as natural cheese; however, it requires more steps and many different forms of ingredients. Making processed cheese involves melting natural cheese, emulsifying it, and adding preservatives and other artificial ingredients or colorings. |
| Single Cream | Single cream contains around 18% fat. It’s a single layer of cream that appears over boiled milk. |
| Double Cream | Double cream contains 48% fat, more than double the amount of fat of single cream. It’s heavier and thicker than single cream |
| Whipping Cream | This has a much higher fat percentage than single cream (36%). Used to top cakes, pies, and puddings and as a thickener for sauces, soups, and fillings. |
| Frozen Desserts | Desserts that are meant to be eaten in frozen condition. E.g., sherbets, sorbets, frozen yogurts |
| UHT Milk (Ultra-high temperature milk) | Milk heated at a very high temperature. Ultra-high-temperature processing (UHT) of milk involves heating for 1–8 sec at 135–154°C. which kills the spore-forming pathogenic microorganism, resulting in a product with a shelf-life of several months. |
| Non-dairy butter/Plant-based butter | Butter made from plant-derived oil such as coconut, palm, etc. |
| Non-dairy Yogurt | Yogurt made from typically made from nuts, like almonds, cashews, coconuts, and even other foods like soybeans, plantains, oats, and peas |
| On-trade | It refers to restaurants, QSRs, and bars. |
| Off-trade | It refers to supermarkets, hypermarkets, on-line channels, etc. |
| Neufchatel cheese | One of the oldest kinds of cheese in France. It is a soft, slightly crumbly, mold-ripened, bloomy-rind cheese made in the Neufchâtel-en-Bray region of Normandy. |
| Flexitarian | It refers to a consumer preferring a semi-vegetarian diet, that is centered on plant foods with limited or occasional inclusion of meat. |
| Lactose Intolerance | Lactose intolerance is a reaction in digestive system to lactose, the sugar in milk. It causes uncomfortable symptoms in response to the consumption of dairy products. |
| Cream Cheese | Cream cheese is a soft and creamy fresh cheese with a tangy taste made from milk and cream. |
| Sorbets | Sorbet is a frozen dessert made using ice combined with fruit juice, fruit purée, or other ingredients, such as wine, liqueur, or honey. |
| Sherbet | Sherbet is a sweetened frozen dessert made with fruit and some sort of dairy product such as milk or cream. |
| Shelf stable | Foods that can be safely stored at room temperature, or "on the shelf," for at least one year and do not have to be cooked or refrigerated to eat safely. |
| DSD | Direct Store Delivery is the process in supply chain management wherein the product is delivered from manufacturing plant directly to the retailer. |
| OU Kosher | Orthodox Union Kosher is a kosher certification agency based in New York City. |
| Gelato | Gelato is a frozen creamy dessert made with milk, heavy cream and sugar. |
| Grass-fed Cows | Grass-fed cows are allowed to graze in pastures, where they eat a variety of grasses and clover. |


Research Methodology
Mordor Intelligence follows a four-step methodology in all our reports.
- Step-1: Identify Key Variables: In order to build a robust forecasting methodology, the variables and factors identified in Step 1 are tested against available historical market numbers. Through an iterative process, the variables required for market forecast are set, and the model is built on the basis of these variables.
- Step-2: Build a Market Model: Market-size estimations for the forecast years are in nominal terms. Inflation is not a part of the pricing, and the average selling price (ASP) is kept constant throughout the forecast period for each country.
- Step-3: Validate and Finalize: In this important step, all market numbers, variables, and analyst calls are validated through an extensive network of primary research experts from the market studied. The respondents are selected across levels and functions to generate a holistic picture of the market studied.
- Step-4: Research Outputs: Syndicated Reports, Custom Consulting Assignments, Databases & Subscription Platforms


