US Cat Food Market Size and Share
Market Overview
| Study Period | 2018 - 2031 |
|---|---|
| Forecast Data Period | 2026 - 2031 |
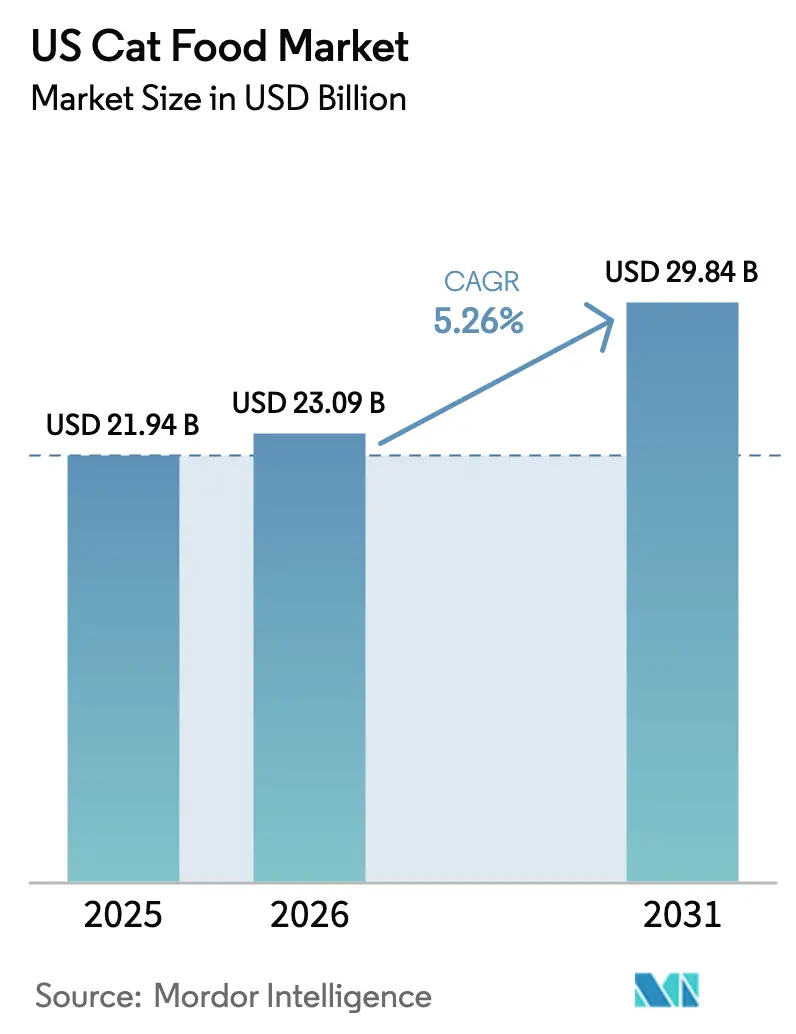
| Base Year Market Size (2025) | USD 21.94 Billion |
| Market Size (2026) | USD 23.09 Billion |
| Market Size (2031) | USD 29.84 Billion |
| Growth Rate (2026 - 2031) | 5.26% CAGR |
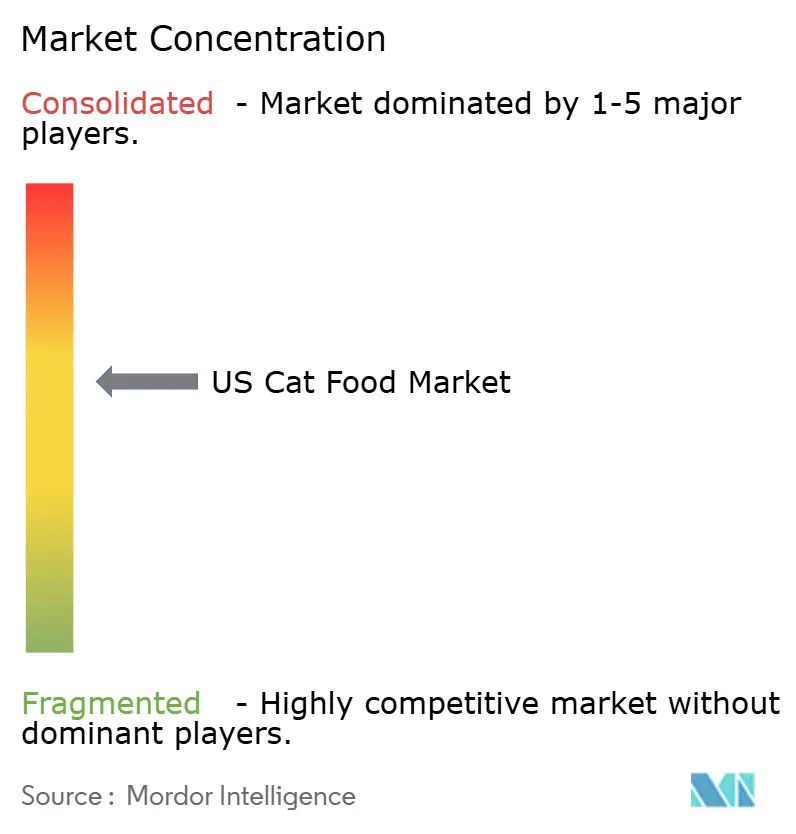
| Market Concentration | Medium |
Major Players *Disclaimer: Major Players sorted in no particular order Image © Mordor Intelligence. Reuse requires attribution under CC BY 4.0. | |
US Cat Food Market Analysis by Mordor Intelligence
The US cat food market size is expected to grow from USD 21.94 billion in 2025 to USD 23.09 billion in 2026 and is forecast to reach USD 29.84 billion by 2031 at 5.26% CAGR over 2026-2031. Robust premiumization, wider therapeutic offerings, and increasing online penetration are projected to sustain the US cat food market's growth trajectory despite cost inflation and heightened regulatory scrutiny. Shifts in household composition toward single adults, continued veterinary influence on nutrition decisions, and the expanding role of functional supplements are raising the baseline spend per cat. Within this environment, dry kibble remains the volume anchor while wet, fresh, and freeze-dried lines expand the premium tier. Large incumbents maintain scale advantages, while nimble disruptors gain market share by aligning their formulations with label-modernization rules and consumer transparency demands. E-commerce subscriptions and omnichannel models further deepen shopper loyalty, strengthening repeat purchase momentum in the US cat food market.
Key Report Takeaways
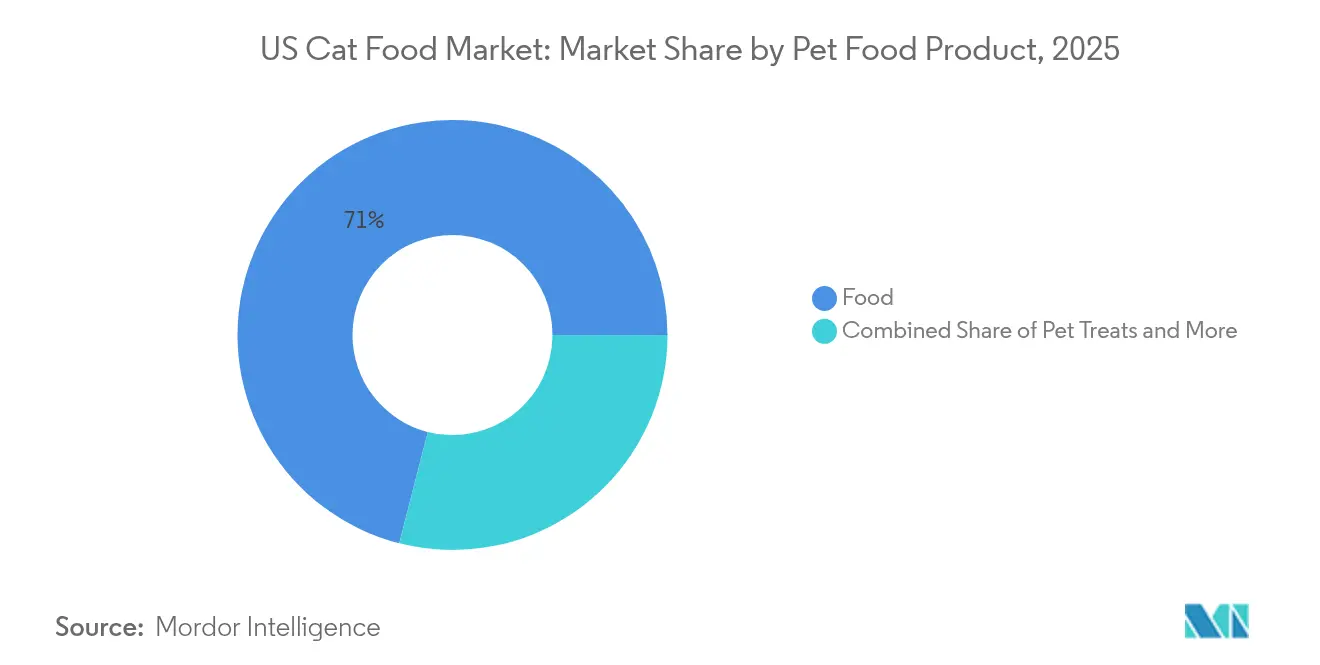
- By pet food product, food retained 71.02% of the US cat food market size in 2025, while pet treats are projected to post the fastest 6.24% CAGR through 2031.
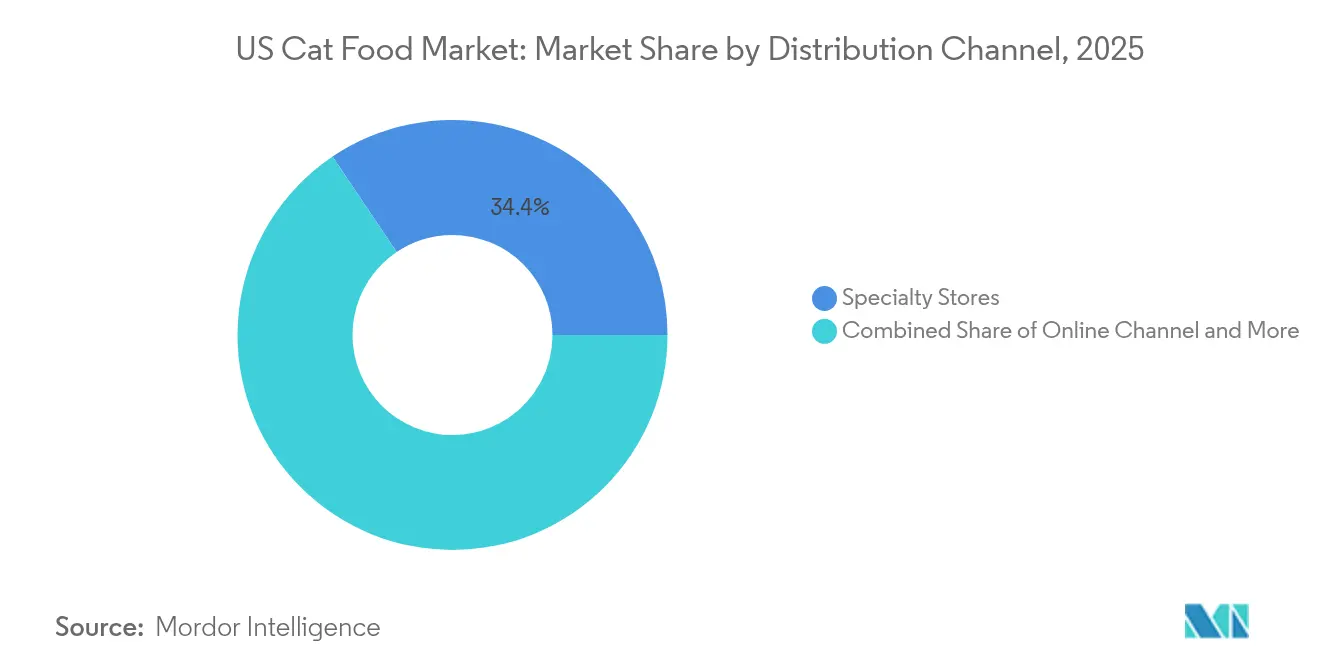
- By distribution channel, specialty stores held 34.42% of the US cat food market share in 2025, while online sales are forecasted to expand at a 6.78% CAGR through 2031.
Note: Market size and forecast figures in this report are generated using Mordor Intelligence’s proprietary estimation framework, updated with the latest available data and insights as of 2026.
US Cat Food Market Trends and Insights
Drivers Impact Analysis*
| Driver | (~) % Impact on CAGR Forecast | Geographic Relevance | Impact Timeline |
|---|---|---|---|
| Premiumization and humanization trend | +1.8% | National, concentrated in urban metros | Medium term (2-4 years) |
| Rising cat ownership in urban, single-person households | +1.2% | Urban centers, Northeast and West Coast | Long term (≥ 4 years) |
| E-commerce and subscription channel expansion | +1.0% | National, accelerated in suburban markets | Short term (≤ 2 years) |
| FDA label-modernization forcing reformulation advantage for agile brands | +0.8% | National regulatory compliance | Medium term (2-4 years) |
| Growth of single-ingredient toppers elevating dry-food basket value | +0.6% | Premium retail channels nationwide | Short term (≤ 2 years) |
| Retail refrigerated shelf expansion unlocked by supermarket cap-ex cycles | +0.4% | Regional rollout starting with major metros | Long term (≥ 4 years) |
| Source: Mordor Intelligence | |||
Premiumization and Humanization Trend
The ongoing humanization of pets is reshaping shopping behavior within the US cat food market. Shoppers seek ingredient decks that align with their own diets, favoring clean labels, functional claims, and ethical sourcing. Fresh and refrigerated cat meals moved from a marginal presence, while freeze-dried and raw frozen products, together, reached a 10% household penetration. Brands that bundle probiotics, omega-3 fatty acids, and joint-support nutrients into base diets often command retail prices that are 2-3 times higher than those of mainstream kibble, yet churn remains low due to the perceived health benefits. The trend also fuels growth in premium snacks, supplements, and meal toppers, adding recurring add-on revenue in the US cat food market.
Rising Cat Ownership in Urban, Single-Person Households
Millennials account for a good share of U.S. pet parents and tend to over-index on cats, as apartments and flexible work styles make feline companionship a practical option. Urban households now drive more than half of the incremental volume in the US cat food market, favoring single-serve pouches, portion-controlled trays, and subscription shipments that cater to smaller living spaces. Regional analysis shows that Northeast and Pacific coastal cities are posting the fastest cat adoption rates, which increases demand for premium and veterinary-backed nutrition lines sold through specialty and digital channels.
E-commerce and Subscription Channel Expansion
Digital transformation has accelerated cat food purchasing, with 40% of pet food sales now occurring online compared to traditional brick-and-mortar dominance just five years ago[1]Source: Nicole Kerwin, “26 recent pet food, treat industry M&As,” Pet Food Processing, PETFOODPROCESSING.NET. Auto-ship programs prevent stock-outs, offer cost predictability, and collect shopper data that brands use for targeted cross-selling. Direct-to-consumer entrants leverage this channel to bypass shelf-placement fees and rapidly scale niche formulations such as high-moisture fresh diets or limited-ingredient recipes. Strong logistics networks shorten delivery time, which lessens reliance on local inventory and broadens assortment depth, reinforcing e-commerce as a structural growth pillar for the US cat food market.
FDA Label-Modernization Forcing Reformulation Advantage for Agile Brands
The FDA's pet food label modernization initiative is creating competitive advantages for companies that can quickly adapt their formulations to meet new transparency and nutritional adequacy requirements[2]Source: U.S. Food and Drug Administration, “Pet Food Label Modernization,” FDA, FDA.GOV. Small and mid-sized companies with shorter product lines can pivot recipes and packaging faster, using the mandate to showcase functional claims or novel proteins. Incumbents face higher reformulation costs across hundreds of SKUs, giving agile players a temporary speed advantage. Compliance is also catalyzing investment in supply-chain traceability, third-party certifications, and data-driven nutrition validation, trends that should ultimately elevate category transparency within the US cat food market.
Restraints Impact Analysis*
| Restraint | (~) % Impact on CAGR Forecast | Geographic Relevance | Impact Timeline |
|---|---|---|---|
| Raw-material price volatility | -1.4% | Global supply chains affecting US market | Short term (≤ 2 years) |
| Private-label penetration among price-sensitive owners | -0.8% | Mass retail channels, price-sensitive regions | Medium term (2-4 years) |
| Pending PURR Act may delay novel-ingredient approvals | -0.6% | National regulatory framework | Long term (≥ 4 years) |
| DCM-linked grain-free safety concerns hurting specialty formats | -0.4% | Specialty and premium channels | Medium term (2-4 years) |
| Source: Mordor Intelligence | |||
Raw-Material Price Volatility
Protein ingredient costs have created significant margin pressure across the cat food industry, with meat and fish prices experiencing double-digit inflation that disproportionately impacts premium formulations relying on high-inclusion rates of animal proteins. Manufacturers responded with mid-year price hikes, smaller package sizes, or alternative protein blends such as insect meal. Bigger companies secure multi-year contracts or acquire suppliers, while smaller brands test plant-forward and cultivated-protein options to stabilize cost in the US cat food market.
Private-Label Penetration Among Price-Sensitive Owners
The growth trajectory is supported by improved manufacturing capabilities among private label suppliers and retailers' willingness to invest in marketing and allocate shelf space for store brands, which generate higher margins than national brand alternatives. United Petfood's expansion into US manufacturing through facility acquisitions demonstrates the global development of private label infrastructure, which could accelerate penetration rates in the coming years. However, the cat food category's emotional purchase drivers and brand loyalty characteristics may limit private label growth compared to more commoditized pet product categories, particularly in premium segments where owners prioritize perceived quality and brand reputation over price considerations.
*Our forecasts treat driver/restraint impacts as directional, not additive. The impact forecasts reflect baseline growth, mix effects, and variable interactions.
Segment Analysis
By Pet Food Product: Premium Treats Lead Innovation
Food retained 71.02% of the US cat food market size in 2025, while pet treats are projected to post the fastest 6.24% CAGR through 2031, signaling sustained trade-up momentum. Many treats contain active ingredients, allowing owners to supplement their daily diets without switching to a primary food, a tactic that increases average order values across the US cat food market. Freeze-dried formats boast moisture removal that preserves nutrient integrity while providing the crunchy texture cats crave. Dental treats receive veterinary backing for reducing tartar, and brands highlight seals to justify price premiums. Marketers exploit seasonal flavors, pumpkin in autumn, cranberries in winter, to refresh shelf presence.
Veterinary clinics cross-sell therapeutic treats aligned with prescription diets, generating incremental clinic margin while retaining compliance among cats requiring condition-specific nutrition. As a result, premium snack lines continue to serve as a springboard for the adoption of functional ingredients in the US cat food market. Milk bioactives, omega-3 concentrates, and probiotic sachets lead uptake. Owners equate supplements with preventive veterinary care, mirroring human wellness patterns. Subscription firms ship monthly sachets customized to age, weight, and breed, converting sporadic purchases into annuity revenue.


By Distribution Channel: Digital Upshifts Shopping Norms
Specialty stores held 34.42% of the US cat food market share in 2025. Knowledgeable staff, curated assortments, and in-store events foster loyalty among premium shoppers. Yet, online channels are projected to post a 6.78% CAGR to 2031, driven by auto-ship savings, broader SKU breadth, and the convenience of doorstep delivery. Chewy, Amazon, and brand-owned sites collectively influence formulation narratives. Convenience stores represent a smaller but strategically important channel for impulse purchases and emergency feeding situations, while other channels, including farm and feed stores, serve rural markets with different product mix preferences and price sensitivity characteristics.
Supermarkets and hypermarkets retain mainstream dry food shoppers but face pressure on margins and constraints on shelf space. Many now partner with e-commerce players for same-day click-and-collect, bridging physical inventory with digital reach. The channel landscape is evolving toward omnichannel strategies that integrate online ordering with in-store pickup, subscription services with retail partnerships, and digital marketing with physical product demonstrations. Regulatory influence from state-level pet food regulations and FDA oversight affects all channels equally, though specialty retailers often lead in carrying products that meet emerging compliance standards and consumer transparency expectations.
Geography Analysis
Regional diversity shapes spending dynamics in the US cat food market. The Northeast commands the highest per-capita outlay, averaging USD 450 per year, due to dense urban living, elevated incomes, and strong human capital sentiment. West Coast consumers similarly favor premium wet and fresh products, emphasizing sustainability and limited-ingredient recipes. Specialty boutiques in New York, Boston, Seattle, and San Francisco showcase raw-frozen bars and refrigerated cases that mirror human meal kits, cementing these metros as trend incubators.
Southern states contribute a significant volume through larger pet populations, yet price sensitivity remains higher. Mainstream kibble dominates, although rapid e-commerce adoption is bridging assortment gaps, enabling rural shoppers to access premium SKUs that were previously unavailable locally. Midwest households display balanced preferences, with an uptick in veterinary diet usage as clinic networks expand. Climate also influences buying habits: hot Gulf Coast summers increase demand for wet food to improve hydration, whereas Northern winters prompt stock-up purchases of shelf-stable kibble.
State-level feed regulations introduce compliance complexity. California’s Proposition 12 style ingredient sourcing rules and New York’s transparency acts pressure nationwide distributors to harmonize labels. Still, digital direct-to-consumer brands cut across regulatory boundaries by fulfilling from centralized facilities compliant with federal rather than local rules. E-commerce thus reduces geographic variance in product availability, tightening competitive dispersion throughout the US cat food market.
Competitive Landscape
The top five manufacturers hold a significant share of the US cat food market, resulting in a moderate concentration profile in 2024. Their portfolios span the economy through super-premium price tiers and encompass dry, wet, treats, and therapeutic lines. Scale affords bulk ingredient contracts, national advertising slots, and a broad veterinary sales force. The giants also pursue vertical integration, exemplified by Mars’s acquisition of Orijen’s parent Champion Petfoods and Purina’s expansion of factory capacity in Hartwell, Georgia.
Acquisition remains the favored route to plug portfolio gaps. General Mills acquired Whitebridge Pet Brands for USD 1.45 billion in November 2024, bringing Tiki Cat wet recipes and Cloud Star treats under its Blue Buffalo banner[3]Source: Nicole Kerwin, “General Mills scoops up Whitebridge Pet Brands for USD 1.45 billion,” Pet Food Processing, PETFOODPROCESSING.NET. Private-equity interest remained robust, as evidenced by Advent International's acquisition of China-based Seek Pet for USD 138.5 million, signaling confidence in the global supply chain. Meanwhile, United Petfood’s purchase of Wellness Pet’s Indiana facility enabled the Belgian group to establish instant domestic wet-food production.
Digital-native challengers such as Smalls, Cat Person, and NomNomNow emphasize limited-ingredient, fresh meals and personalized nutrition powered by data feeds from veterinary records and wearable devices. Though small in current volume, these disruptors earn higher loyalty scores and subscription retention. Strategic partnerships with telehealth apps and pet-insurance portals broaden their marketing reach. Established players respond by launching in-house DTC brands or investing in features like AI-based diet quizzes. Innovation velocity and omnichannel presence will determine share realignment across the US cat food market.
US Cat Food Industry Leaders
Colgate-Palmolive Company (Hill's Pet Nutrition Inc.)
General Mills Inc.
Mars Incorporated
The J. M. Smucker Company
Nestle S.A. (Purina)
- *Disclaimer: Major Players sorted in no particular order

Recent Industry Developments
- November 2024: General Mills completed a definitive agreement to acquire Whitebridge Pet Brands' North American business for USD 1.45 billion, adding Tiki Pets and Cloud Star brands to its Blue Buffalo portfolio and securing two manufacturing facilities in Joplin, Missouri to strengthen its position in the fast-growing cat food and pet treats segments.
- July 2023: Hill's Pet Nutrition introduced its new MSC (Marine Stewardship Council) certified pollock and insect protein products for pets with sensitive stomachs and skin lines. They contain vitamins, omega-3 fatty acids, and antioxidants.
- March 2023: Nestle Purina launched new cat treats under the Friskies "Friskies Playfuls - treats" brand. These treats are round in shape and are available in chicken and liver and salmon, and shrimp flavors for adult cats.


US Cat Food Market Report Scope
Food, Pet Nutraceuticals/Supplements, Pet Treats, Pet Veterinary Diets are covered as segments by Pet Food Product. Convenience Stores, Online Channel, Specialty Stores, Supermarkets/Hypermarkets are covered as segments by Distribution Channel.| Food | By Sub Product | Dry Pet Food | By Sub Dry Pet Food | Kibbles |
| Other Dry Pet Food | ||||
| Wet Pet Food | ||||
| Pet Nutraceuticals/Supplements | By Sub Product | Milk Bioactives | ||
| Omega-3 Fatty Acids | ||||
| Probiotics | ||||
| Proteins and Peptides | ||||
| Vitamins and Minerals | ||||
| Other Nutraceuticals | ||||
| Pet Treats | By Sub Product | Crunchy Treats | ||
| Dental Treats | ||||
| Freeze-dried and Jerky Treats | ||||
| Soft & Chewy Treats | ||||
| Other Treats | ||||
| Pet Veterinary Diets | By Sub Product | Derma Diets | ||
| Diabetes | ||||
| Digestive Sensitivity | ||||
| Obesity Diets | ||||
| Oral Care Diets | ||||
| Renal | ||||
| Urinary tract disease | ||||
| Other Veterinary Diets |
| Convenience Stores |
| Online Channel |
| Specialty Stores |
| Supermarkets/Hypermarkets |
| Other Channels |
| By Pet Food Product | Food | By Sub Product | Dry Pet Food | By Sub Dry Pet Food | Kibbles |
| Other Dry Pet Food | |||||
| Wet Pet Food | |||||
| Pet Nutraceuticals/Supplements | By Sub Product | Milk Bioactives | |||
| Omega-3 Fatty Acids | |||||
| Probiotics | |||||
| Proteins and Peptides | |||||
| Vitamins and Minerals | |||||
| Other Nutraceuticals | |||||
| Pet Treats | By Sub Product | Crunchy Treats | |||
| Dental Treats | |||||
| Freeze-dried and Jerky Treats | |||||
| Soft & Chewy Treats | |||||
| Other Treats | |||||
| Pet Veterinary Diets | By Sub Product | Derma Diets | |||
| Diabetes | |||||
| Digestive Sensitivity | |||||
| Obesity Diets | |||||
| Oral Care Diets | |||||
| Renal | |||||
| Urinary tract disease | |||||
| Other Veterinary Diets | |||||
| By Distribution Channel | Convenience Stores | ||||
| Online Channel | |||||
| Specialty Stores | |||||
| Supermarkets/Hypermarkets | |||||
| Other Channels | |||||


Market Definition
- FUNCTIONS - Pet foods are usually intended to provide complete and balanced nutrition to the pet but are primarily used as functional products. The scope includes the food and supplements consumed by pets including veterinary diets. Supplements/nutraceuticals that are directly supplied to pets are considered within the scope.
- RESELLERS - Companies engaged in reselling of pet food without value addition have been excluded from the market scope, in order to avoid double counting.
- END CONSUMERS - Pet owners are considered to be the end-consumers in the market studied.
- DISTRIBUTION CHANNELS - Supermarkets/hypermarkets, specialty stores, convenience stores, online channels and other channels are considered within the scope. The stores which are exclusively providing pet related basic and custom products are considered within the scope of specialty stores.
| Keyword | Definition |
|---|---|
| Pet Food | The scope of pet food includes the food that is eatable by pets including food, treats, veterinary diets, and nutraceuticals/supplements. |
| Food | Food is animal feed intended for consumption by pets. It is formulated to provide essential nutrients and meet the dietary needs of various types of pets, including dogs, cats, and other animals. These are generally segmented into dry and wet pet foods. |
| Dry Pet Food | Dry pet foods may be extruded/baked (kibbles) or flaked. They have a lower moisture content, typically around 12-20%. |
| Wet Pet Food | Wet pet food, also known as canned pet food or moist pet food, generally has a higher moisture content compared to dry pet food, often ranging from 70-80%. |
| Kibbles | Kibbles are dry, processed pet food in small, bite-sized pieces or pellets. They are specifically formulated to provide balanced nutrition for various domestic animals, such as dogs, cats, and other animals. |
| Treats | Pet Treats are special food items or rewards given to pets, to show affection, and encourage good behavior. They are especially used during training. Pet treats are made from various combinations of meat or meat-derived materials with other ingredients. |
| Dental Treats | Pet dental treats are specialized treats that are formulated to promote good oral hygiene in pets. |
| Crunchy Treats | It is a type of pet treat that has a firm and crispy texture which can be a good source of nutrition for pets. |
| Soft and chewy treats | Soft and Chewy pet treats are a type of pet food product that is formulated to be easy to chewy and digest. They are usually made from soft and pliable ingredients, such as meat, poultry, or vegetables, that have been blended and formed into bite-sized pieces or strips. |
| Freeze-dried & Jerky Treats | Freeze-dried and jerky treats are snacks given to pets, that are prepared through a special preservation process, without damaging the nutritional content, resulting in long-lasting, nutrient-rich treats. |
| Urinary Tract Disease Diets | These are commercial diets that are specifically formulated to promote urinary health and reduce the risk of urinary tract infections and other urinary problems. |
| Renal Diets | These are specialized pet foods formulated to support the health of pets with kidney disease or renal insufficiency. |
| Digestive Sensitivity Diets | Digestive-sensitive diets are specially formulated to meet the nutritional needs of pets with digestive issues such as food intolerances, allergies, and sensitivities. These diets are designed to be easily digestible and to reduce the symptoms of digestive problems in pets. |
| Oral Care Diets | Oral care diets for pets are specially formulated diets produced to promote oral health and hygiene in pets. |
| Grain-Free Pet Food | Pet food that does not contain common grains like wheat, corn, or soy. Grain-free diets are often preferred by pet owners seeking alternative options or if their pets have specific dietary sensitivities. |
| Premium Pet Food | High-quality pet food formulated with superior ingredients often offers additional nutritional benefits compared to standard pet food. |
| Natural Pet Food | Pet food made from natural ingredients, with minimal processing and without artificial preservatives. |
| Organic Pet Food | Pet food is produced using organic ingredients, free from synthetic pesticides, hormones, and genetically modified organisms (GMOs). |
| Extrusion | A manufacturing process used to produce dry pet food, where ingredients are cooked, mixed, and shaped under high pressure and temperature. |
| Other Pets | Other pets include birds, fish, rabbits, hamsters, ferrets, and reptiles. |
| Palatability | The taste, texture, and aroma of pet food influence its appeal and acceptance by pets. |
| Complete and Balanced Pet Food | Pet food that provides all essential nutrients in appropriate proportions to meet the nutritional needs of pets without additional supplementation. |
| Preservatives | These are the substances that are added to pet food to extend its shelf life and prevent spoilage. |
| Nutraceuticals | Food products that offer health benefits beyond basic nutrition, often contain bioactive compounds with potential therapeutic effects. |
| Probiotics | Live beneficial bacteria that promote a healthy balance of gut flora, supporting digestive health and immune function in pets. |
| Antioxidants | Compounds that help neutralize harmful free radicals in the body, promoting cellular health and supporting the immune system in pets. |
| Shelf-Life | The duration of which pet food remains safe and nutritionally viable for consumption after its production date. |
| Prescription diet | Specialized pet food formulated to address specific medical conditions under veterinary supervision. |
| Allergen | A substance that can cause allergic reactions in some pets, leading to food allergies or sensitivities. |
| Canned food | Wet pet food that is packed in cans and contains higher moisture content than dry food. |
| Limited ingredient diet (LID) | Pet food formulated with a reduced number of ingredients to minimize potential allergens. |
| Guaranteed Analysis | The minimum or maximum levels of certain nutrients present in pet food. |
| Weight management | Pet food designed to help pets maintain a healthy weight or support weight loss efforts. |
| Other Nutraceuticals | It includes prebiotics, antioxidants, digestive fiber, enzymes, essential oils and herbs. |
| Other Veterinary Diets | It includes weight management diets, skin and coat health, cardiac care, and joint care. |
| Other Treats | It includes rawhides, mineral blocks, lickables, and catnips. |
| Other Dry Foods | It includes cereal flakes, mixers, meal toppers, freeze-dried foods, and air-dried foods. |
| Other Animals | It includes birds, fish, reptiles, and small animals (rabbits, ferrets, hamsters). |
| Other Distribution Channels | It includes veterinary clinics, local unregulated stores, and feed and farm stores. |
| Proteins and Peptides | Proteins are large molecules composed of basic units called amino acids which help in the growth and development of pets. Peptides are the short string of 2 to 50 amino acids. |
| Omega-3 fatty acids | Omega-3 fatty acids are essential polyunsaturated fats that play a crucial role in the overall health and well-being of Pets |
| Vitamins | Vitamins are the essential organic compounds that are essential for vital physiological functioning. |
| Minerals | Minerals are naturally occurring inorganic substances that are essential for various physiological functions in pets. |
| CKD | Chronic Kidney Disease |
| DHA | Docosahexaenoic Acid |
| EPA | Eicosapentaenoic Acid |
| ALA | Alpha-linolenic Acid |
| BHA | Butylated Hydroxyanisol |
| BHT | Butylated Hydroxytoluene |
| FLUTD | Feline Lower Urinary Tract Disease |


Research Methodology
Mordor Intelligence follows a four-step methodology in all our reports.
- Step-1: IDENTIFY KEY VARIABLES: In order to build a robust forecasting methodology, the variables and factors identified in Step-1 are tested against available historical market numbers. Through an iterative process, the variables required for market forecast are set and the model is built on the basis of these variables.
- Step-2: Build a Market Model: Market-size estimations for the forecast years are in nominal terms. Inflation is not a part of the pricing, and the average selling price (ASP) is kept constant throughout the forecast period.
- Step-3: Validate and Finalize: In this important step, all market numbers, variables and analyst calls are validated through an extensive network of primary research experts from the market studied. The respondents are selected across levels and functions to generate a holistic picture of the market studied.
- Step-4: Research Outputs: Syndicated Reports, Custom Consulting Assignments, Databases & Subscription Platforms


