Asia-Pacific Pet Diet Market Size and Share
Market Overview
| Study Period | 2018 - 2031 |
|---|---|
| Forecast Data Period | 2026 - 2031 |
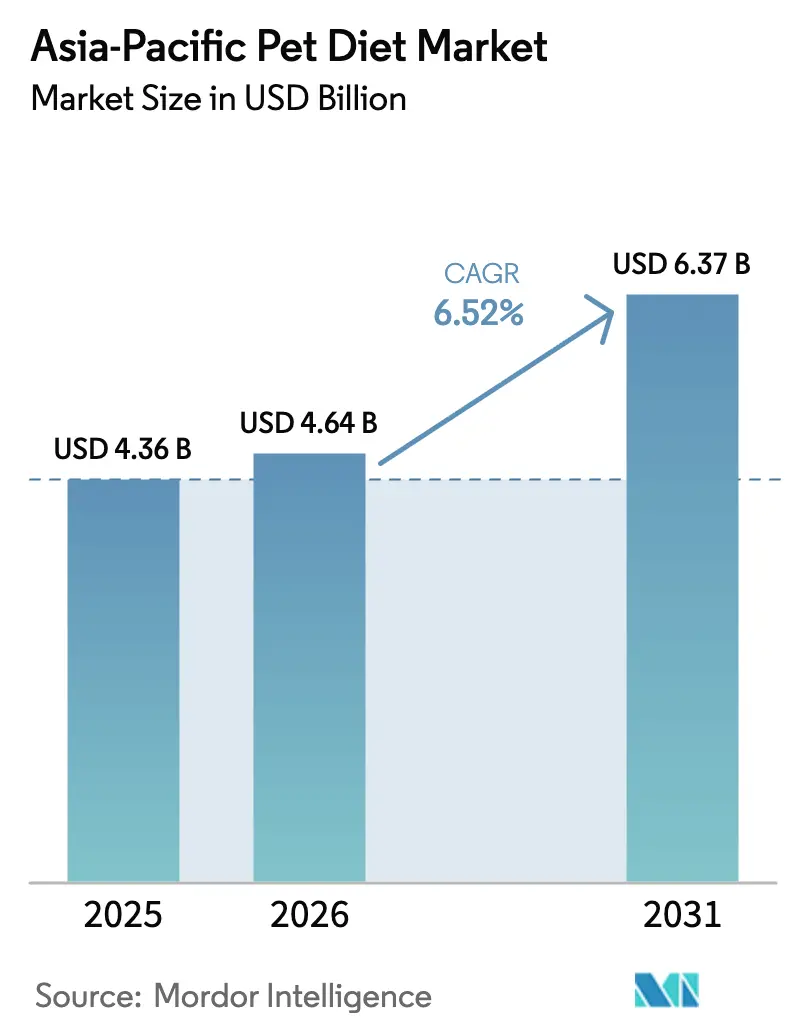
| Base Year Market Size (2025) | USD 4.36 Billion |
| Market Size (2026) | USD 4.64 Billion |
| Market Size (2031) | USD 6.37 Billion |
| Growth Rate (2026 - 2031) | 6.52% CAGR |
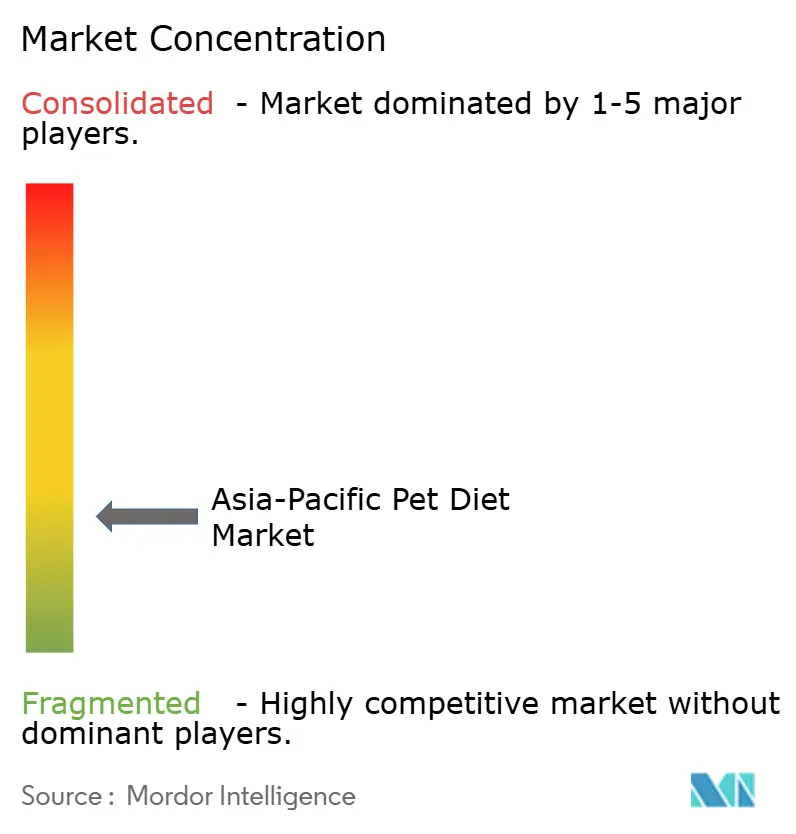
| Market Concentration | Low |
Major Players *Disclaimer: Major Players sorted in no particular order Image © Mordor Intelligence. Reuse requires attribution under CC BY 4.0. | |
Asia-Pacific Pet Diet Market Analysis by Mordor Intelligence
Asia-Pacific pet diet market size in 2026 is estimated at USD 4.64 billion, growing from 2025 value of USD 4.36 billion with 2031 projections showing USD 6.37 billion, growing at 6.52% CAGR over 2026-2031. Strong pet humanization, a surge in vet-diagnosed chronic conditions, and widening access to medical-grade nutrition products underpin this trajectory. Therapeutic segments dominate value creation as veterinarians increasingly prescribe diets for renal, urinary, and digestive disorders, now common among urban pets. China’s cross-border e-commerce liberalization, India’s growing middle class, and Japan’s aging pet population collectively amplify demand, while protein-input volatility and counterfeit risks temper momentum. Competitive intensity is rising as global majors reconfigure distribution, and regulatory frameworks tighten quality expectations. These dynamics collectively define the transformation of the Asia-Pacific pet diet market.
Key Report Takeaways
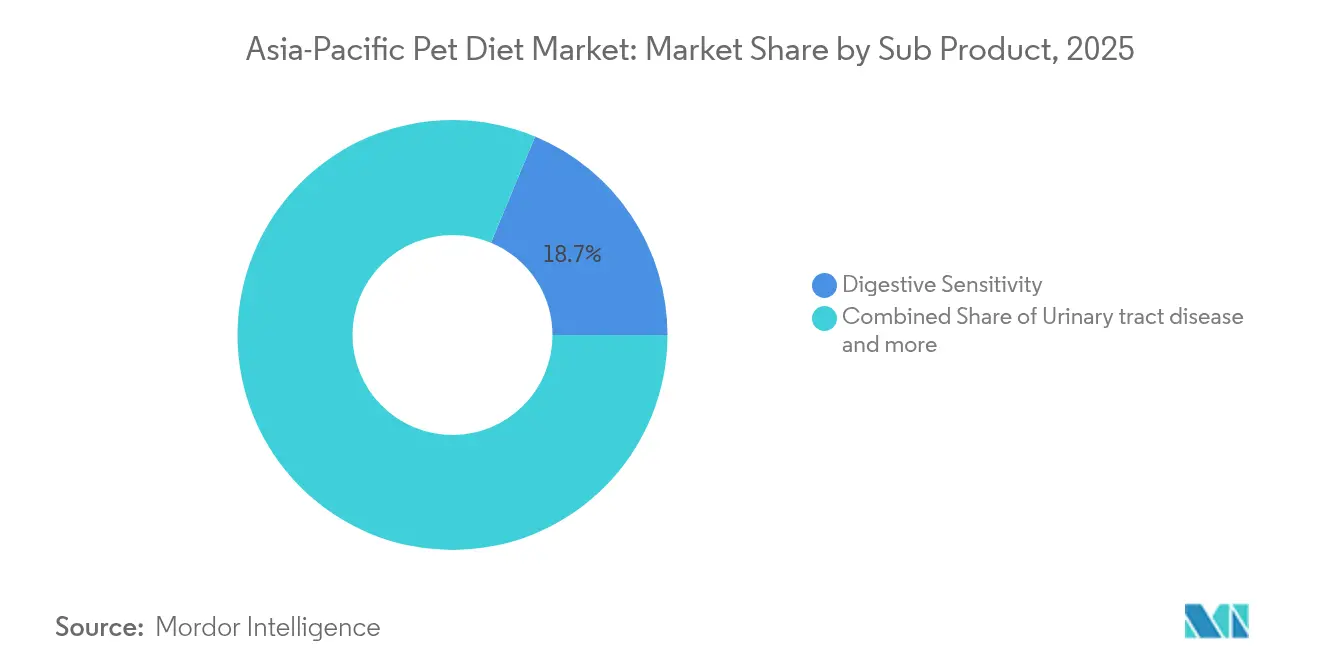
- By sub-product, digestive sensitivity diets captured 18.72% of the Asia-Pacific pet diet market share in 2025, while Urinary tract disease formulations are projected to expand at a 7.22% CAGR through 2031, the fastest rate among sub-products.
- By pets, dogs commanded a 47.86% share of the Asia-Pacific pet diet market size in 2025, while the cat segment is projected to grow at a 6.55% CAGR to 2031.
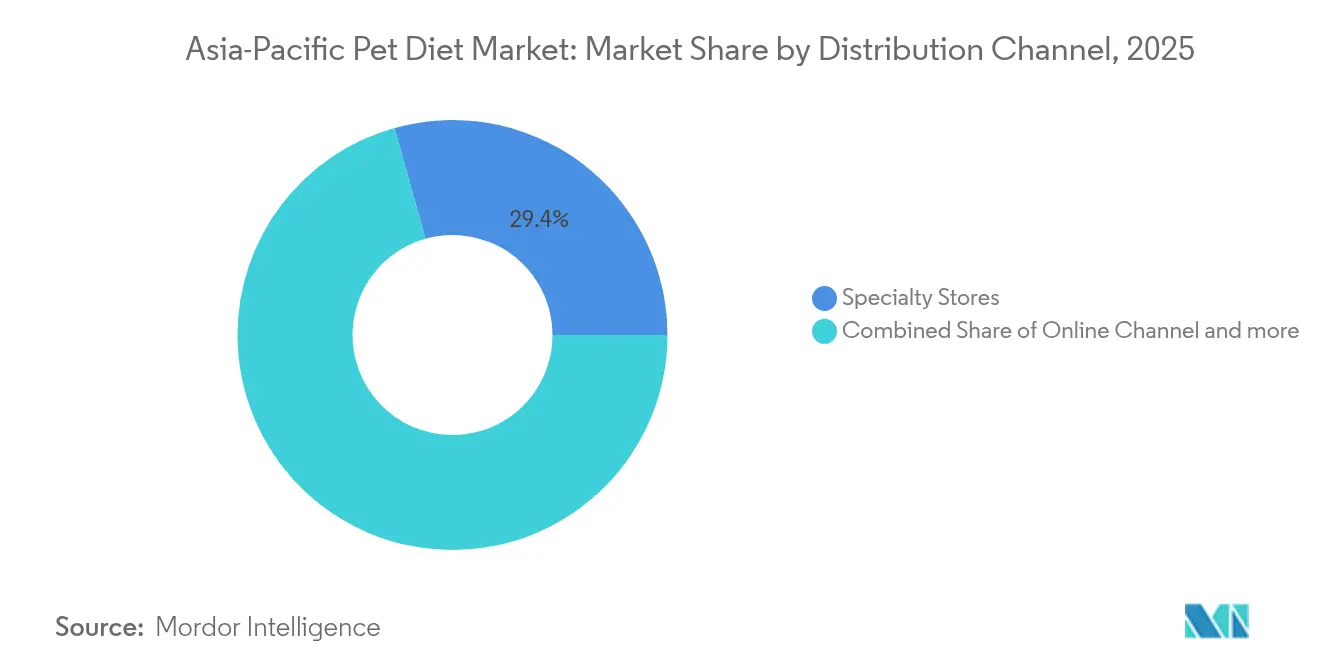
- By distribution channel, specialty stores led distribution, accounting for 29.35% of the revenue share in 2025, while online channels are growing at the fastest rate, with an 8.06% CAGR.
- By country, China held a 34.75% geographic share in 2025, while India is the fastest-growing country, with a 10.2% CAGR from 2026 to 2031.
- The Asia-Pacific pet diet market exhibits a fragmented structure, comprising a mix of global conglomerates and specialized regional players. Global companies, including Mars, Incorporated, Colgate-Palmolive Company (Hill's Pet Nutrition, Inc.), General Mills Inc., PLB International, and Affinity Petcare S.A., have accounted for a market share of 9.85% in 2025.
Note: Market size and forecast figures in this report are generated using Mordor Intelligence’s proprietary estimation framework, updated with the latest available data and insights as of 2026.
Asia-Pacific Pet Diet Market Trends and Insights
Drivers Impact Analysis*
| Driver | (~) % Impact on CAGR Forecast | Geographic Relevance | Impact Timeline |
|---|---|---|---|
| Rising pet ownership and humanization trend | +1.8% | China, Japan, Singapore, and other core Asia Pacific markets | Medium term (2-4 years) |
| Surge in vet-diagnosed chronic conditions | +1.5% | Urban centers across the Asia-Pacific | Long term (≥4 years) |
| Premiumization of pet diets in Tier-1 Asian cities | +1.2% | China, Japan, South Korea, Singapore, and Hong Kong | Short term (≤2 years) |
| E-commerce and live-stream retail amplification | +1.0% | Broad Asia Pacific with spillover to emerging markets | Medium term (2-4 years) |
| Microbiome-focused R&D breakthroughs | +0.8% | Japan and Australia as early adopters, the global development pipeline | Long term (≥4 years) |
| Cross-border e-commerce policy liberalization | +0.7% | China and Asia Pacific markets | Medium term (2-4 years) |
| Source: Mordor Intelligence | |||


Rising Pet Ownership and Humanization Trend
The fundamental shift toward treating pets as family members is reshaping demand for therapeutic nutrition across the Asia-Pacific's urbanizing economies. Single-person households in major cities nowadays allocate an average of SGD 195 (USD 145) per month for their pets, with 40% of this expenditure directed toward health-focused nutrition products [1]Source: Singapore Department of Statistics, “Household Expenditure Survey 2024,” singstat.gov.sg. This humanization trend extends beyond premium pricing to include preventive healthcare approaches, where pet owners increasingly seek veterinary-grade diets to address potential health issues before clinical symptoms emerge. The phenomenon is particularly pronounced in Japan and South Korea, where aging demographics and declining birth rates have elevated pets to surrogate family member status, driving demand for medical-grade nutrition interventions that mirror human healthcare approaches.
Surge in Vet-Diagnosed Chronic Conditions
The prevalence of chronic diseases in companion animals is increasing rapidly across the Asia-Pacific region. In March 2025, diabetes affected 23.88% of dogs in urban Pakistani populations, and similar rates were emerging across the region's metropolitan areas. This epidemiological shift reflects lifestyle changes, including reduced physical activity, increased consumption of processed foods, and exposure to environmental stressors, which parallel trends in human health. The expansion of veterinary infrastructure is simultaneously improving diagnostic capabilities, leading to earlier detection and treatment of conditions such as chronic kidney disease, which drives the therapeutic diet market. The convergence of higher disease prevalence and improved diagnostic access creates a compounding effect that sustains long-term growth in prescription diet segments.
Premiumization of Pet Diets in Tier-1 Asian Cities
Urban affluence in Asia-Pacific's tier-1 cities is driving unprecedented premiumization, with functional pet food categories experiencing explosive growth. Notably, urinary health products are expanding at a rate of 137% and weight control formulations are growing at a rate of 326% year-over-year. This premiumization extends beyond basic nutrition to encompass therapeutic interventions, where consumers willingly pay three to four times the premium pricing for veterinary-prescribed diets that promise specific health outcomes. The trend is particularly evident in Shanghai, Tokyo, and Singapore, where pet specialty retailers report that sales of therapeutic diets have increased.
E-commerce and Live-Stream Retail Amplification
Live-streaming platforms have emerged as particularly powerful sales channels, enabling veterinarians and pet nutrition specialists to demonstrate product benefits in real-time while building consumer trust through educational content. This digital shift addresses traditional barriers to prescription diet access, particularly in secondary cities where veterinary specialty stores remain limited. Cross-border e-commerce platforms are simultaneously expanding access to international therapeutic nutrition brands, with China's relaxed CBEC (Central Board of Excise and Customs) quotas enabling the direct import of specialized formulations that were previously unavailable in domestic markets.
Restraints Impact Analysis*
| Restraint | (~) % Impact on CAGR Forecast | Geographic Relevance | Impact Timeline |
|---|---|---|---|
| High price differential versus conventional pet food | -1.5% | Price-sensitive emerging Asia-Pacific markets | Short term (≤2 years) |
| Country-specific regulatory and import approval delays | -1.2% | China, India, Indonesia, and Thailand | Medium term (2-4 years) |
| Risk of counterfeit prescription diets online | -0.8% | Core Asia-Pacific e-commerce ecosystems | Medium term (2-4 years) |
| Protein-input price volatility | -1.0% | ASF-affected regions in Vietnam and southern China | Short term (≤2 years) |
| Source: Mordor Intelligence | |||
High Price Differential Versus Conventional Pet Food
The 2-4 times price premium of therapeutic diets compared to conventional pet food creates significant adoption barriers, particularly in price-sensitive markets where pet ownership is expanding rapidly but disposable income remains constrained. This pricing gap is most pronounced in emerging Asia-Pacific markets, where therapeutic diets can cost USD 80-120 per month compared to USD 20-30 for standard nutrition products. The challenge is compounded by limited pet insurance penetration across the region, leaving consumers to bear the full costs of therapeutic nutrition out of pocket. Market education efforts by veterinary channels are gradually improving value perception, but price sensitivity remains a fundamental constraint on mass market adoption.
Protein-Input Price Volatility
African Swine Fever outbreaks across Vietnam and southern China in 2025 have disrupted protein supply chains, increasing premium protein costs by 15-20% and creating margin pressure for therapeutic diet manufacturers [2]Source: Vietnam Ministry of Agriculture and Rural Development, “African Swine Fever Control Measures,” mard.gov.vn . This volatility is particularly challenging for prescription diet formulations that require specific protein profiles and cannot easily substitute ingredients without regulatory re-approval. Climate-related supply disruptions, including the effects of El Niño on agricultural production, add additional uncertainty to protein sourcing costs. Companies with diversified protein sourcing strategies and alternative protein capabilities are better positioned to manage these cost pressures.
*Our forecasts treat driver/restraint impacts as directional, not additive. The impact forecasts reflect baseline growth, mix effects, and variable interactions.
Segment Analysis
By Sub-Product: Digestive Health Commands Premium Positioning
Digestive sensitivity diets maintain the largest market share at 18.72% in 2025, reflecting widespread recognition of gastrointestinal health as a foundational element of overall pet wellness. The leadership position of this segment is primarily driven by the high prevalence of digestive issues among pets in the region, particularly affecting both dogs and cats. The segment's strong performance is supported by increasing pet owner awareness about digestive health and the growing demand for specialized pet diets that effectively address gastrointestinal sensitivities. These diets are specifically formulated with digestive enzymes, prebiotic fibers, and probiotics to support digestive health and boost the immune system. Major market players have been expanding their product portfolios in this segment, offering customized solutions for different breeds and age groups of pets.
Urinary tract disease formulations represent the fastest-growing segment, with a 7.22% CAGR through 2031, driven by the increasing prevalence of urinary issues in indoor cats and aging pet populations across urban Asia-Pacific markets. This remarkable growth is driven by the increasing prevalence of urinary tract infections among pets, particularly in cats and dogs. The segment's expansion is further supported by growing awareness among pet owners about the importance of specialized pet diets in preventing and managing urinary system conditions. These diets are specifically formulated to maintain optimal urinary pH levels and prevent the formation of crystals in the bladder. The segment's growth is also bolstered by continuous product innovations from leading manufacturers who are introducing advanced formulations with enhanced therapeutic properties.


By Pets: Dog Dominance Faces Feline Challenge
Dogs command 47.86% market share in 2025 with a CAGR of 7.3% through 2031, benefiting from higher average body weights that require larger therapeutic diet volumes and their traditional role as primary companion animals across Asia-Pacific cultures. This significant market share is primarily attributed to dogs being the most commonly owned pets in the region, with a population reaching nearly 176 million in 2024. The segment's dominance is further strengthened by dogs' higher susceptibility to various health conditions requiring dietary management, including digestive sensitivity, urinary tract diseases, and renal issues. The segment's robust performance is supported by increasing pet humanization trends and growing awareness among dog owners about the importance of specialized pet diets for managing their pets' health conditions.
Cats are experiencing growth at a 6.55% CAGR through 2031, driven by species-specific therapeutic innovations and increasing recognition of feline-unique nutritional requirements. This accelerated growth is driven by the increasing awareness among cat owners about specific dietary needs and health conditions common in cats, such as urinary tract diseases and digestive sensitivities. The segment's growth is particularly strong in countries such as China, Japan, and Indonesia, where a rising trend of cat ownership is observed in urban areas. Urinary tract disease diets and digestive sensitivity diets are the most popular veterinary diet categories for cats, reflecting the high prevalence of these health issues in the feline population. The segment's growth is further supported by the development of more specialized and targeted nutritional solutions by major pet food manufacturers.
By Distribution Channel: Specialty Stores Navigate Digital Disruption
Specialty stores maintain the largest distribution share at 29.35% in 2025, leveraging their expertise in therapeutic nutrition counseling and veterinary relationships to provide value-added services that justify premium positioning. Specialty stores represent a significant channel, offering expert advice and a comprehensive range of veterinary diets along with personalized customer service. Specialty shops remain an important secondary channel. They continue to play a significant role because of their trained staff, curated product ranges, and access to premium and functional pet treats that appeal to knowledgeable or health-conscious pet owners.
Online channels are experiencing the fastest growth, at an 8.06% CAGR through 2031, driven by convenience factors and the ability to access specialized products that are unavailable in local markets. This channel's prominence is primarily attributed to its ability to offer competitive pricing options and a wider selection of veterinary diets, particularly for high-cost products like digestive sensitivity and urinary tract diets. The segment's success is further bolstered by the convenience of home delivery services and the availability of detailed product information and reviews that help pet owners make informed purchasing decisions. Online platforms have also become increasingly popular due to their ability to provide educational resources about veterinary diets, enabling pet owners to better understand the nutritional needs of their pets.
Geography Analysis
China dominates the Asia-Pacific pet diet market with 34.75% share in 2025, driven by rapid urbanization, expanding middle-class pet ownership, and regulatory liberalization that has streamlined access to international therapeutic nutrition brands. The market's growth trajectory reflects the country's evolving pet culture, where companion animals are increasingly receiving healthcare investments comparable to those for family members. Recent regulatory developments, including China's August 2025 draft pet food hygiene standards, signal the government's commitment to establishing world-class quality frameworks that will likely favor established therapeutic nutrition providers while creating barriers for smaller regional players .
India represents the fastest-growing geography, with a 10.2% CAGR through 2031, driven by expanding middle-class pet ownership and the growth of veterinary infrastructure in tier-2 cities. The Indian market is experiencing rapid premiumization, with functional pet food categories such as urinary health products and weight control formulations showing exceptional growth rates. Improved access via online/e-commerce channels and veterinary clinics stocking therapeutic diets drives the market.
Southeast Asian markets, including Thailand, Vietnam, Malaysia, the Philippines, Indonesia, and Taiwan, collectively represent emerging opportunities with varying growth trajectories and regulatory frameworks. Thailand's market shows strong growth in cat food segments and premiumization trends, while Vietnam is experiencing rapid expansion despite supply chain challenges related to African Swine Fever outbreaks.
Competitive Landscape
The Asia-Pacific pet veterinary diet market exhibits a fragmented structure with a mix of global conglomerates and specialized regional players. Global companies, including Mars, Incorporated, Colgate-Palmolive Company (Hill's Pet Nutrition, Inc.), General Mills Inc., PLB International, and Affinity Petcare S.A., have accounted for a market share of 10.1% in 2024 and leverage their extensive research capabilities, established brand portfolios, and widespread distribution networks to maintain significant market positions. These multinational players often operate through local subsidiaries and partnerships to better understand and serve regional market needs. Regional specialists, meanwhile, compete by offering products tailored to local preferences and maintaining strong relationships with veterinary professionals and specialty retailers.
The market is characterized by ongoing consolidation activities as larger players seek to expand their presence through strategic acquisitions of smaller, specialized companies. This trend is particularly evident in emerging markets where established companies are acquiring local players to gain immediate market access and distribution capabilities. The competitive landscape is further shaped by vertical integration strategies, with companies investing in their supply chains and distribution networks to ensure product quality and market reach. Joint ventures and strategic alliances are becoming increasingly common as companies seek to combine complementary strengths and address market opportunities more effectively.
Strategic patterns reveal a focus on vertical integration and direct-to-consumer capabilities, with companies investing in e-commerce platforms and subscription-based delivery models to capture higher margins and build stronger customer relationships. White-space opportunities exist in microbiome-targeted therapeutics and precision nutrition approaches that address specific genetic or metabolic profiles.
Asia-Pacific Pet Diet Industry Leaders
Mars, Incorporated
Colgate-Palmolive Company (Hill's Pet Nutrition, Inc.)
General Mills Inc.
PLB International
Affinity Petcare S.A
- *Disclaimer: Major Players sorted in no particular order

Recent Industry Developments
- March 2025: Nestlé officially terminated its South Korean pet food joint venture and launched its independent division, investing USD 15 million in direct market operations to capture greater value from the country's premium therapeutic nutrition segment. This strategic shift reflects the company's commitment to controlling distribution channels in the high-growth Asia-Pacific market.
- April 2023: Mars Incorporated opened its first pet food research and development center in the Asia-Pacific region. This new facility, called the Asia Pacific pet center, will support the company's product development.
- March 2023: Colgate-Palmolive Company's pet care subsidiary Hill’s Pet Nutrition launched its new line of prescription diets to support pets diagnosed with cancer. This prescription line, Diet ONC Care, offers complete and balanced formulas in both dry and wet forms for cats and dogs.


Asia-Pacific Pet Diet Market Report Scope
Diabetes, Digestive Sensitivity, Oral Care Diets, Renal, and Urinary tract disease are covered as segments by Sub Product. Cats and Dogs are covered as segments by Pets. Convenience Stores, Online Channel, Specialty Stores, and Supermarkets/Hypermarkets are covered as segments by the the Distribution Channel. Australia, China, India, Indonesia, Japan, Malaysia, Philippines, Taiwan, Thailand, and Vietnam are covered as segments by Country.
| Diabetes |
| Digestive Sensitivity |
| Oral Care Diets |
| Renal |
| Urinary tract disease |
| Derma Diets |
| Obesity Diets |
| Other Veterinary Diet |
| Cats |
| Dogs |
| Other Pets |
| Convenience Stores |
| Online Channel |
| Specialty Stores |
| Supermarkets/Hypermarkets |
| Other Channels |
| Australia |
| China |
| India |
| Indonesia |
| Japan |
| Malaysia |
| Philippines |
| Taiwan |
| Thailand |
| Vietnam |
| Rest of Asia-Pacific |
| Sub Product | Diabetes |
| Digestive Sensitivity | |
| Oral Care Diets | |
| Renal | |
| Urinary tract disease | |
| Derma Diets | |
| Obesity Diets | |
| Other Veterinary Diet | |
| Pets | Cats |
| Dogs | |
| Other Pets | |
| Distribution Channel | Convenience Stores |
| Online Channel | |
| Specialty Stores | |
| Supermarkets/Hypermarkets | |
| Other Channels | |
| Country | Australia |
| China | |
| India | |
| Indonesia | |
| Japan | |
| Malaysia | |
| Philippines | |
| Taiwan | |
| Thailand | |
| Vietnam | |
| Rest of Asia-Pacific |


Market Definition
- FUNCTIONS - Pet foods are usually intended to provide complete and balanced nutrition to the pet but are primarily used as functional products. The scope includes the food and supplements consumed by pets including veterinary diets. Supplements/nutraceuticals that are directly supplied to pets are considered within the scope.
- RESELLERS - Companies engaged in reselling of pet food without value addition have been excluded from the market scope, in order to avoid double counting.
- END CONSUMERS - Pet owners are considered to be the end-consumers in the market studied.
- DISTRIBUTION CHANNELS - Supermarkets/hypermarkets, specialty stores, convenience stores, online channels and other channels are considered within the scope. The stores which are exclusively providing pet related basic and custom products are considered within the scope of specialty stores.
| Keyword | Definition |
|---|---|
| Pet Food | The scope of pet food includes the food that is eatable by pets including food, treats, veterinary diets, and nutraceuticals/supplements. |
| Food | Food is animal feed intended for consumption by pets. It is formulated to provide essential nutrients and meet the dietary needs of various types of pets, including dogs, cats, and other animals. These are generally segmented into dry and wet pet foods. |
| Dry Pet Food | Dry pet foods may be extruded/baked (kibbles) or flaked. They have a lower moisture content, typically around 12-20%. |
| Wet Pet Food | Wet pet food, also known as canned pet food or moist pet food, generally has a higher moisture content compared to dry pet food, often ranging from 70-80%. |
| Kibbles | Kibbles are dry, processed pet food in small, bite-sized pieces or pellets. They are specifically formulated to provide balanced nutrition for various domestic animals, such as dogs, cats, and other animals. |
| Treats | Pet Treats are special food items or rewards given to pets, to show affection, and encourage good behavior. They are especially used during training. Pet treats are made from various combinations of meat or meat-derived materials with other ingredients. |
| Dental Treats | Pet dental treats are specialized treats that are formulated to promote good oral hygiene in pets. |
| Crunchy Treats | It is a type of pet treat that has a firm and crispy texture which can be a good source of nutrition for pets. |
| Soft and chewy treats | Soft and Chewy pet treats are a type of pet food product that is formulated to be easy to chewy and digest. They are usually made from soft and pliable ingredients, such as meat, poultry, or vegetables, that have been blended and formed into bite-sized pieces or strips. |
| Freeze-dried & Jerky Treats | Freeze-dried and jerky treats are snacks given to pets, that are prepared through a special preservation process, without damaging the nutritional content, resulting in long-lasting, nutrient-rich treats. |
| Urinary Tract Disease Diets | These are commercial diets that are specifically formulated to promote urinary health and reduce the risk of urinary tract infections and other urinary problems. |
| Renal Diets | These are specialized pet foods formulated to support the health of pets with kidney disease or renal insufficiency. |
| Digestive Sensitivity Diets | Digestive-sensitive diets are specially formulated to meet the nutritional needs of pets with digestive issues such as food intolerances, allergies, and sensitivities. These diets are designed to be easily digestible and to reduce the symptoms of digestive problems in pets. |
| Oral Care Diets | Oral care diets for pets are specially formulated diets produced to promote oral health and hygiene in pets. |
| Grain-Free Pet Food | Pet food that does not contain common grains like wheat, corn, or soy. Grain-free diets are often preferred by pet owners seeking alternative options or if their pets have specific dietary sensitivities. |
| Premium Pet Food | High-quality pet food formulated with superior ingredients often offers additional nutritional benefits compared to standard pet food. |
| Natural Pet Food | Pet food made from natural ingredients, with minimal processing and without artificial preservatives. |
| Organic Pet Food | Pet food is produced using organic ingredients, free from synthetic pesticides, hormones, and genetically modified organisms (GMOs). |
| Extrusion | A manufacturing process used to produce dry pet food, where ingredients are cooked, mixed, and shaped under high pressure and temperature. |
| Other Pets | Other pets include birds, fish, rabbits, hamsters, ferrets, and reptiles. |
| Palatability | The taste, texture, and aroma of pet food influence its appeal and acceptance by pets. |
| Complete and Balanced Pet Food | Pet food that provides all essential nutrients in appropriate proportions to meet the nutritional needs of pets without additional supplementation. |
| Preservatives | These are the substances that are added to pet food to extend its shelf life and prevent spoilage. |
| Nutraceuticals | Food products that offer health benefits beyond basic nutrition, often contain bioactive compounds with potential therapeutic effects. |
| Probiotics | Live beneficial bacteria that promote a healthy balance of gut flora, supporting digestive health and immune function in pets. |
| Antioxidants | Compounds that help neutralize harmful free radicals in the body, promoting cellular health and supporting the immune system in pets. |
| Shelf-Life | The duration of which pet food remains safe and nutritionally viable for consumption after its production date. |
| Prescription diet | Specialized pet food formulated to address specific medical conditions under veterinary supervision. |
| Allergen | A substance that can cause allergic reactions in some pets, leading to food allergies or sensitivities. |
| Canned food | Wet pet food that is packed in cans and contains higher moisture content than dry food. |
| Limited ingredient diet (LID) | Pet food formulated with a reduced number of ingredients to minimize potential allergens. |
| Guaranteed Analysis | The minimum or maximum levels of certain nutrients present in pet food. |
| Weight management | Pet food designed to help pets maintain a healthy weight or support weight loss efforts. |
| Other Nutraceuticals | It includes prebiotics, antioxidants, digestive fiber, enzymes, essential oils and herbs. |
| Other Veterinary Diets | It includes weight management diets, skin and coat health, cardiac care, and joint care. |
| Other Treats | It includes rawhides, mineral blocks, lickables, and catnips. |
| Other Dry Foods | It includes cereal flakes, mixers, meal toppers, freeze-dried foods, and air-dried foods. |
| Other Animals | It includes birds, fish, reptiles, and small animals (rabbits, ferrets, hamsters). |
| Other Distribution Channels | It includes veterinary clinics, local unregulated stores, and feed and farm stores. |
| Proteins and Peptides | Proteins are large molecules composed of basic units called amino acids which help in the growth and development of pets. Peptides are the short string of 2 to 50 amino acids. |
| Omega-3 fatty acids | Omega-3 fatty acids are essential polyunsaturated fats that play a crucial role in the overall health and well-being of Pets |
| Vitamins | Vitamins are the essential organic compounds that are essential for vital physiological functioning. |
| Minerals | Minerals are naturally occurring inorganic substances that are essential for various physiological functions in pets. |
| CKD | Chronic Kidney Disease |
| DHA | Docosahexaenoic Acid |
| EPA | Eicosapentaenoic Acid |
| ALA | Alpha-linolenic Acid |
| BHA | Butylated Hydroxyanisol |
| BHT | Butylated Hydroxytoluene |
| FLUTD | Feline Lower Urinary Tract Disease |


Research Methodology
Mordor Intelligence follows a four-step methodology in all our reports.
- Step-1: IDENTIFY KEY VARIABLES: In order to build a robust forecasting methodology, the variables and factors identified in Step-1 are tested against available historical market numbers. Through an iterative process, the variables required for market forecast are set and the model is built on the basis of these variables.
- Step-2: Build a Market Model: Market-size estimations for the forecast years are in nominal terms. Inflation is not a part of the pricing, and the average selling price (ASP) is kept constant throughout the forecast period.
- Step-3: Validate and Finalize: In this important step, all market numbers, variables and analyst calls are validated through an extensive network of primary research experts from the market studied. The respondents are selected across levels and functions to generate a holistic picture of the market studied.
- Step-4: Research Outputs: Syndicated Reports, Custom Consulting Assignments, Databases & Subscription Platforms


