
AI In Construction Market Size and Share
Market Overview
| Study Period | 2020 - 2031 |
|---|---|
| Market Size (2026) | USD 12.94 Billion |
| Market Size (2031) | USD 27.92 Billion |
| Growth Rate (2026 - 2031) | 16.62 % |
| Fastest Growing Market | Asia Pacific |
| Largest Market | North America |
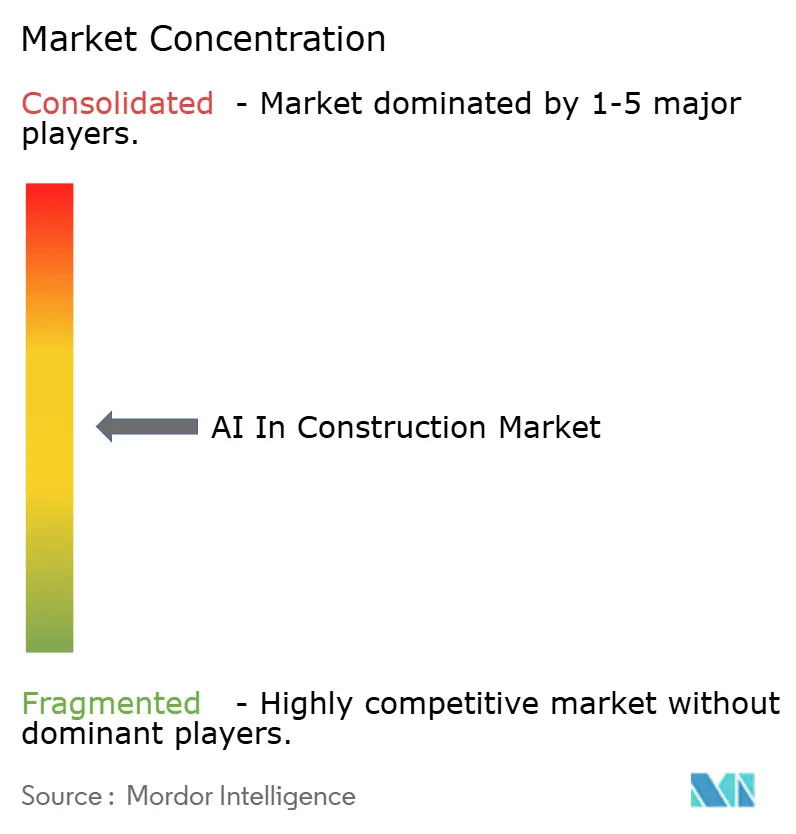
| Market Concentration | Medium |
Major Players *Disclaimer: Major Players sorted in no particular order Image © Mordor Intelligence. Reuse requires attribution under CC BY 4.0. | |
AI In Construction Market Analysis by Mordor Intelligence
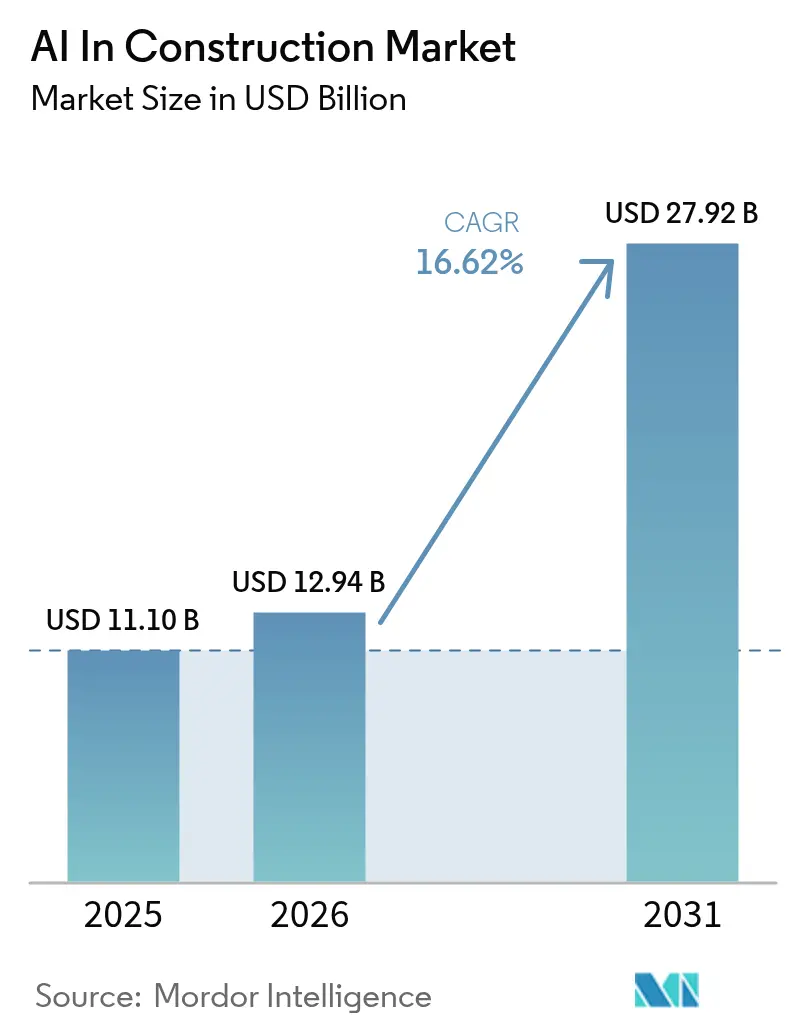
The AI in construction market size in 2026 is estimated at USD 12.94 billion, growing from 2025 value of USD 11.1 billion with 2031 projections showing USD 27.92 billion, growing at 16.62% CAGR over 2026-2031. Rising capital flows into digital infrastructure, sweeping labor shortages, and tightening safety mandates are prompting contractors to adopt intelligent automation at scale. Contractors use predictive analytics to rein in overruns, cloud-native platforms to unify siloed data, and autonomous equipment to close widening skills gaps. Major owners earmark record budgets for AI-ready data centers, while regulators codify AI-based safety and emissions reporting standards that raise technology adoption urgency. Competitive intensity heightens as incumbents integrate AI into familiar workflows to defend their share against venture-backed specialists that promise step-change productivity gains.
Key Report Takeaways
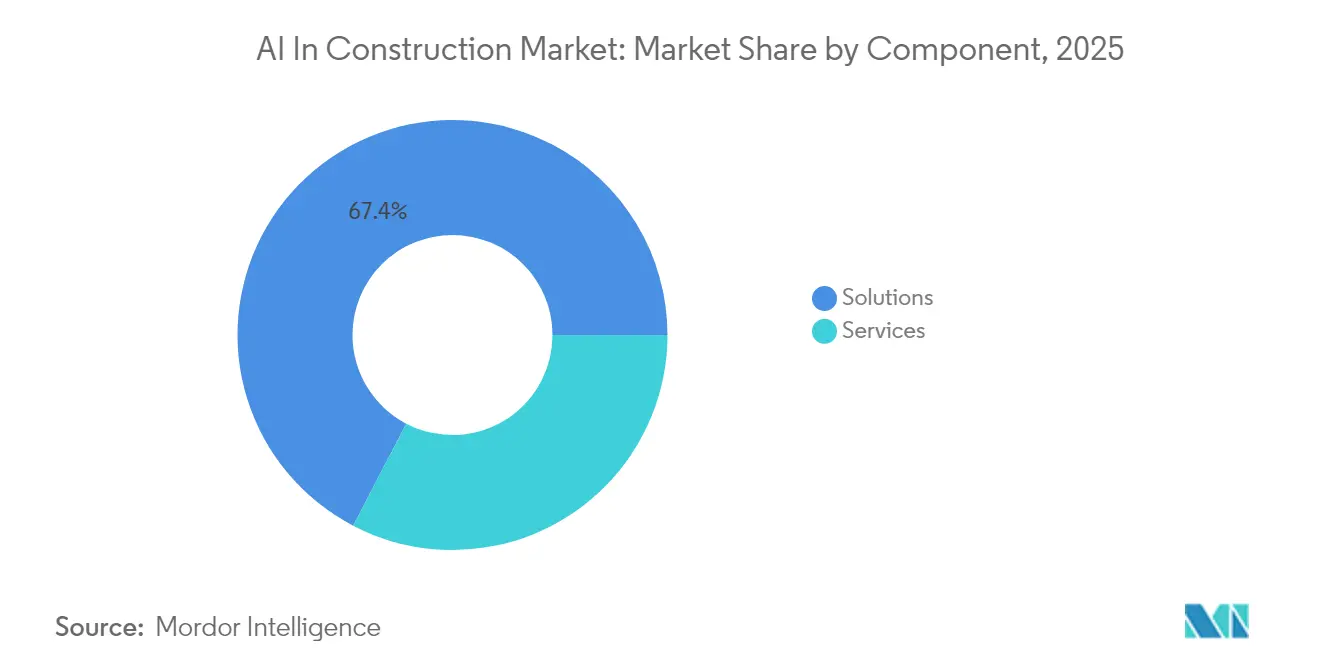
- By component, solutions held 67.35% of the revenue in the AI in construction market in 2025, while services are projected to post a 32.45% CAGR through 2031.
- By application, planning and design, led by 34.92% of the AI in construction market share in 2025, is set to expand at a 36.41% CAGR.
- By deployment, cloud captured a 61.22% share of the AI in construction market size in 2025, but Hybrid models are tracking a 35.26% CAGR.
- By project lifecycle phase, pre-construction held a 37.28% share in 2025 of the AI in construction market; post-construction/O&M is on track for a 40.24% CAGR.
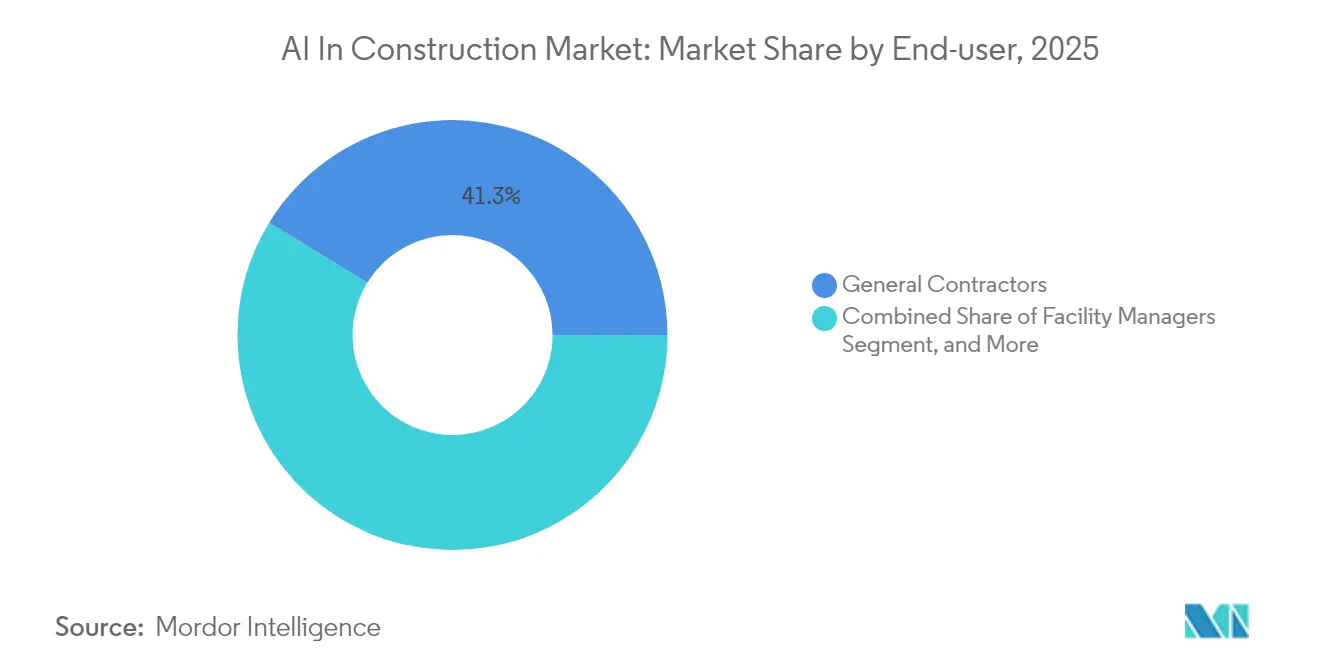
- By end-user, general contractors commanded 41.25% of demand in 2025 in the AI in construction market, whereas Facility Managers led growth at a 34.62% CAGR.
- By project type, commercial projects led with 36.30% share in 2025 in the AI in construction, yet Infrastructure is forecast to accelerate at 30.12% CAGR.
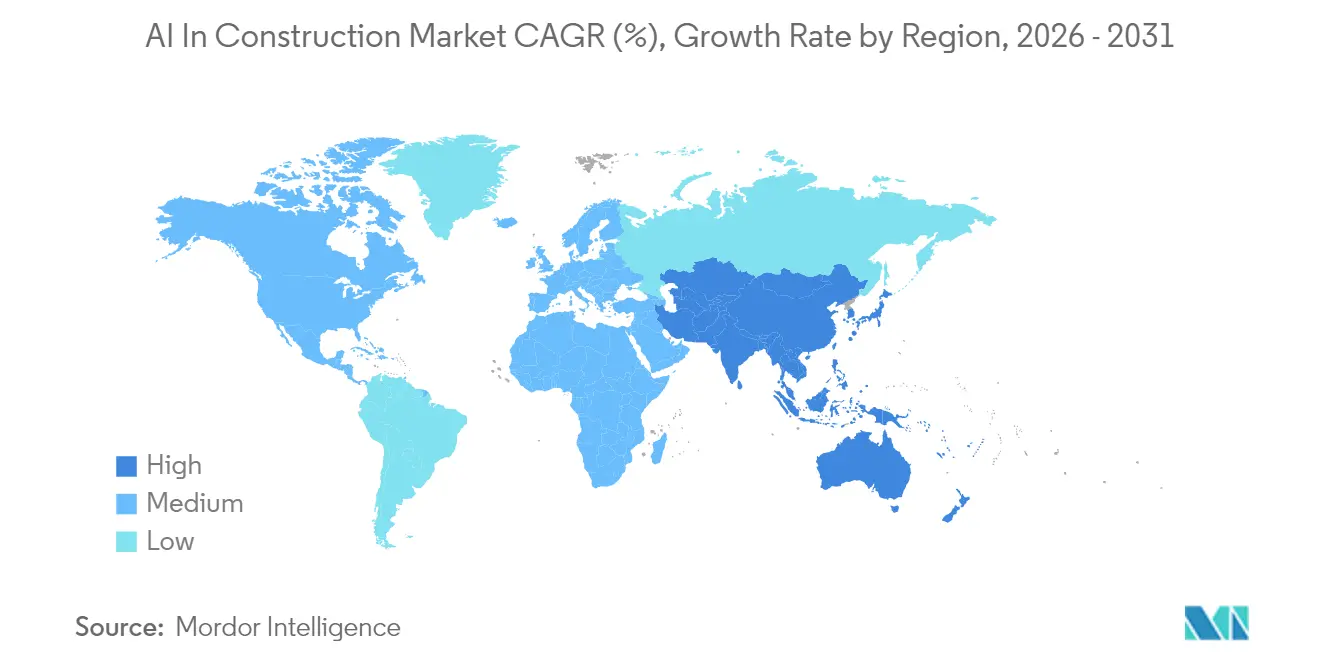
- By geography, North America contributed 42.25% revenue in 2025 in the AI in construction; Asia Pacific is poised for a 32.26% CAGR through 2031.
Note: Market size and forecast figures in this report are generated using Mordor Intelligence’s proprietary estimation framework, updated with the latest available data and insights as of 2026.
Market Trends and Insights
Drivers Impact Analysis of AI In Construction Market*
| Driver | (~) % Impact on CAGR Forecast | Geographic Relevance | Impact Timeline |
|---|---|---|---|
| Cost and schedule optimisation via predictive analytics | +3.2% | Global with early adoption in North America and EU | Medium term (2-4 years) |
| Construction-site safety compliance acceleration | +2.8% | Global, driven by US and EU regulation | Short term (≤ 2 years) |
| Labour-shortage-driven robotics adoption | +4.1% | APAC core, spill-over to North America | Medium term (2-4 years) |
| ESG-linked demand for low-carbon, data-rich projects | +2.3% | EU leading, expanding to North America and APAC | Long term (≥ 4 years) |
| Boom in AI-ready data-centre projects | +3.7% | Global, concentrated in US, South Korea, China | Short term (≤ 2 years) |
| Maturity of openBIM standards enabling AI interoperability | +1.9% | Global, advanced in developed markets | Long term (≥ 4 years) |
| Source: Mordor Intelligence | |||
Cost and schedule optimisation via predictive analytics
Predictive analytics halves overruns by simulating thousands of schedule variations against live resource, weather, and supply-chain inputs, as Zachry Construction’s use of ALICE Core confirms.[1]Engineering News-Record, “Zachry Tests ALICE AI for Megaproject Scheduling,” enr.comContractors report 37% labour-productivity gains and 41% fewer change orders once models flag clashes before crews mobilise. These quantifiable wins make predictive planning the default starting point for digital-first project delivery in the AI in construction market.
Construction-site safety compliance acceleration
Computer-vision gateways now detect missing PPE, unsafe proximity, or equipment failures in real time, cutting incident rates by 67.5% and insurance claims by 36.8%. The US Department of Homeland Security’s critical-infrastructure guidance endorses AI-enabled risk assessment, strengthening the regulatory tailwind.[2]DHS, “Critical Infrastructure AI Safety Guide,” dhs.gov Contractors such as GCC use Buildots to inspect 70,000 elements weekly, alerting crews before hazards escalate. As penalties rise, safety-first AI becomes a board-level mandate.
Labour-shortage-driven robotics adoption
Robots now assume rebar tying, bricklaying, and solar pile driving, trimming dangerous work hours by 72% and boosting accuracy by 55%. Japan’s Kajima Corporation orchestrates unmanned machinery via the A4CSEL platform, tackling up to 7,000 micro-tasks per shift.[3]The Asahi Shimbun, “Kajima’s A4CSEL Automates Heavy Equipment,” asahi.comThe technology lets owners proceed despite aging craftspeople, especially across APAC, where deficits are most acute. Autonomous solutions, therefore, rank among the strongest growth vectors in the AI in construction market.
ESG-linked demand for low-carbon, data-rich projects
AI selects materials, predicts HVAC loads, and automates off-site fabrication, driving 25% carbon cuts versus legacy approaches. Platforms like Estabild feed live-site data into ESG dashboards so builders can prove compliance to investors in real time. Europe’s taxonomy regulations push contractors to quantify embedded carbon, turning AI from optional to essential for qualification.
Restraints Impact Analysis of AI In Construction Market*
| Restraint | (~) % Impact on CAGR Forecast | Geographic Relevance | Impact Timeline |
|---|---|---|---|
| High upfront investment and unclear ROI | -2.1% | Global, most severe for SME contractors | Short term (≤ 2 years) |
| Shortage of AI-literate construction talent | -1.8% | Global, acute in developed markets | Medium term (2-4 years) |
| Fragmented project data and legacy siloed systems | -1.5% | Global legacy markets | Long term (≥ 4 years) |
| Forthcoming AI-governance and transparency rules | -1.2% | EU leading, expanding globally | Medium term (2-4 years) |
| Source: Mordor Intelligence | |||
High upfront investment and unclear ROI
Comprehensive AI roll-outs frequently exceed USD 100,000 before benefits materialise, a threshold that sidelines many subcontractors. Project-based revenue models further complicate payback calculations, slowing the early-stage uptake of AI in the construction market.
Shortage of AI-literate construction talent
Universities have only recently added data-science modules to construction curricula, leaving firms to compete for scarce specialists who command premium wages. Skill shortages lengthen pilot timelines and dilute achievable savings, tempering near-term growth.
*Our forecasts treat driver/restraint impacts as directional, not additive. The impact forecasts reflect baseline growth, mix effects, and variable interactions.
AI In Construction Market Segment Analysis
By Component:
Solutions Lead While Services AccelerateSolutions accounted for 67.35% of 2025 spend as contractors rushed to license off-the-shelf platforms that plug easily into existing workflows. Service revenues trail in absolute terms yet they are projected to climb at a 32.45% CAGR because enterprises now hire integrators to tune algorithms to project-specific data sets. The AI in construction market size for Services is set to close the gap as adopters prioritise change-management expertise over stand-alone code. Multimodal suites from Trimble stitch generative design, project controls, and automated quantity take-off into one interface, dampening point-solution appeal.
Consultants, systems integrators, and specialised trainers capture mindshare by cleaning legacy datasets, building data lakes, and managing continuous-improvement loops. Their growing foothold signals that technology competitiveness in the AI in construction market hinges as much on advisory depth as on algorithm horsepower.



By Application:
Planning and Design Dominance Challenged by Safety SurgePlanning and Design led with a 34.92% share in 2025, driven by generative design workflows that reduce design timelines by 50%. However, Safety and Risk Management is forecast to outpace all peers, with a 38.02% CAGR, as regulators tighten oversight. Cloud-vision engines streamline inspections, while wearable sensors send alerts directly to supervisors. This pull from safety compliance positions, Safety and Risk Management,to rewrite the AI in construction market share hierarchy by 2031.
Applications such as autonomous equipment control and predictive maintenance follow closely. Robots scale repetitive tasks, while sensor-driven maintenance reduces idle time by 25-40%. Collectively, emergent use cases diversify revenue channels and amplify vendor differentiation.
By Deployment:
Cloud Leadership Faces Hybrid ChallengeCloud platforms captured 61.22% of 2025 deployments thanks to low entry barriers and instant scalability. Hybrid approaches are set to record a 35.26% CAGR as owners insist on local data sovereignty while still exploiting cloud analytics. The AI in construction market size tied to Hybrid models climbs quickly in regions with patchy site connectivity. Vendors now ship containerised inference engines that run at the edge but sync to the cloud for model retraining, satisfying both uptime and security mandates.
On-premises solutions linger for mega contractors with sunk IT investments. Yet even these firms test hybrid add-ons for remote projects where pop-up networks cannot support large-data syncs. Flexibility therefore defines next-generation deployment decisions.
By Project-Lifecycle Phase:
Pre-construction Leads as Post-construction SurgesPre-construction claimed 37.28% of 2025 spend, reflecting the conviction that early-stage optimisation yields the highest return. Digital feasibility modelling, AI-driven cost estimation, and virtual coordination all compress pre-build cycles. Post-construction/O&M is forecast for a 40.24% CAGR as facility managers unlock new revenue from AI-enabled predictive maintenance and energy tuning. This segment will materially expand the AI in construction market by linking contractors to long-term asset-management income streams.
Construction-phase solutions such as progress tracking and quality control remain core, yet future growth tilts toward lifetime performance analytics delivered through digital twins that update continuously and inform renovation planning.
By End-user:
General Contractors Lead While Facility Managers AccelerateGeneral Contractors controlled 41.25% of expenditure in 2025 by embedding scheduling bots and resource-allocation models across multibillion pipelines. Facility Managers hold the fastest lane with a 34.62% CAGR as building owners demand sensor-driven insights to cut energy bills and boost tenant comfort. Integration with existing CAFM and BMS stacks lifts switching costs and deepens stickiness in the AI in construction market.
Specialty Sub-contractors adopt AI for granular tasks such as bidding and take-offs, whereas Architects and Engineers tap generative design to iterate massing options in minutes. Project Owners and insurers also emerge as influential buyers of risk-analytics engines, broadening the customer base.
By Project Type:
Commercial Leadership Challenged by Infrastructure GrowthCommercial builds retained 36.30% share in 2025, leveraging AI to optimise floorplate efficiency and tenant experience. Infrastructure schemes are tracking a 30.12% CAGR on the back of record budgets for AI-ready data centers and smart-mobility corridors. Governments earmark subsidies for gigawatt-scale facilities that require liquid cooling, high-density power, and cyber-secure command layers, each of which is a catalyst for AI spending.
Residential demand rises steadily through modular design engines and embedded smart-home technology, while industrial projects deploy AI for line layout optimization and safety monitoring. Variety across project types diversifies cyclical risk for vendors in the AI in construction market.
Geography Analysis
North America AI in Construction Market
North America generated 42.25% of 2025 revenue, driven by deep venture capital pools, extensive cloud infrastructure, and OSHA’s AI-friendly safety agenda. Multi-billion data center pipelines in Utah, Virginia, and Texas hand regional contractors a definitive scale advantage. Federal funding via the Infrastructure Investment and Jobs Act further entrenches demand, particularly for AI-enabled transportation and clean-energy facilities.
APAC AI in Construction Market
The Asia Pacific is the fastest-growing territory, with a 32.26% CAGR through 2031, led by South Korea’s USD 35 billion data center plan and China’s Eastern Data, Western Compute program. Severe craft-labour shortages are pushing Japanese, Singaporean, and Australian builders toward robotics, while policymakers are embedding AI adoption in their national digital-economy roadmaps. Fragmented regulatory progress remains a hurdle to execution, but is easing as regional working groups align around ISO and openBIM standards.
EMEA and South America AI in Construction Market
Europe posts steady gains as Fit-for-55, taxonomy, and circular-economy rules compel builders to document carbon performance. AI platforms that automate material passports and energy-use forecasts thus find ready buyers. Middle East megacities adopt AI for smart-infrastructure rollouts, positioning Gulf states as lighthouse clients for greenfield digital twins. Africa and South America contribute modest volumes yet register rising pilot activity in port, rail, and renewable-energy projects, indicating long-range upside for the AI in construction market.

Regulatory Landscape
Regulation affecting AI in construction is tightening around government procurement, safety, and auditable AI governance rather than a single construction-specific AI rulebook. In the United States, the General Services Administration (GSA) issued a GSAR deviation in February 2026 introducing Basic Safeguarding of Artificial Intelligence Systems requirements for federal contracting, linking supplier obligations to disclosure and risk management practices aligned with the NIST AI Risk Management Framework. In March 2026, the White House OSTP published a National Policy Framework for AI with legislative recommendations that emphasized using existing sector regulators and procurement levers to guide AI adoption, reinforcing compliance-by-contracting dynamics for infrastructure and public works programs.
Standards are also becoming a practical compliance anchor for owners and prime contractors that need repeatable controls across multi-vendor project stacks. ISO/IEC 42001 (AI management systems) and ISO/IEC 5338:2023 (AI system life cycle processes) are increasingly referenced as governance scaffolding for how models are built, validated, monitored, and documented. In Asia, Singapore Ministry of National Development budget discussions in March 2026 highlighted AI and robotics as a response to construction labor constraints, signaling policy support for digitization while still leaving responsibility for safety, cybersecurity, and data stewardship with project participants and their contracted technology providers.
Value Chain Analysis
The AI in construction value chain starts with data creation and capture at the asset and project levels, including BIM/openBIM models, schedules and cost systems, procurement records, documents (contracts, RFIs, submittals), and jobsite telemetry from cameras, wearables, drones, and equipment sensors. These inputs flow into common data environments and cloud platforms where model developers and software vendors build analytics, computer vision, and generative AI features, then package them as modules inside construction management suites or as specialist point solutions (for example, progress tracking and schedule simulation). Deployment and integration is typically delivered by a mix of the software vendor, hyperscaler and GPU ecosystem partners, and construction-focused integrators who connect AI outputs to existing workflows in estimating, planning, safety, and quality.
Downstream, general contractors, specialty trades, owners, and facility managers operationalize the tools through field adoption, process change, and governance controls (data permissions, audit logs, human-in-the-loop approvals). Recent ecosystem activity underscores a shift toward platformization and connected data layers: McCarthy announced a multi-year, multi-million-dollar partnership with Palantir in June 2026 to implement an AI-native operations suite (Pulse) on Palantir AIP, while Procore announced integration with NVIDIA Omniverse DSX Blueprint in March 2026 to support construction of AI factories and data center infrastructure. Robotics and autonomy are extending the chain into hardware and on-site operations, illustrated by Boston Dynamics partnering with FieldAI in March 2026 to enhance Spot for autonomous inspection and progress tracking; key bottlenecks increasingly sit in skilled workforce availability (especially MEP and electrical capabilities) and site connectivity and data quality needed to sustain model performance beyond pilots.
Competitive Landscape
The field remains moderately fragmented as the top five vendors account for roughly 35% of global billings, allowing nimble entrants to secure footholds. Autodesk, Trimble, and Oracle extend integrated suites with AI add-ons to protect installed bases. AI-native challengers such as Buildots, Alice Technologies, and Doxel concentrate on high-resolution progress capture and schedule simulation to deliver distinctive ROI.
Alliances with hyperscalers accelerate product maturity. Cemex partnered Microsoft to launch the first generative-AI assistant tailored to cement and concrete workflows. Suffolk Construction joined forces with Trunk Tools to create a standardised AI toolkit deployed across 40 active jobsites. PropTech and ConTech startups raised USD 4.47 billion and USD 3.7 billion respectively during 2024, signalling renewed investor confidence.
Fast-evolving white spaces include supply-chain orchestration, regulatory compliance automation, and knowledge-graph-based design reuse. Vendors that pair data-ownership strategies with open-platform architectures are best placed to shape the next growth wave inside the AI in construction market.
AI In Construction Industry Leaders
Autodesk, Inc.
Smartvid.io, Inc.
Doxel, Inc.
Trimble Inc.
Bentley Systems, Incorporated
- *Disclaimer: Major Players sorted in no particular order
AI In Construction Market Companies Covered in this Report
- Autodesk
- Trimble
- Oracle (Aconex)
- Procore Technologies
- Bentley Systems
- NVIDIA
- IBM
- Microsoft
- Dassault Systemes
- PTC
- Smartvid.io (Newmetrix)
- Doxel
- Alice Technologies
- eSUB
- PlanRadar
- Augmenta AI
- Buildots
- nPlan
- OpenSpace AI
- FYLD

Market Opportunities and Future Outlook
A major whitespace is turning compliance and contracting friction into structured, automatable workflows, particularly for document-heavy processes (contracts, submittals, and specifications) and safety evidence trails (inspections, PPE, proximity events). Trimble signed an agreement in April 2026 to acquire Document Crunch to add AI-powered document analysis and risk management into Trimble Construction One, reflecting demand for tools that reduce legal and commercial risk while keeping teams inside primary project-delivery systems. In parallel, procurement-driven AI governance is becoming a buying criterion for public-sector and critical-infrastructure work, highlighted by GSA actions in 2026 on AI safeguarding requirements for federal contracting; this creates opportunity for vendors and integrators that embed audit logging, data controls, and AI management system practices directly into construction platforms and common data environments.
Another opportunity sits at the intersection of construction and operations, where post-construction O&M workflows benefit from unified asset data, predictive maintenance, and continuous commissioning. Autodesk announced in May 2026 a definitive agreement to acquire MaintainX (approximately USD 3.6 billion) to expand maintenance and operations capabilities within Autodesk Operations Solutions, reinforcing a market shift toward connecting delivery data with run-time asset performance. Infrastructure and heavy civil also stands out as a consolidation-led growth lane, with Nemetschek completing the acquisition of HCSS in July 2026 to deepen capabilities for heavy construction software, aligning with broader momentum in infrastructure programs and data-center-related buildouts that demand tighter schedule control, progress verification, and resource optimization across complex project portfolios.
Recent Industry Developments in AI In Construction Market
- July 2026: Nemetschek Group completed its acquisition of HCSS to expand its Build & Construct segment in heavy civil and infrastructure software. The move broadens Nemetschek's footprint in contractor-centric workflows where estimating, field execution, and equipment operations data can feed AI-driven productivity and risk controls across large infrastructure programs.
- September 2025: Autodesk announced the commercial availability of 3D generative AI foundation models for Autodesk Forma and Autodesk Fusion, and outlined plans to fold Autodesk Construction Cloud into the Forma cloud platform. This strengthened Autodesk's geometry-aware AI stack and supports tighter linkage between early-stage design decisions and downstream construction coordination and controls.
- November 2024: Trimble expanded AI assisted design and project controls within its ecosystem by unveiling SketchUp Diffusion, ProjectSight automation enhancements, and LiveCount symbol detection at its Dimensions conference. These releases advanced AI-assisted design and project controls within Trimble's ecosystem, reinforcing the trend toward embedding AI features inside established construction workflows.


AI In Construction Market Report Scope and Research Methodology
Market Definition and Coverage
This market is defined as the revenue generated from using artificial intelligence tools in construction workflows to plan, monitor, and execute projects more efficiently, including software, related services, and AI-enabled systems used on jobsites and in back offices.
Scope exclusions: We exclude general-purpose IT hardware and connectivity spending that is not purchased mainly to run or deliver AI use cases in construction.
Segments Covered in This Report
- By Component
- Solutions
- Services
- By Application
- Planning and Design
- Safety and Risk Management
- Autonomous and Semi-autonomous Equipment
- Quality and Progress Monitoring
- Predictive Maintenance
- Others
- By Deployment
- Cloud
- On-premises
- Hybrid
- By Project-Lifecycle Phase
- Pre-construction
- Construction
- Post-construction / OandM
- By End-user
- General Contractors
- Specialty Sub-contractors
- Architects and Engineers
- Project Owners / Developers
- Facility Managers
- Other End-users
- By Project Type
- Residential
- Commercial
- Industrial
- Infrastructure (Transport, Utilities)
- By Geography
- North America
- United States
- Canada
- Mexico
- South America
- Brazil
- Argentina
- Chile
- Peru
- Rest of South America
- Europe
- Germany
- United Kingdom
- France
- Italy
- Spain
- Rest of Europe
- Asia Pacific
- China
- Japan
- South Korea
- India
- Rest of Asia Pacific
- Middle East and Africa
- Middle East
- United Arab Emirates
- Saudi Arabia
- Rest of Middle East
- Africa
- South Africa
- Nigeria
- Rest of Africa
- Middle East
- North America
Data Sources, Market Sizing, and Validation
Desk Research
Desk work starts by building a fact base on construction activity and digital adoption, then mapping it to the specific AI use cases that show up in construction deployments. We mainly rely on public sources such as U.S. Census construction spending series, Bureau of Labor Statistics productivity and employment indicators, Eurostat construction output, World Bank and OECD macro and infrastructure datasets, and standards or guidance published by bodies such as NIST and ISO.
After that, we review company filings, earnings decks, reputable press, and association websites to map typical use cases and buying patterns across contractors, owners, and EPC teams. Where needed, we also use paid subscriptions for company financials and intelligence, news and financials screening, and patent databases so the model inputs remain consistent across countries and time. The sources listed here are illustrative, and we also used other public and paid references to collect, cross-check, and clarify data points.
Primary Interviews and Surveys
To convert the fact base into practical sizing, we run expert interviews and structured surveys with construction technology buyers, project leaders, system integrators, and solution specialists across major regions. The discussions help confirm adoption levels by workflow, typical pricing approaches (subscription, usage, and service-heavy deals), and the time lag between pilot projects and scaled rollouts, which is then used to refine assumptions.
Distribution of primary research fieldwork respondents
| Company type | Respondent position | Region |
|---|---|---|
| Top tier: 28% | CXOs: 12% | APAC: 47% |
| Mid tier: 57% | Functional/Unit leaders: 34% | EMEA: 31% |
| Smaller Players: 15% | Managers: 54% | Americas: 22% |
Market-Sizing & Forecasting
The sizing model is built using a top-down approach where construction output and project activity are translated into an addressable demand pool using adoption and spend intensity assumptions for AI by workflow. To keep it grounded, we cross-check totals with selective bottom-up approximations, including sampled vendor revenue disclosures, channel checks with implementation partners, and an ASP x active-customer build for a few high-visibility use cases.
Inputs that commonly move the model include construction spending by region, labor availability and wage pressure (which influences automation appetite), share of projects using BIM and digital collaboration, penetration of site monitoring and safety systems, and the cadence of infrastructure and energy projects that typically buy more analytics. For forecasting, we use scenario analysis supported by expert views on how quickly pilots convert to enterprise rollouts, then apply trend smoothing to avoid one-time spikes from large projects. Where bottom-up signals are missing for smaller geographies, we fill gaps using proxy adoption rates from similar construction markets, and then recheck implied spend per project for reasonableness.
Data Validation & Update Cycle
Outputs are validated by comparing the model against independent signals, such as software spending direction in construction, project pipeline strength, and hiring trends for data and digital roles in AEC firms. If a region shows an unusual jump, we review assumptions step by step and re-contact respondents to confirm whether the shift is real or timing-related.
Before sign-off, the work goes through multiple analyst review rounds that check unit consistency, currency conversion timing, and whether forecast drivers remain aligned with what buyers described. Reports are refreshed annually, and interim updates are done when material events occur, such as major regulation shifts, a sharp construction downturn, or a step-change in deployment patterns. Prior to delivery, a final pass is completed so clients receive the most current view available.
Mordor Intelligence's Construction Artificial Intelligence Market Sizing Compared With Other Published Estimates
Published market sizes for AI in construction can vary a lot, even when the topic sounds identical, because firms apply different counting rules and different base years. The spread is usually driven by what gets included as AI value, how services are treated, and whether the estimate reflects current adoption or a more aggressive near-term ramp.
Key gap drivers in this market often come from mixing adjacent categories like broader construction software, IoT platforms, or robotics hardware into the total, and from applying high growth rates without checking implementation lead times on real projects. When currency conversions come from different months, and when subscription pricing is projected without contract reality checks, the totals can drift, which is reflected in the table range that is largely explained by scope and assumption choices, along with a tighter inclusion rule applied in the Mordor Intelligence baseline.
Benchmark comparison
| Source | Market Size | Gaps in Research Methodology |
|---|---|---|
| Mordor Intelligence | USD 12.94 B (2026) | |
| Industry Publisher A | USD 4.86 B (2025) | Uses a lower base year and a narrower revenue capture that appears to emphasize software solutions, with less explicit treatment of service-heavy implementations and AI-enabled systems tied to construction workflows. |
| Global Publisher B | USD 3.02 B (2026) | Counts revenues closer to a factory-gate style view and can understate end-user spend when deployment, integration, and ongoing AI services are bundled through partners or captured outside the core category. |
Taken together, the comparison shows that scope alignment matters more than the math itself, especially on what is counted as AI-specific spend inside construction programs. By tying assumptions to observable construction activity signals and then sanity-checking them with interview feedback on adoption timing and pricing, we end up with a practical number that can be traced back to clear drivers and repeated in future updates.


Key Questions Answered in the Report
What is the current size of the AI in construction market?
The market stands at USD 12.94 billion in 2026 and is projected to hit USD 27.92 billion by 2031 at a 16.62% CAGR.
Which region is growing the fastest?
APAC leads growth with a 32.26% CAGR through 2031, fueled by record infrastructure spending and supportive digital-transformation policies.
Which application segment will expand the quickest?
Safety and Risk Management is forecast to grow at 38.02% CAGR as regulators strengthen job-site safety enforcement.
Why are hybrid deployments gaining traction?
Hybrid models balance cloud scalability with on-premises data security, making them ideal for sites with intermittent connectivity or strict data-sovereignty mandates.
What restrains near-term adoption among smaller contractors?
High upfront investment and limited access to AI-literate talent make it difficult for many SMEs to realise quick payback on AI initiatives.
How concentrated is vendor competition?
The market is moderately concentrated; the top five vendors control about one-third of revenue, leaving ample opportunity for specialised startups to gain share.
Page last updated on:




