Australia Fertilizer Market Size and Share
Market Overview
| Study Period | 2021 - 2031 |
|---|---|
| Forecast Data Period | 2026 - 2031 |
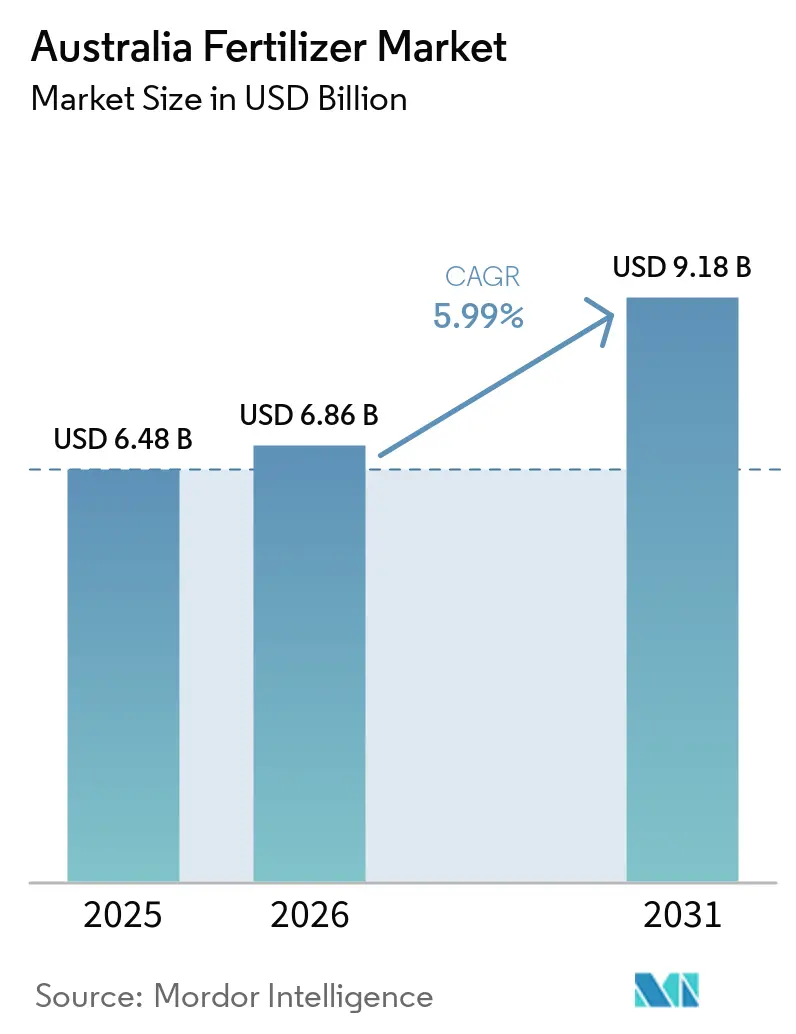
| Base Year Market Size (2025) | USD 6.48 Billion |
| Market Size (2026) | USD 6.86 Billion |
| Market Size (2031) | USD 9.18 Billion |
| Growth Rate (2026 - 2031) | 5.99% CAGR |
| Market Concentration | Low |
Major Players *Disclaimer: Major Players sorted in no particular order Image © Mordor Intelligence. Reuse requires attribution under CC BY 4.0. | |
Australia Fertilizer Market Analysis by Mordor Intelligence
The Australia fertilizer market size was valued at USD 6.48 billion in 2025 and estimated to grow from USD 6.86 billion in 2026 to reach USD 9.18 billion by 2031, at a CAGR of 5.99% during the forecast period (2026-2031). Federal support for green ammonia and a rapid shift toward precision nutrient strategies are reshaping the competitive landscape. Domestic nitrogen producers are converting existing assets to renewable-hydrogen feedstock, a move that reduces exposure to natural-gas volatility and aligns with soil-carbon credit programs. Broad-acre growers are integrating variable-rate technology with soil mapping and satellite imagery, lifting nutrient-use efficiency and boosting input purchases in high-potential zones. At the same time, controlled-environment horticulture is expanding near metropolitan markets, pulling specialty liquid and water-soluble formulations into the product mix. Regulatory tightening on cadmium in phosphate imports is driving supply-chain diversification, while state grants for water-efficient irrigation are accelerating the adoption of fertigation in tree crops and vegetables.
Key Report Takeaways
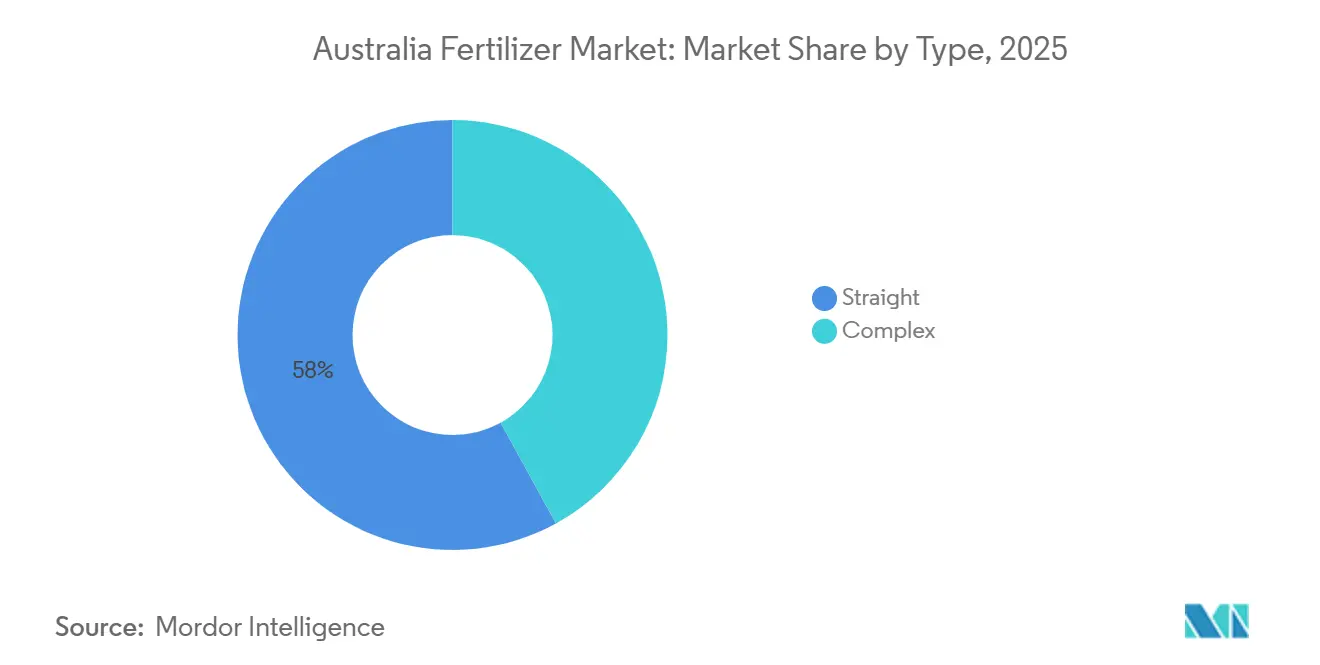
- By type, straight fertilizers accounted for 58.0% of the Australia fertilizer market in 2025 and are projected to be the fastest-growing segment, advancing at a CAGR of 6.3% through 2031.
- By form, conventional fertilizers captured the largest Australia fertilizer market share of 71.0% in 2025, while specialty fertilizers are projected to be the fastest-growing segment, growing at a CAGR of 8.2% through 2031.
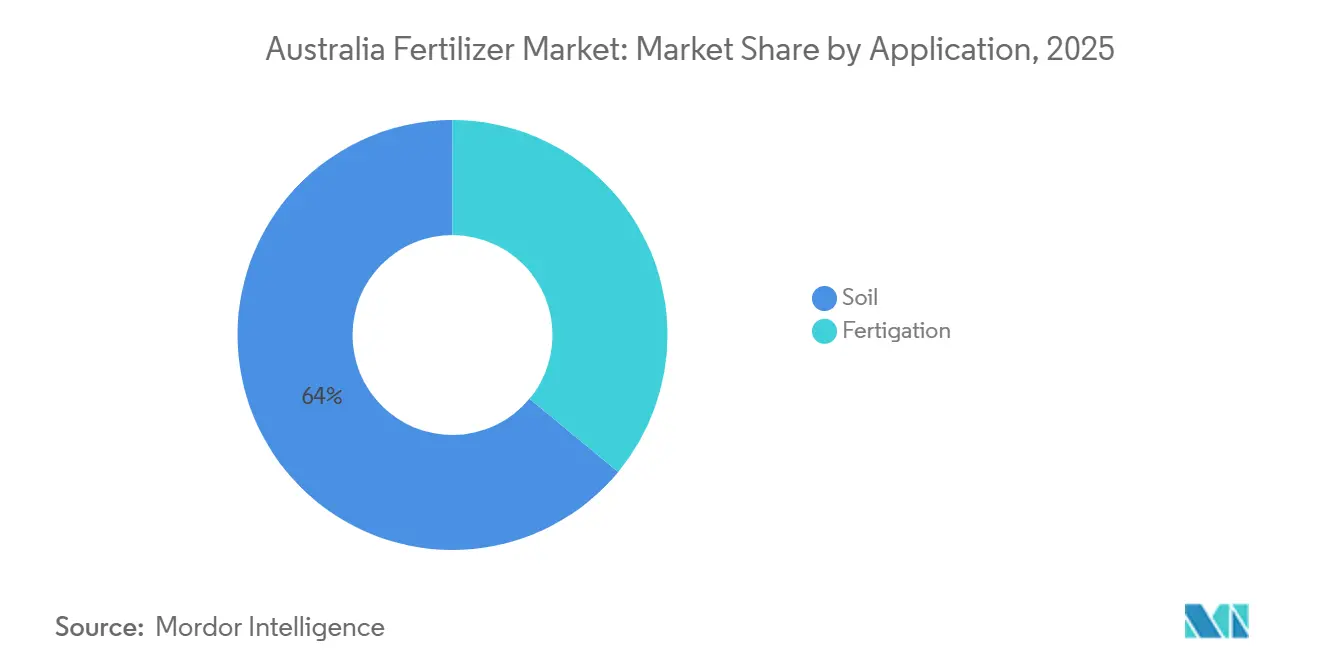
- By application mode, soil application represented the largest Australia fertilizer market size in 2025, accounting for 64.0% of the market, while fertigation is projected to be the fastest-growing application method, registering a CAGR of 6.7% through 2031.
- By crop type, field crops held a 49.0% share of the market in 2025, while horticultural crops are projected to grow at a CAGR of 7.2% through 2031.
- Australia fertilizer market is fragmented, with the top five players being Wesfarmers Limited, Yara International ASA, ICL Group Ltd, K+S Aktiengesellschaft, and Incitec Pivot Fertilisers.
Note: Market size and forecast figures in this report are generated using Mordor Intelligence’s proprietary estimation framework, updated with the latest available data and insights as of 2026.
Australia Fertilizer Market Trends and Insights
Drivers Impact Analysis*
| Driver | (~) % Impact on CAGR Forecast | Geographic Relevance | Impact Timeline |
|---|---|---|---|
| Surge in domestic urea-ammonium-nitrate plants | +1.2% | National, especially Queensland and Western Australia | Medium term (2-4 years) |
| Federal subsidies for green-ammonia projects | +0.9% | National, centered on Gibson Island and prospective Pilbara sites | Long term (≥ 4 years) |
| Broad-acre adoption of variable-rate technology | +1.1% | National, early gains in New South Wales, Victoria, and Western Australia | Short term (≤ 2 years) |
| Soil-carbon trading spurring bio-enhanced NPK demand | +0.7% | National, strongest in grazing regions | Medium term (2-4 years) |
| Phosphate-rock supply shocks catalyzing import substitution | +0.8% | National, all importing states | Short term (≤ 2 years) |
| Expansion of controlled-environment horticulture | +0.5% | Peri-urban zones in New South Wales, Victoria, and Queensland | Medium term (2-4 years) |
| Source: Mordor Intelligence | |||


Surge in Domestic Urea-Ammonium-Nitrate Plants
Local nitrogen capacity now exceeds 590,000 metric tons of ammonia per year. Incitec Pivot’s Gibson Island complex produces 300,000 metric tons and is earmarked for green hydrogen integration by 2027, while CSBP’s Kwinana plant supplies another 200,000 metric tons [1]Source: CSBP Fertilisers, “Ammonia and MAP Operations,” csbp-fertilisers.com.au. Shorter supply chains lower freight risk and provide growers with more stable pricing, supporting predictable fertilizer budgets during planting windows. Switching to renewable feedstock further shields producers from East Coast gas price spikes that have historically inflated domestic urea prices. Accelerated plant turnarounds and regional storage expansion ensure inventory coverage during peak seasonal demand. The combined effect is a tangible 1.2% point lift in long-term market growth, especially for broad-acre cereals reliant on high per-hectare nitrogen rates.
Federal Subsidies for Green-Ammonia Projects
The Hydrogen Production Tax Incentive provides substantial advantages to electrolytic hydrogen producers and has been applied to retrofit Gibson Island. Levelized green ammonia costs are anticipated to align more closely with conventional ammonia, reducing the price disparity that previously impeded adoption. Manufacturers gain from enhanced carbon-reduction branding, while growers benefit from an auditable method to lower Scope 3 emissions, improving their qualification for soil-carbon credits. The funding certainty has drawn private equity investments into large-scale electrolysis projects in the Pilbara and Central Queensland, supporting a reliable long-term supply for the Australian fertilizer market. Additionally, the incentive has encouraged research and development initiatives aimed at improving the efficiency and scalability of hydrogen production technologies.
Broad-Acre Adoption of Variable-Rate Technology
GPS-guided spreaders, yield monitors, and soil conductivity mapping are now mainstream on more than 35% of grain farms, up from 22% in 2022. Economic paybacks range from USD 0.65 to USD 14.30 per hectare depending on paddock heterogeneity, encouraging continuous hardware upgrades. Variable-rate prescriptions cut nitrogen over-use in low-yield zones by up to 25% and simultaneously raise inputs in high-potential strips, boosting total nutrient demand in aggregate. Regulatory scrutiny of nutrient runoff in the Murray-Darling Basin adds urgency, as growers can document compliance through as-applied maps. Suppliers benefit from higher-margin prescription blends and data analytics services that deepen customer stickiness.
Soil-Carbon Trading Spurring Bio-Enhanced NPK Demand
The Emissions Reduction Fund issued around 250,000 Australian Carbon Credit Units in 2024 to enterprises that increased soil carbon through improved fertilizer practices. Bio-enhanced granules containing humic acids and microbial inoculants deliver measurable nitrous oxide abatement, making them credit-eligible. Grazing enterprises in New South Wales are layering carbon revenue on top of productivity gains, funding premium nutrient programs without eroding margins. Manufacturers are rolling out third-party-verified emission-label products, and distributors are launching bundled fertilizer-plus-carbon advisory packages that lock buyers into multi-year contracts.
Restraints Impact Analysis*
| Restraint | (~) % Impact on CAGR Forecast | Geographic Relevance | Impact Timeline |
|---|---|---|---|
| Escalating natural-gas prices lifting ammonia costs | -0.9% | National, most acute in Queensland and Western Australia | Short term (≤ 2 years) |
| Stricter cadmium and heavy-metal import limits | -0.6% | National, all importing states | Medium term (2-4 years) |
| Water-allocation volatility in the Murray-Darling Basin | -0.5% | New South Wales, Victoria, and South Australia | Short term (≤ 2 years) |
| On-farm composting curbing synthetic-nutrient uptake | -0.4% | National, concentrated in organic and regenerative systems | Long term (≥ 4 years) |
| Source: Mordor Intelligence | |||
Escalating Natural-Gas Prices Lifting Ammonia Costs
East-coast spot gas regularly trades above AUD 12 per gigajoule (USD 8 per gigajoule), despite federal price caps. Gas accounts for around 70% of ammonia production expense at Gibson Island, pressuring domestic urea margins and widening the import price advantage during peak global supply phases. Although green hydrogen offers medium-term relief, conversion timelines leave a near-term cost gap that could trim demand growth in nitrogen-intensive crops like cotton and sugarcane.
Stricter Cadmium and Heavy-Metal Import Limits
From January 2024, imported phosphate fertilizers must contain less than 300 milligrams of cadmium per kilogram, down from 400 milligrams[2]Source: Australian Pesticides and Veterinary Medicines Authority, “Cadmium Standards in Fertilizer,” apvma.gov.au. Blending lower-cadmium rock raises input cost by roughly USD 10 per metric ton and squeezes margins unless price-sensitive growers accept higher retail tags. Compliance also requires additional laboratory testing and documentation, lengthening supply-chain lead times. Premium low-cadmium products may win share among export-oriented grain producers concerned about end-market residue standards, but overall market growth faces a 0.6% point drag.
*Our forecasts treat driver/restraint impacts as directional, not additive. The impact forecasts reflect baseline growth, mix effects, and variable interactions.
Segment Analysis
By Type: Straight Fertilizers Anchor Broad-Acre Blending Strategies
Straight fertilizers accounted for the largest Australia fertilizer market share in 2025, representing 58.0% of the total market, and are projected to be the fastest-growing segment, registering a CAGR of 6.3% through 2031, underpinned by wheat, barley, and canola rotations that demand flexible nutrient ratios at the paddock level. Urea remains the volume leader, delivering 46% nitrogen at the lowest cost per nutrient unit and accommodating both broadcast and liquid conversion. Di-ammonium Phosphate (DAP) and Monoammonium phosphate (MAP) satisfy phosphorus starter requirements, while superphosphate and Muriate of Potassium (MoP) address sulfur and potassium deficits in pastures and cotton fields. Zinc and manganese micronutrients are increasingly co-applied as seed dressings to correct deficiencies in alkaline soils, boosting early biomass accumulation.
Complex fertilizers combine multiple nutrients into a single granule, offering convenience for smaller growers who lack on-farm blending capabilities. NPK blends designed for specific crops, such as 15-15-15 for vegetables or 12-5-14 for pastures, simplify purchasing decisions and reduce the number of application passes, thereby lowering labor and machinery costs. These products limit flexibility, as fixed nutrient ratios may not match the varying soil fertility conditions across large paddocks. The segment's growth is supported by distributor networks that stock pre-blended formulations for regional crop mixes, reducing the need for custom orders.


By Form: Conventional Dominance Faces Specialty Innovation
The conventional form is the largest segment, 71.0% share of Australia fertilizer market in 2025, reflecting its cost efficiency and wide distributor footprint. Farmers in Australia primarily prefer conventional fertilizers due to their proven effectiveness in agricultural applications and well-established distribution networks. This segment's strength is further bolstered by its compatibility with traditional farming methods and the wide variety of products available for different crop types. Additionally, the lower cost of conventional fertilizers makes them particularly appealing to large-scale agricultural operations where cost control is a priority. The segment's steady performance is also driven by Australia's strong agricultural export sector, which sustains demand for reliable and cost-effective fertilizer solutions, including solid fertilizers.
The specialty fertilizer segment is projected to be the fastest-growing, with a CAGR of 8.2% through 2031, as drip and micro-sprinkler irrigation systems continue to proliferate. The segment's growth is further supported by increasing awareness among farmers regarding the advantages of precision agriculture and environmental sustainability. Specialty fertilizers, particularly controlled-release fertilizers (CRFs), are gaining popularity due to their ability to minimize nutrient leaching and enhance nutrient uptake efficiency. Technological advancements in coating materials and release mechanisms are also enhancing the effectiveness and reliability of these products across various crop applications.
By Application Mode: Soil Application Dominates While Fertigation Accelerates
Soil commanded a 64.0% share of the Australia fertilizer market in 2025, leveraging broadcast spreaders that cover up to 600 hectares per day. Banding phosphorus at sowing reduces fixation in calcareous soils and cuts total application rates by 10% to 15%. Deep placement of anhydrous ammonia gains traction in sugarcane and cotton, where specialized injectors minimize volatilization under warm conditions. The method encompasses various application techniques, including broadcasting, band placement, and drill application, offering farmers flexibility in their nutrient management strategies.
Fertigation applications are the fastest-growing, with a projected 6.7% CAGR through 2031, driven by increased drip-irrigated orchard area. Delivery of nutrients directly to active root zones enhances uptake efficiency, allowing 15% to 20% nitrogen savings while sustaining yield. Foliar spraying, though low in volume, remains critical for correcting micronutrient deficiencies in cereals to meet premium malt and bread wheat protein specifications. Advances in sensor-guided boom height control and droplet size optimization are improving foliar application consistency, reinforcing its complementary role.
By Crop Type: Field Crops Dominates While Horticulture Growing Fastest
Field crops are the largest segment, accounting for 49.0% of the Australia fertilizer market size in 2025, mirroring Australia’s 24 million-hectare grain and oilseed footprint. Wheat alone required roughly 1.8 million metric tons of nitrogen, with top-dress urea split applications aligning with rainfall forecasts to preserve protein levels. Canola expansion in Western Australia adds demand for Monoammonium phosphate (MAP) and elemental sulfur, while cotton’s high nitrogen and potassium regimes sustain robust sales of granular urea and Muriate of Potassium (MoP) in Queensland and New South Wales.
Horticultural crops represent the fastest-growing segment in the Australia fertilizer market, with a projected CAGR of 7.2% during 2026-2031. The increasing adoption of controlled-environment horticulture, including crops such as berries, leafy vegetables, and premium vine varieties grown in glasshouse and polytunnel facilities, is driving demand for water-soluble, fertigation-grade, and slow-release specialty fertilizers. These inputs offer higher per-unit margins compared to traditional broadacre-grade granular products. Almond orchards, now covering 50,000 hectares, favor controlled-release blends that synchronize with spring vegetative flushes and summer kernel fill [3]Source: Almond Board of Australia, “Industry Statistics,” australianalmonds.com.au. Vegetable greenhouses use high-purity nitrate products with tailored calcium-to-magnesium ratios to prevent blossom-end rot in tomatoes and cucumbers. Urban landscaping programs, including sports fields, prefer slow-release nitrogen that sustains turf color without excessive clipping, a niche yet steady demand stream.
Geography Analysis
Australia fertilizer market demonstrates distinct regional characteristics, shaped by the country's agricultural diversity, infrastructure limitations, and climatic variations. New South Wales leads the market in consumption, holding a significant share in 2025. This is attributed to the state's 6.2 million hectares of agricultural land and diverse cropping systems, including wheat, cotton, canola, and intensive horticulture. The Murray-Darling Basin's irrigation infrastructure supports high-intensity fertilizer applications; however, water allocation volatility introduces uncertainty in demand for irrigated crops.
Queensland accounts for a substantial portion of national fertilizer consumption. The state's agricultural activities, including sugar cane, cotton, and tropical horticulture, create distinct seasonal demand patterns and specialized nutrient requirements. Proximity to Asian export markets influences fertilizer logistics and pricing. Additionally, Great Barrier Reef water-quality regulations require the use of enhanced-efficiency products in coastal catchments.
Western Australia accounts for a substantial share of the fertilizer market, despite its expansive agricultural areas. The region's lower rainfall and extensive farming practices result in lower input intensities per hectare. Additionally, the state benefits from its proximity to key fertilizer production facilities, including Wesfarmers' CSBP Limited operations and the planned Perdaman urea plant. These facilities play a crucial role in ensuring a steady supply of fertilizers to meet the region's agricultural demand. The upcoming Perdaman urea plant, in particular, is projected to enhance local production capacity, reduce reliance on imports, and support the state's agricultural productivity.
Competitive Landscape
Australia fertilizer market is fragmented, with the top five companies including Wesfarmers Limited, Yara International ASA, ICL Group Ltd, K+S Aktiengesellschaft, and Incitec Pivot Fertilisers. The market structure is shaped by significant barriers to entry, including capital-intensive production facilities, well-established distribution networks, and long-term customer relationships. The market dynamics are further characterized by vertical integration, as major players manage manufacturing, importation, blending, and retail distribution to maximize value across the supply chain.
Key strategic trends in the market emphasize supply chain resilience and technological differentiation. Companies are increasingly investing in domestic production capacity to reduce reliance on imports and mitigate exposure to price volatility. For instance, Nutrien's consolidation of Ruralco and Landmark operations under the Nutrien Ag Solutions brand has created a unified platform. This platform serves 290 corporate stores and over 300 independent retailers, leveraging economies of scale and advanced data analytics capabilities.
Technology adoption is a critical source of competitive advantage in the market. Leading companies are investing in digital platforms that integrate soil testing, weather data, and crop modeling to provide prescriptive nutrient recommendations. The regulatory framework established by the Australian Pesticides and Veterinary Medicines Authority (APVMA) requires extensive product registration and quality assurance systems. This creates compliance advantages for established players while posing challenges for new entrants.
Australia Fertilizer Industry Leaders
Yara International ASA
ICL Group Ltd
K+S Aktiengesellschaft
Incitec Pivot Fertilisers
Wesfarmers Limited
- *Disclaimer: Major Players sorted in no particular order

Recent Industry Developments
- March 2025: Incitec Pivot Limited officially changed its name to Dyno Nobel Limited, while maintaining fertilizer operations through the Incitec Pivot Fertilisers subsidiary. The rebranding signals potential portfolio optimization and capital allocation priorities following years of fertilizer market volatility.
- October 2024: Orica secured USD 432 million from the Australian government's Hydrogen Headstart program to retrofit its Gibson Island ammonia facility for green hydrogen feedstock, with commissioning planned for 2027. The project aims to produce 80,000 metric tons of green ammonia annually, catering to domestic fertilizer markets and export contracts.
- July 2024: Australia’s Grains Research and Development Corporation (GRDC) has initiated a USD 17 million project aimed at maximizing the potential of fertilizers in the grains industry. The project seeks to minimize the risk of nitrogen loss by aligning fertilizer supply more effectively with crop demand. Through this national research initiative focused on enhanced efficiency fertilizers (EEFs), Australian grain growers may gain access to tools that improve nitrogen use efficiency and reduce on-farm greenhouse gas (GHG) emissions.


Australia Fertilizer Market Report Scope
A fertilizer is a chemically manufactured substance applied to soil or plants to supply essential nutrients primarily nitrogen, phosphorus, and potassium to enhance plant growth and increase crop productivity.
The report evaluates the Australia fertilizer market across key categories, including type, form, application mode, and crop type. By type, the market covers complex and straight fertilizers; by form, it includes conventional and specialty products; by application mode, fertigation, foliar, and soil applications are analyzed; and by crop type, the study assesses field crops, horticultural crops, and turf and ornamental segments. Market estimates and forecasts are provided in both value in USD and volume in metric tons.
| Complex | ||
| Straight | Micronutrients | Boron |
| Copper | ||
| Iron | ||
| Manganese | ||
| Molybdenum | ||
| Zinc | ||
| Others | ||
| Nitrogenous | Urea | |
| Others | ||
| Phosphatic | Di-ammonium Phosphate (DAP) | |
| Monoammonium phosphate (MAP) | ||
| Single Super Phosphate (SSP) | ||
| Triple Superphosphate (TSP) | ||
| Potassic | Muriate of Potassium (MoP) | |
| Sulphate of Potash (SoP) | ||
| Others | ||
| Secondary Macronutrients | Calcium | |
| Magnesium | ||
| Sulfur | ||
| Conventional | |
| Specialty | Controlled Release Fertilizers (CRF) |
| Liquid Fertilizer | |
| Slow-release fertilizers (SRF) | |
| Water Soluble |
| Fertigation |
| Foliar |
| Soil |
| Field Crops |
| Horticultural Crops |
| Turf and Ornamental |
| By Type | Complex | ||
| Straight | Micronutrients | Boron | |
| Copper | |||
| Iron | |||
| Manganese | |||
| Molybdenum | |||
| Zinc | |||
| Others | |||
| Nitrogenous | Urea | ||
| Others | |||
| Phosphatic | Di-ammonium Phosphate (DAP) | ||
| Monoammonium phosphate (MAP) | |||
| Single Super Phosphate (SSP) | |||
| Triple Superphosphate (TSP) | |||
| Potassic | Muriate of Potassium (MoP) | ||
| Sulphate of Potash (SoP) | |||
| Others | |||
| Secondary Macronutrients | Calcium | ||
| Magnesium | |||
| Sulfur | |||
| By Form | Conventional | ||
| Specialty | Controlled Release Fertilizers (CRF) | ||
| Liquid Fertilizer | |||
| Slow-release fertilizers (SRF) | |||
| Water Soluble | |||
| By Application Mode | Fertigation | ||
| Foliar | |||
| Soil | |||
| By Crop Type | Field Crops | ||
| Horticultural Crops | |||
| Turf and Ornamental | |||


Market Definition
- MARKET ESTIMATION LEVEL - Market Estimations for various types of fertilizers has been done at the product-level and not at the nutrient-level.
- NUTRIENT TYPES COVERED - Primary Nutrients: N, P and K, Secondary Macronutrients: Ca, Mg and S, Micronutients: Zn, Mn, Cu, Fe, Mo, B, and Others
- AVERAGE NUTRIENT APPLICATION RATE - This refers to the average volume of nutrient consumed per hectare of farmland in each country.
- CROP TYPES COVERED - Field Crops: Cereals, Pulses, Oilseeds, and Fiber Crops Horticulture: Fruits, Vegetables, Plantation Crops and Spices, Turf Grass and Ornamentals
| Keyword | Definition |
|---|---|
| Fertilizer | Chemical substance applied to crops to ensure nutritional requirements, available in various forms such as granules, powders, liquid, water soluble, etc. |
| Specialty Fertilizer | Used for enhanced efficiency and nutrient availability applied through soil, foliar, and fertigation. Includes CRF, SRF, liquid fertilizer, and water soluble fertilizers. |
| Controlled-Release Fertilizers (CRF) | Coated with materials such as polymer, polymer-sulfur, and other materials such as resins to ensure nutrient availability to the crop for its entire life cycle. |
| Slow-Release Fertilizers (SRF) | Coated with materials such as sulfur, neem, etc., to ensure nutrient availability to the crop for a longer period. |
| Foliar Fertilizers | Consist of both liquid and water soluble fertilizers applied through foliar application. |
| Water-Soluble Fertilizers | Available in various forms including liquid, powder, etc., used in foliar and fertigation mode of fertilizer application. |
| Fertigation | Fertilizers applied through different irrigation systems such as drip irrigation, micro irrigation, sprinkler irrigation, etc. |
| Anhydrous Ammonia | Used as fertilizer, directly injected into the soil, available in gaseous liquid form. |
| Single Super Phosphate (SSP) | Phosphorus fertilizer containing only phosphorus which has lesser than or equal to 35%. |
| Triple Super Phosphate (TSP) | Phosphorus fertilizer containing only phosphorus greater than 35%. |
| Enhanced Efficiency Fertilizers | Fertilizers coated or treated with additional layers of various ingredients to make it more efficient compared to other fertilizers. |
| Conventional Fertilizer | Fertilizers applied to crops through traditional methods including broadcasting, row placement, ploughing soil placement, etc. |
| Chelated Micronutrients | Micronutrient fertilizers coated with chelating agents such as EDTA, EDDHA, DTPA, HEDTA, etc. |
| Liquid Fertilizers | Available in liquid form, majorly used for application of fertilizers to crops through foliar and fertigation. |


Research Methodology
Mordor Intelligence follows a four-step methodology in all our reports.
- Step-1: IDENTIFY KEY VARIABLES: In order to build a robust forecasting methodology, the variables and factors identified in Step-1 are tested against available historical market numbers. Through an iterative process, the variables required for market forecast are set and the model is built on the basis of these variables.
- Step-2: Build a Market Model: Market-size estimations for the forecast years are in nominal terms. Inflation is not a part of the pricing, and the average selling price (ASP) is kept constant throughout the forecast period for each country.
- Step-3: Validate and Finalize: In this important step, all market numbers, variables and analyst calls are validated through an extensive network of primary research experts from the market studied. The respondents are selected across levels and functions to generate a holistic picture of the market studied.
- Step-4: Research Outputs: Syndicated Reports, Custom Consulting Assignments, Databases & Subscription Platforms


