Market Overview
| Study Period | 2021 - 2031 |
|---|---|
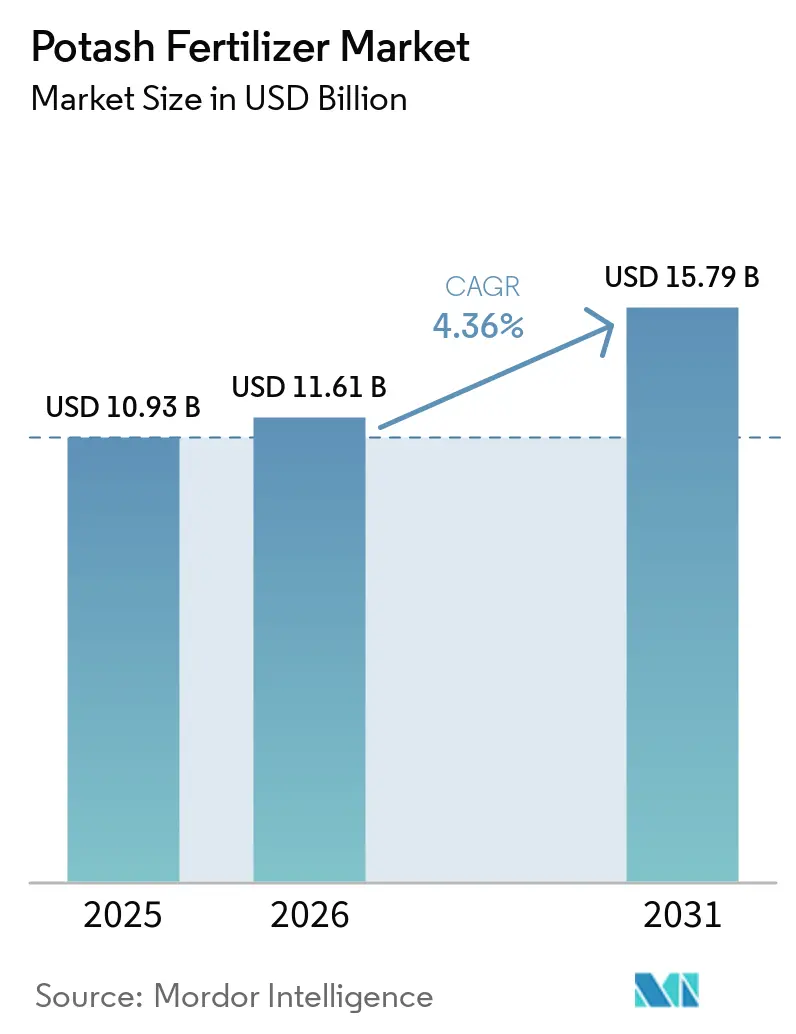
| Market Size (2026) | USD 11.61 Billion |
| Market Size (2031) | USD 15.79 Billion |
| Growth Rate (2026 - 2031) | 4.36% CAGR |
| Fastest Growing Market | Asia-Pacific |
| Largest Market | Asia-Pacific |
| Market Concentration | Medium |
Major Players *Disclaimer: Major Players sorted in no particular order Image © Mordor Intelligence. Reuse requires attribution under CC BY 4.0. | |
Potash Fertilizer Market Analysis by Mordor Intelligence
The potash fertilizer market size is anticipated to expand from USD 10.93 billion in 2025 and USD 11.61 billion in 2026 to USD 15.79 billion by 2031, registering a CAGR of 4.36% between 2026 and 2031. Persistent potassium depletion in agricultural soils, exacerbated by the record 2025 grain and oilseed harvest, has driven increased nutrient removal and heightened replenishment demand for the 2026 application cycle. Global potash shipments rose for the fourth consecutive year to 74.5 million metric tons in 2025, reflecting the market's recovery despite earlier trade disruptions. With a concentrated supply base, factors such as rerouted trade flows, contract timing, and freight costs continue to influence prices in key import markets. In response, major producers are leveraging automation, cost controls, and phased capacity expansions to create a competitive edge over new entrants. This focus on operational efficiency and resilience underscores the market's emphasis on scale and margin discipline, ensuring sustained growth and stability.
Key Report Takeaways
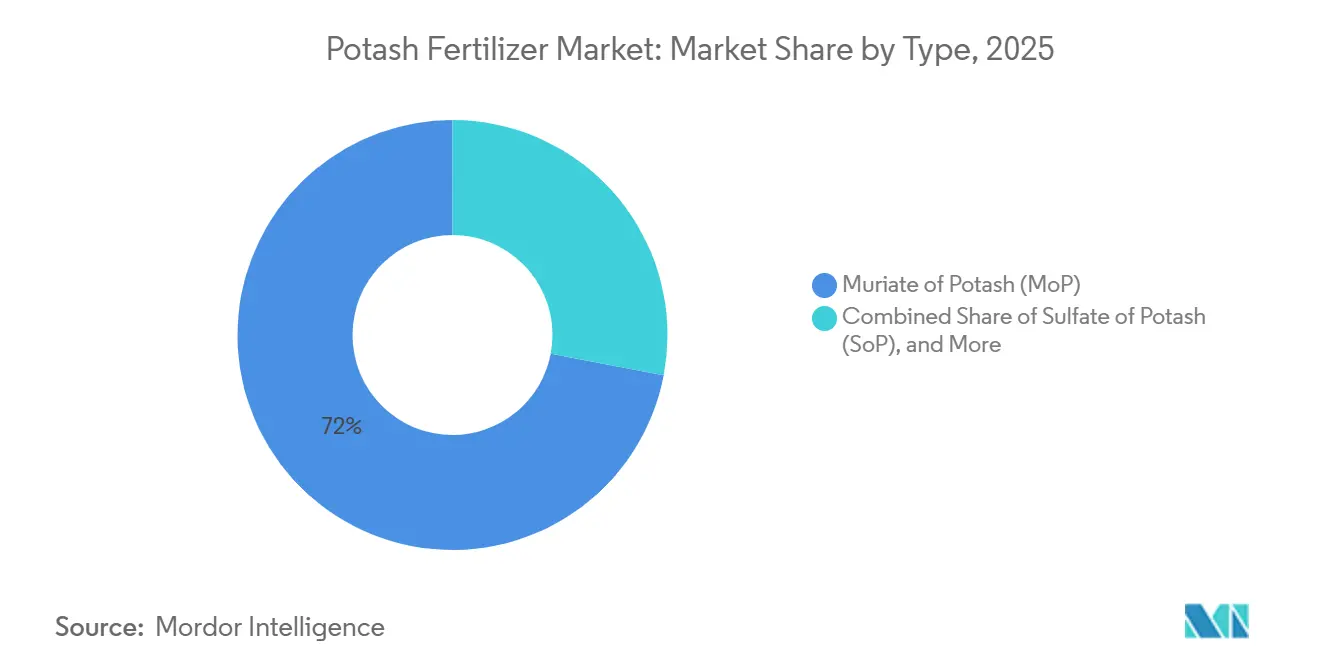
- By type, muriate of potash accounted for the largest share of the potash fertilizer market size, representing 72.0% in 2025, while sulfate of potash is projected to be the fastest-growing segment, registering a CAGR of 5.9% during 2026–2031.
- By application mode, soil application held the largest market share at 61.0% in 2025, while fertigation is projected to be the fastest-growing segment, expanding at a 6.4% CAGR during 2026–2031.
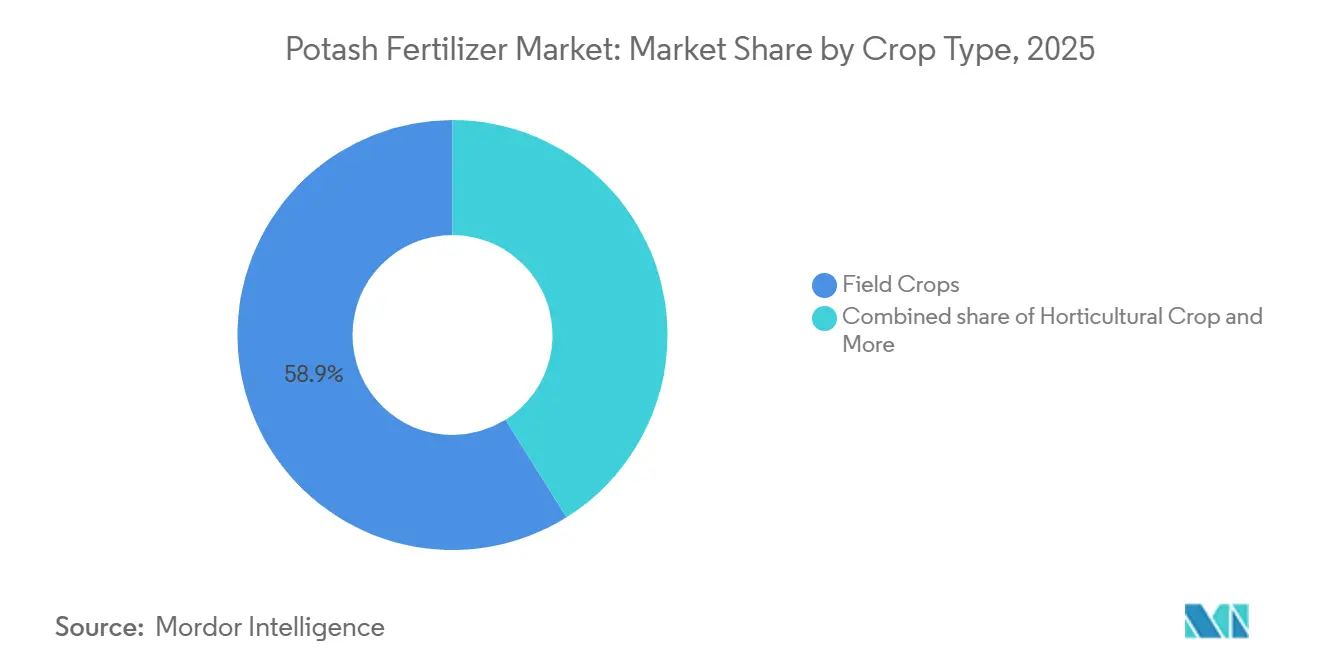
- By crop type, field crops represented the largest segment, accounting for 58.9% of the potash fertilizer market share in 2025, while horticultural crops are forecast to be the fastest-growing segment, with a 6.2% CAGR during 2026–2031.
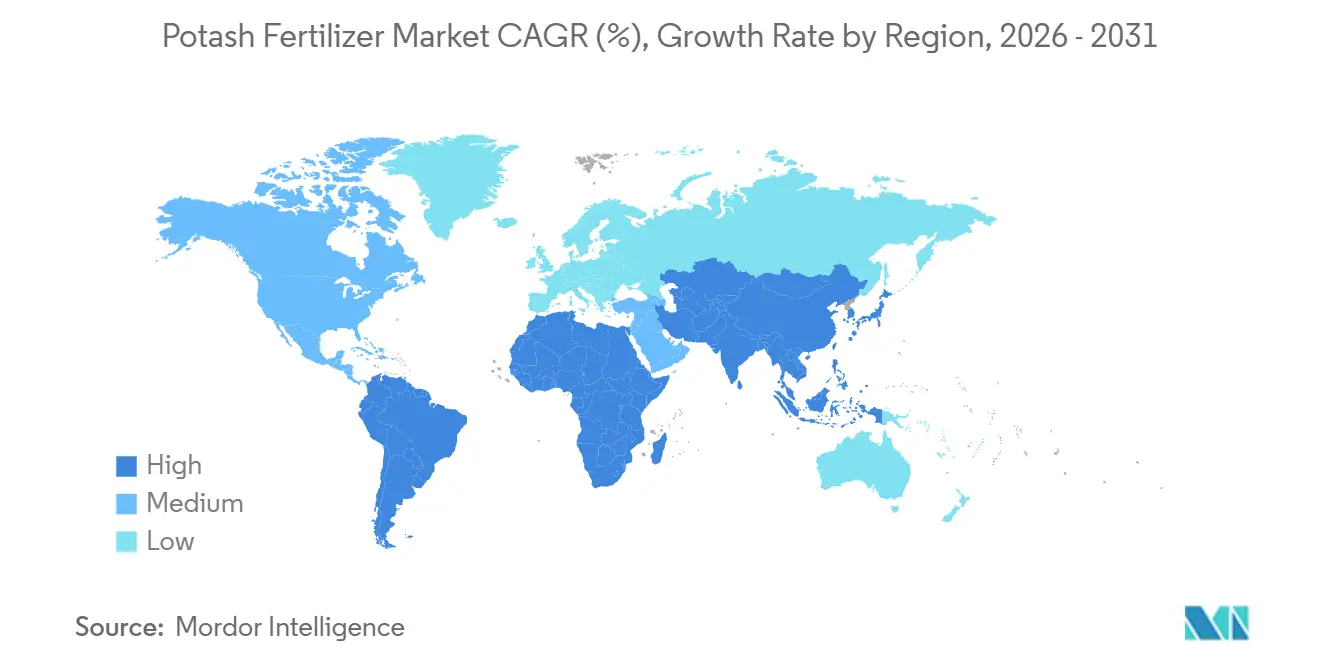
- By geography, Asia-Pacific dominated the market with a 41.9% share in 2025 and is also anticipated to be the fastest-growing regional market, recording a 5.5% CAGR during 2026–2031.
Note: Market size and forecast figures in this report are generated using Mordor Intelligence’s proprietary estimation framework, updated with the latest available data and insights as of 2026.
Global Potash Fertilizer Market Trends and Insights
Drivers Impact Analysis*
| Driver | (~) % Impact on CAGR Forecast | Geographic Relevance | Impact Timeline |
|---|---|---|---|
| Rising Soil Potassium Depletion Under High-Intensity Cropping | +1.8% | Global, with concentration in Asia-Pacific, South America, and Sub-Saharan Africa | Long term (≥ 4 years) |
| Wider Precision Nutrient Management and Variable-Rate Application | +0.7% | North America, Europe, and Australia | Medium term (2-4 years) |
| Expansion of Chloride-Sensitive Horticulture and Specialty Crops | +0.9% | Global, strongest in Asia-Pacific, Mediterranean Europe, and South America | Medium term (2-4 years) |
| Food-Security and Fertilizer-Support Programs Sustaining Balanced Fertilization | +0.7% | Asia, Africa, and the Middle East | Short term (≤ 2 years) |
| Growth in Protected Cultivation and Drip Irrigation Favors Soluble Potash Grades | +0.5% | Middle East, Asia-Pacific, and Mediterranean Europe | Medium term (2-4 years) |
| Emerging Industrial Pull from Hydrogen-Storage Salt Caverns and Brine-Linked Uses | +0.2% | Europe and North America | Long term (≥ 4 years) |
| Source: Mordor Intelligence | |||
Rising Soil Potassium Depletion Under High-Intensity Cropping
The potash fertilizer market is driven by the depletion of potassium in high-intensity farming systems. In 2024, research published in Nature Food highlights that 20% of global agricultural soils are severely potassium-deficient, with the most affected regions being Southeast Asia, Latin America, and Sub-Saharan Africa[1]Source: William Behling, Joseph Coombs, Paul J. Collins, and David Douches, “An Analysis of Inter-Endosperm Balance Number Crosses With the Wild Potato Solanum Verrucosum,” American Journal of Potato Research, ars.usda.gov. Nutrien eKonomics reports annual potassium deficits of 60 kilograms per hectare in the Indo-Gangetic Plain and 50 kilograms per hectare in Argentina’s Western Pampas, underscoring the rapid depletion caused by intensive cropping. Furthermore, in 2024, Nature Food findings show that nearly 80% of rice crops and 70% of maize crops in Indonesian on-farm trials responded positively to potassium fertilizer, even in areas not yet critically deficient. Food and Agriculture Organization of the United Nations (FAO) data also showed only a 7 kilogram per hectare average global cropland surplus, with Africa already in deficit, which keeps the demand floor for the potash fertilizer market structurally firm. These factors collectively emphasize the structural need for potash fertilizers to address soil nutrient depletion and sustain agricultural productivity.
Wider Precision Nutrient Management and Variable-Rate Application
The potash fertilizer market is increasingly driven by advancements in nutrient placement rather than volume expansion. A USDA Agricultural Statistics 2025 trial revealed that variable-rate fertilizer systems reduced total fertilizer use by 13.4% to 28.3% compared to uniform application, while effectively addressing nutrient deficiencies within fields. This approach uncovers hidden depletion that standard programs often miss, enabling informed purchase decisions. Consequently, precision management fosters a more consistent and targeted usage pattern, strengthening demand quality in regions where digital agronomy is widely adopted.
Expansion of Chloride-Sensitive Horticulture and Specialty Crops
The increasing focus on fruits, vegetables, nuts, and other high-value crops is enhancing the value composition within the potash fertilizer market. According to the International Fertilizer Association, global potassium oxide usage is anticipated to grow by 10% between 2024 and 2028, with specialty crop demand playing a significant role in this growth[2]Source: William Behling, Joseph Coombs, Paul J. Collins, and David Douches, “An Analysis of Inter-Endosperm Balance Number Crosses With the Wild Potato Solanum Verrucosum,” American Journal of Potato Research, ars.usda.gov. These crops' sensitivity to salinity and chloride damage is pushing growers toward sulfate-based or soluble potash grades. K+S Aktiengesellschaft reported in 2025 the global average price of premium fertilizer since 2023 is selling at prices 17% higher than standard Muriate of Potash, reflecting the market's preference for crop-specific potassium solutions. This shift enhances the market's premium segment, creating a stronger value layer beyond traditional bulk demand.
Food-Security and Fertilizer-Support Programs Sustaining Balanced Fertilization
Public policies are crucial in sustaining the potash fertilizer market, especially in regions where affordability impacts food security. The International Fertilizer Association reported that Indonesia increased its subsidized fertilizer allocation from 4.7 million metric tons to 9.6 million metric tons in 2024, maintaining availability through 2026 at a 20% discount. The OECD-FAO Agricultural Outlook 2025-2034 highlighted that a 20% reduction in nitrogen, phosphorus, and potassium fertilizer supply in 2025 could raise the FAO food price index by 6% between 2025 and 2028[3]Source: Organisation for Economic Co-operation and Development and Food and Agriculture Organization of the United Nations, “OECD-FAO Agricultural Outlook 2025-2034,” OECD Publishing, oecd.org . This sensitivity reinforces the importance of balanced fertilization, making it politically challenging to reduce in major food-producing nations. As a result, support programs ensure market stability, even amid fluctuating crop prices or import costs, safeguarding both food security and fertilizer affordability.
Restraints Impact Analysis*
| Restraint | (~) % Impact on CAGR Forecast | Geographic Relevance | Impact Timeline |
|---|---|---|---|
| Geopolitical and Sanctions-Driven Disruption in Concentrated Export Supply | -1.5% | Global, with the highest impact in Brazil, India, China, and Southeast Asia | Short term (≤ 2 years) |
| Freight, Port, and Inland-Distribution Volatility Across Import-Dependent Trade Routes | -0.8% | Latin America, South and Southeast Asia, and South Africa | Short term (≤ 2 years) |
| Regenerative Agronomy and Nutrient-Efficiency Programs Reducing Blanket Application Intensity | -0.6% | North America, Europe, and Australia | Long term (≥ 4 years) |
| High Sulfuric-Acid and Energy Costs Limiting Specialty Potash Adoption | -0.5% | Global, especially China, Europe, and India | Medium term (2-4 years) |
| Source: Mordor Intelligence | |||
Geopolitical and Sanctions-Driven Disruption in Concentrated Export Supply
Export concentration poses a critical challenge for the potash fertilizer market, with Canada, Russia, and Belarus collectively holding over 70% of global potash reserves in 2025, as noted by Nature Food. This dependency leaves the market highly vulnerable to trade disruptions. K+S Aktiengesellschaft reported a decline in global potash sales from 77 million metric tons in 2021 to 63.7 million metric tons in 2022, followed by a recovery to 78.1 million metric tons in 2024, driven by rerouted trade. However, the revised trade framework has introduced logistical challenges, increased complexity, and counterparty complexities, making procurement planning more difficult for importers and perpetuating market uncertainty.
Freight, Port, and Inland-Distribution Volatility Across Import-Dependent Trade Routes
Logistics is a critical cost and timing factor for the potash fertilizer market, with three-quarters of global potash demand reliant on imports, according to Nutrien. Freight reliability is essential, as delays in port operations or inland transport can disrupt timely delivery, causing growers to miss key application windows. This challenge is particularly acute in import-dependent agricultural systems, where fertilizers must travel long distances from ports to fields. Such disruptions lead to demand pull-forwards, inventory adjustments, and heightened delivered-price volatility, underscoring the importance of efficient logistics in stabilizing the potash fertilizer market.
*Our forecasts treat driver/restraint impacts as directional, not additive. The impact forecasts reflect baseline growth, mix effects, and variable interactions.
Segment Analysis
By Type: MOP Market Leadership Masks SOP's Faster Growth Trajectory
Muriate of potash (MOP) held the largest share, which accounted for 72.0% the potash fertilizer market share, in 2025, driven by its low nutrient cost, compatibility with mechanical spreading, and ease of use in standard NPK blends. The Mosaic Company's raw extraction cost at the mine is only USD 71 per ton in the third quarter of 2025, reinforcing its cost advantage for field crops. ICL Group Ltd. highlighted the final market price in Brazil reaches USD 355 because of expensive ocean shipping, additional processing into granular form, and global market supply and demand in the same period, reflecting strong import demand despite price sensitivity in the bulk segment.
Sulfate of potash (SOP) is the fastest-growing segment, projected to expand at a 5.9% CAGR during 2026-2031. Its chloride-free composition makes it ideal for high-value crops such as fruits, vegetables, and nuts, underscoring the importance of crop-specific nutrition. However, these premium limits SOP's adoption in broadacre crops, while supporting better margins in irrigated horticulture and permanent crops. The "Others" segment, including potassium nitrate and potassium carbonate, remains niche but offers growth potential in fertigation, foliar feeding, and controlled production systems, complementing the broader market's shift toward specialized applications.


By Application Mode: Soil Application Dominance, Fertigation Momentum
Soil application, with a 61.0% revenue share in 2025, remains the dominant method in the potash fertilizer market due to its simplicity and suitability for broadacre farms. However, fertigation, projected to grow at a 6.4% CAGR during 2026-2031, is driving a shift toward precise nutrient delivery in irrigated systems. The adoption of drip and micro-irrigation enables growers to apply potassium in smaller, frequent doses, improving nutrient timing and plant uptake, which is critical for vegetables, orchards, and greenhouse crops where yield and quality depend on timely nutrient application.
This shift toward fertigation is altering the product mix, favoring soluble sulfate and nitrate grades over bulk chloride-heavy inputs, thereby increasing unit value even with minimal changes in nutrient volume per hectare. While foliar application remains a niche, a corrective method requiring repeated in-season passes, the overall market is evolving. Fertigation adds a premium demand layer to the potash fertilizer market, complementing the large soil-applied base and supporting steady volume growth alongside accelerated value growth in high-management agricultural systems.
By Crop Type: Field Crop Foundation, Horticultural Crops Upswing
Field crops held the largest share of the potash fertilizer market, accounting for 58.9% in 2025, driven by their critical role in global agriculture. Long-term field experiments in China demonstrated that balanced application of nitrogen, phosphorus, and potassium (NPK) significantly improved yields of wheat, maize, and rice compared to nitrogen and phosphorus (NP) treatments. A 31-year trial conducted by the Henan Academy of Agricultural Sciences and published in October 2024 confirmed that continuous NPK-balanced fertilization stabilized grain yields and enhanced protein content in winter wheat and summer maize rotations. These findings underscore the sustained importance of cereals and oilseeds in driving potash demand, as nutrient replenishment remains critical for maintaining agricultural productivity and soil fertility.
Horticultural crops are anticipated to be the fastest-growing segment, registering a projected CAGR of 6.2% during 2026–2031. This growth is attributed to the high potassium requirements of fruits, vegetables, and other high-value crops, where effective nutrient management plays a critical role in improving yield, quality, shelf life, and stress tolerance. The expanding cultivation of horticultural crops, coupled with the increasing adoption of precision fertilization practices, continues to drive demand for potash fertilizers. Although the segment accounts for a smaller share of overall fertilizer consumption, its higher nutrient intensity and strong focus on quality enhancement are anticipated to support above-average growth throughout the forecast period.
Geography Analysis
Asia-Pacific accounted for the largest share of the potash fertilizer market, representing 41.9% in 2025. The region is also projected to be the fastest-growing market, registering a CAGR of 5.5% during 2026–2031. China and India remain the primary demand centers, supported by their large agricultural sectors and the need to enhance crop productivity to meet growing food demand. In Southeast Asia, countries such as Indonesia and Malaysia continue to drive consumption through extensive cultivation of plantation and food crops, particularly oil palm, rice, and horticultural products. Favorable crop economics, increased awareness of nutrient management, and government initiatives aimed at improving agricultural productivity are anticipated to sustain strong demand for potash fertilizers across the region.
North America is projected to experience steady growth during 2026–2031, driven by advancements in precision agronomy, a strong domestic production base, and resilience to supply disruptions. Capacity expansion projects, including the continued development of K+S Aktiengesellschaft's Bethune mine and the commissioning of BHP Group Limited's Jansen Stage 1 project, are anticipated to strengthen regional supply availability and support long-term market growth.
South America, led by Brazil, is projected to maintain healthy growth, driven by increasing fertilizer demand from soybean, corn, and sugarcane cultivation. Africa and the Middle East are projected to grow faster than the global average, supported by rising investments in food security, irrigation infrastructure, and commercial farming initiatives. Europe is anticipated to expand at a comparatively slower pace due to mature agricultural markets, high fertilizer-use efficiency, and stringent nutrient management regulations. Collectively, these regions present significant growth opportunities, supported by agricultural expansion, improving farming practices, and continued investments across the fertilizer value chain.

Competitive Landscape
The potash fertilizer market is moderately consolidated, with the top five producers holding a significant share of the global market in 2025. Nutrien Ltd. led the market, followed by JSC Belaruskali, Uralkali PJSC, The Mosaic Company, and K+S Aktiengesellschaft. The six largest producers maintain market concentration while allowing niche competition. Automation, cost control, and selective expansion have emerged as key competitive strategies, with Nutrien Ltd. leveraging automation to reduce controllable cash costs per metric ton in 2024, showcasing the operational advantages of scale.
Strategic developments in 2025 and 2026 reflect a focus on disciplined expansion to secure market positions. ICL Group Ltd. secured a December 2025 contract to supply 750,000 metric tons of potash to China in 2026 at USD 348 per metric ton, with an option for an additional 330,000 metric tons, reinforcing its presence in a critical import market. Arab Potash Company PLC advanced its USD 1.1 billion Southern Expansion Project, aiming to increase annual capacity to 3.7 million metric tons by 2029. Similarly, EuroChem Group AG progressed with Phase 2 construction at its Usolskiy Potash Complex, targeting a total capacity of 4.7 million metric tons per year by 2027. These moves underline the importance of scale, supply security, and contract access in maintaining competitive advantage.
BHP Group Limited represents a significant new entrant, with Jansen Stage 1, 75% complete as of January 2026, anticipated to begin production in mid-2027 with a planned capacity of 4.2 million metric tons per year. Its increased Stage 1 capital estimate to USD 8.4 billion signals a strong commitment to becoming a major supplier. Meanwhile, smaller regional and specialty suppliers like Intrepid Potash, Inc., Compass Minerals International Inc., Sociedad Química y Minera de Chile S.A., and Haifa Group maintain competitive positions in premium niches where logistics reliability and high-purity grades are critical. These dynamic highlights a market that, while concentrated at the top, remains competitive through specialization, service quality, and regional delivery performance, emphasizing the balance between scale and niche opportunities.
Potash Fertilizer Industry Leaders
Nutrien Ltd.
JSC Belaruskali
Uralkali PJSC
The Mosaic Company
K+S Aktiengesellschaft
- *Disclaimer: Major Players sorted in no particular order

Recent Industry Developments
- January 2026: BHP Group Limited updated Jansen Stage 1 total investment to USD 8.4 billion, including contingencies, up from USD 7.0 billion to USD 7.4 billion in July 2025. The project is 75% complete, with first production confirmed for mid-2027 at 4.2 million metric tons per year. BHP Group Limited also disclosed that it is advancing Stage 2 construction and will provide an updated Stage 2 capital estimate in Q4 fiscal year 2026.
- May 2025: Jordan's Prime Minister inaugurated Arab Potash Company PLC's USD 1.1 billion Southern Expansion Project. The expansion is projected to increase annual production capacity from 740,000 metric tons to 3.7 million metric tons, with preparatory engineering in the second half of 2025 and construction commencing in 2026.
- April 2024: EuroChem Group AG commenced construction of Phase 2 at its Usolskiy Potash Complex, including a new 1.8 million metric ton per year flotation line. Combined with a third shaft under construction, total Usolskiy capacity is targeted at 4.7 million metric tons per year by 2027.


Global Potash Fertilizer Market Report Scope
Potash fertilizer is a potassium-rich material, such as potassium chloride (MoP) or potassium sulfate (SoP), extracted from natural salt deposits. It provides essential potassium (K) to plants, which is vital for water regulation, photosynthesis, disease resistance, and improving crop yield and quality. Potash fertilizers replenish the potassium removed from the soil during harvest. The Potash Fertilizer Market Report is Segmented by Type (Muriate of Potash (MoP), Sulfate of Potash (SoP), and Others), by Application Mode (Fertigation, Foliar, and Soil), by Crop Type (Field Crops, Horticultural Crops, and Turf and Ornamental), and by Geography (North America, Europe, Asia-Pacific, South America, Middle East, and Africa). The Market Forecasts are Provided in Terms of Value (USD) and Volume (Metric Tons).
By Type
| Muriate of Potash (MOP) |
| Sulfate of Potash (SoP) |
| Others |
By Application Mode
| Soil |
| Foliar |
| Fertigation |
By Crop Type
| Field Crop |
| Horticultural Crop |
| Turf and Ornamental |
By Geography
| North America | Canada |
| Mexico | |
| United States | |
| Rest of North America | |
| Europe | France |
| Germany | |
| Italy | |
| Netherlands | |
| Russia | |
| Spain | |
| Ukraine | |
| United Kingdom | |
| Rest of Europe | |
| Asia-Pacific | Australia |
| Bangladesh | |
| China | |
| India | |
| Indonesia | |
| Japan | |
| Pakistan | |
| Philippines | |
| Thailand | |
| Vietnam | |
| Rest of Asia-Pacific | |
| South America | Argentina |
| Brazil | |
| Rest of South America | |
| Middle East | Saudi Arabia |
| Turkey | |
| United Arab Emirates | |
| Rest of Middle East | |
| Africa | Egypt |
| Nigeria | |
| South Africa | |
| Rest of Africa |
| By Type | Muriate of Potash (MOP) | |
| Sulfate of Potash (SoP) | ||
| Others | ||
| By Application Mode | Soil | |
| Foliar | ||
| Fertigation | ||
| By Crop Type | Field Crop | |
| Horticultural Crop | ||
| Turf and Ornamental | ||
| By Geography | North America | Canada |
| Mexico | ||
| United States | ||
| Rest of North America | ||
| Europe | France | |
| Germany | ||
| Italy | ||
| Netherlands | ||
| Russia | ||
| Spain | ||
| Ukraine | ||
| United Kingdom | ||
| Rest of Europe | ||
| Asia-Pacific | Australia | |
| Bangladesh | ||
| China | ||
| India | ||
| Indonesia | ||
| Japan | ||
| Pakistan | ||
| Philippines | ||
| Thailand | ||
| Vietnam | ||
| Rest of Asia-Pacific | ||
| South America | Argentina | |
| Brazil | ||
| Rest of South America | ||
| Middle East | Saudi Arabia | |
| Turkey | ||
| United Arab Emirates | ||
| Rest of Middle East | ||
| Africa | Egypt | |
| Nigeria | ||
| South Africa | ||
| Rest of Africa | ||


Market Definition
- MARKET ESTIMATION LEVEL - Market Estimations for various types of fertilizers has been done at the product-level and not at the nutrient-level.
- NUTRIENT TYPES COVERED - All Potassic Fertilizers
- AVERAGE NUTRIENT APPLICATION RATE - This refers to the average volume of nutrient consumed per hectare of farmland in each country.
- CROP TYPES COVERED - Field Crops: Cereals, Pulses, Oilseeds, and Fiber Crops Horticulture: Fruits, Vegetables, Plantation Crops and Spices, Turf Grass and Ornamentals
| Keyword | Definition |
|---|---|
| Fertilizer | Chemical substance applied to crops to ensure nutritional requirements, available in various forms such as granules, powders, liquid, water soluble, etc. |
| Specialty Fertilizer | Used for enhanced efficiency and nutrient availability applied through soil, foliar, and fertigation. Includes CRF, SRF, liquid fertilizer, and water soluble fertilizers. |
| Controlled-Release Fertilizers (CRF) | Coated with materials such as polymer, polymer-sulfur, and other materials such as resins to ensure nutrient availability to the crop for its entire life cycle. |
| Slow-Release Fertilizers (SRF) | Coated with materials such as sulfur, neem, etc., to ensure nutrient availability to the crop for a longer period. |
| Foliar Fertilizers | Consist of both liquid and water soluble fertilizers applied through foliar application. |
| Water-Soluble Fertilizers | Available in various forms including liquid, powder, etc., used in foliar and fertigation mode of fertilizer application. |
| Fertigation | Fertilizers applied through different irrigation systems such as drip irrigation, micro irrigation, sprinkler irrigation, etc. |
| Anhydrous Ammonia | Used as fertilizer, directly injected into the soil, available in gaseous liquid form. |
| Single Super Phosphate (SSP) | Phosphorus fertilizer containing only phosphorus which has lesser than or equal to 35%. |
| Triple Super Phosphate (TSP) | Phosphorus fertilizer containing only phosphorus greater than 35%. |
| Enhanced Efficiency Fertilizers | Fertilizers coated or treated with additional layers of various ingredients to make it more efficient compared to other fertilizers. |
| Conventional Fertilizer | Fertilizers applied to crops through traditional methods including broadcasting, row placement, ploughing soil placement, etc. |
| Chelated Micronutrients | Micronutrient fertilizers coated with chelating agents such as EDTA, EDDHA, DTPA, HEDTA, etc. |
| Liquid Fertilizers | Available in liquid form, majorly used for application of fertilizers to crops through foliar and fertigation. |


Research Methodology
Mordor Intelligence follows a four-step methodology in all our reports.
- Step-1: IDENTIFY KEY VARIABLES: In order to build a robust forecasting methodology, the variables and factors identified in Step-1 are tested against available historical market numbers. Through an iterative process, the variables required for market forecast are set and the model is built on the basis of these variables.
- Step-2: Build a Market Model: Market-size estimations for the forecast years are in nominal terms. Inflation is not a part of the pricing, and the average selling price (ASP) is kept constant throughout the forecast period for each country.
- Step-3: Validate and Finalize: In this important step, all market numbers, variables and analyst calls are validated through an extensive network of primary research experts from the market studied. The respondents are selected across levels and functions to generate a holistic picture of the market studied.
- Step-4: Research Outputs: Syndicated Reports, Custom Consulting Assignments, Databases & Subscription Platforms


