Ambulatory Surgery Center Market Size and Share
Market Overview
| Study Period | 2020 - 2031 |
|---|---|
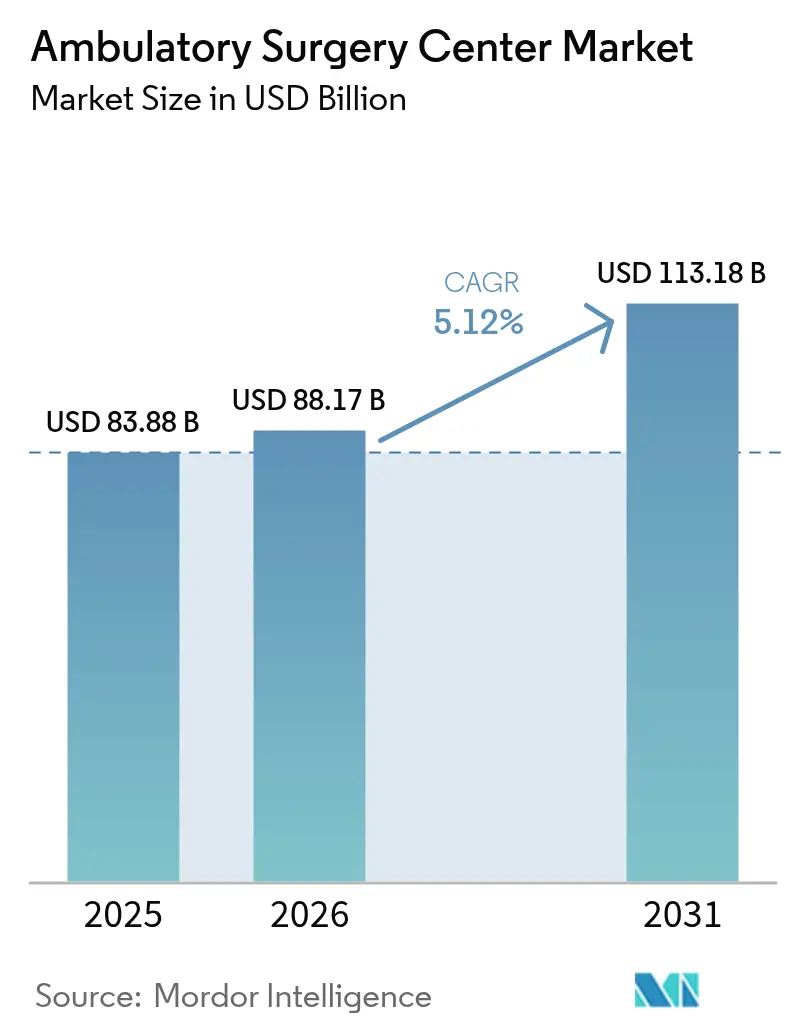
| Market Size (2026) | USD 88.17 Billion |
| Market Size (2031) | USD 113.18 Billion |
| Growth Rate (2026 - 2031) | 5.12% CAGR |
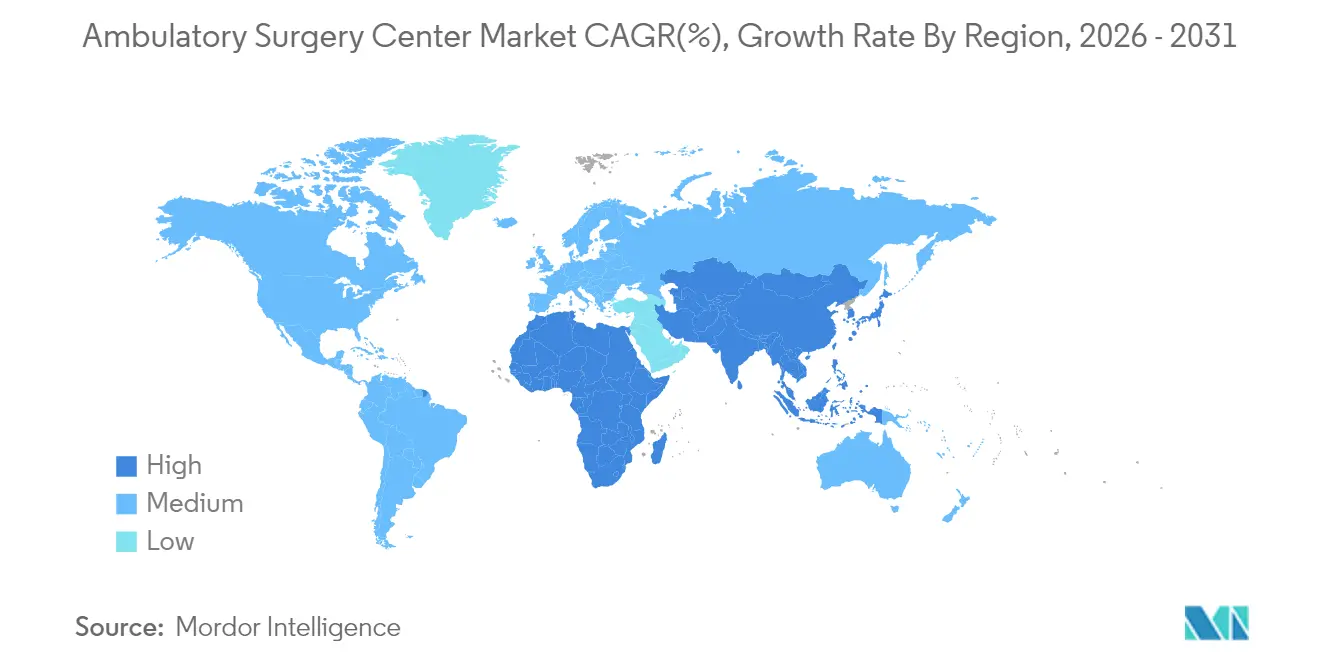
| Fastest Growing Market | Asia-Pacific |
| Largest Market | North America |
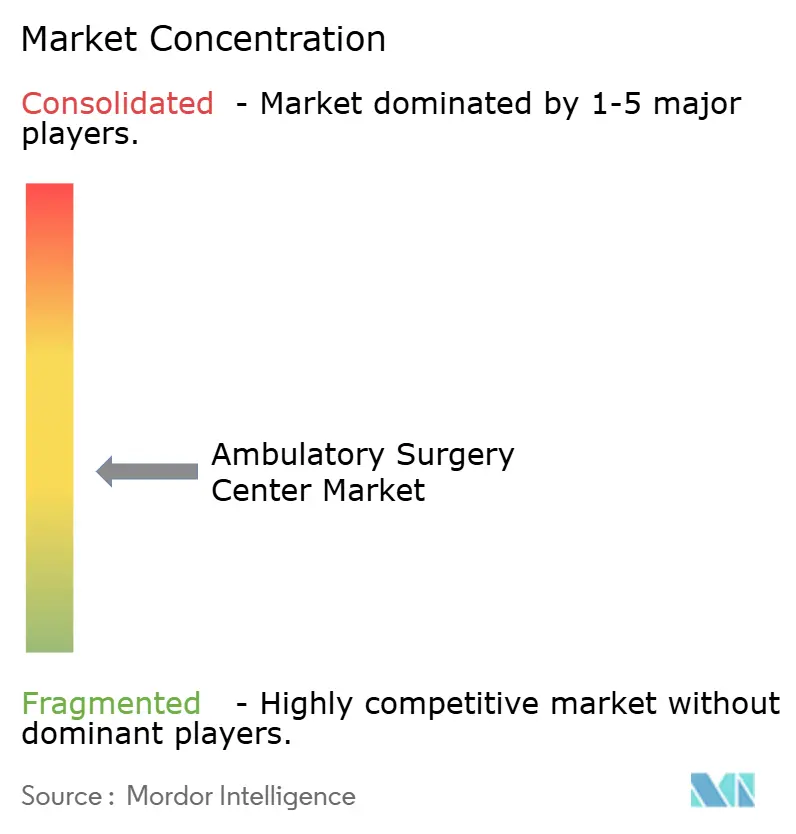
| Market Concentration | Medium |
Major Players*Disclaimer: Major Players sorted in no particular order Image © Mordor Intelligence. Reuse requires attribution under CC BY 4.0. | |
Ambulatory Surgery Center Market Analysis by Mordor Intelligence
Ambulatory Surgery Center market size in 2026 is estimated at USD 88.17 billion, growing from 2025 value of USD 83.88 billion with 2031 projections showing USD 113.18 billion, growing at 5.12% CAGR over 2026-2031.
Rising pay-for-value models, payer pressure to lower procedure prices, and technological gains that enable higher-acuity cases outside hospital walls are accelerating facility build-outs. Orthopedics, ophthalmology, and pain management continue to anchor procedure volumes, yet cardiovascular and spine cases are expanding fastest because new CPT codes now qualify for ambulatory reimbursement. Operators that couple specialty diversification with automation tools are widening margins even as reimbursement headwinds persist. A competitive real-estate scramble, fueled by private-equity roll-ups, signals longer-term consolidation but near-term white-space remains in secondary cities and newly deregulated states.
Key Report Takeaways
- By center type, single-specialty facilities controlled 61.78% of the ambulatory surgical centers market in 2025; multi-specialty centers are projected to expand at an 8.09% CAGR through 2031.
- By modality, freestanding centers accounted for 66.10% of the ambulatory surgical centers market size in 2025, and hospital-based sites are expected to post a 8.76% CAGR over 2026-2031.
- By ownership, physician-owned centers captured a 59.35% share of the ambulatory surgical centers market size in 2025, yet corporate-backed sites are advancing at a 9.74% CAGR.
- By services, surgical services held 76.65% of the ambulatory surgical centers market share in 2025, while cardiovascular procedures are forecast to rise at a 9.18% CAGR to 2031.
- By specialty, orthopedics held 29.78% of the ambulatory surgical centers market share in 2025, while cardiovascular procedures are forecast to rise at a 9.18% CAGR to 2031.
- By geography, North America led with 36.10% of the ambulatory surgical centers market share in 2025, while Asia is projected to log the fastest 9.95% CAGR through 2031.
Note: Market size and forecast figures in this report are generated using Mordor Intelligence’s proprietary estimation framework, updated with the latest available data and insights as of 2026.
Global Ambulatory Surgery Center Market Trends and Insights
Drivers Impact Analysis*
| Driver | (~) % Impact on CAGR Forecast | Geographic Relevance | Impact Timeline |
|---|---|---|---|
| CMS expansion of ASC-covered procedures | +1.6% | United States | Medium term (2-4 years) |
| Certificate-of-Need deregulation | +1.3% | Select U.S. states | Short term (≤ 2 years) |
| High-deductible plan adoption | +1.1% | North America, Europe | Medium term (2-4 years) |
| AI-enabled workflow optimisation | +0.9% | Global | Long term (≥ 4 years) |
| Rising demand for outpatient surgeries | +0.8% | Global | Long term (≥4 years) |
| Patient convenience & expansion in emerging markets | +0.7% | Asia, Latin America | Long term (≥4 years) |
| Source: Mordor Intelligence | |||
Expansion of CMS-Approved ASC Procedure List Accelerating High-Acuity Shift
The CY 2025 Hospital Outpatient Prospective Payment System final rule added 20 complex interventions, including select percutaneous coronary procedures, to the ambulatory list.[1]Centers for Medicare & Medicaid Services, “CY 2025 Hospital Outpatient Prospective Payment System Final Rule,” cms.govCenters that upgrade imaging suites and credential multidisciplinary teams are already capturing new referral streams and securing premium commercial contracts. Cardiovascular throughput is expected to sustain a 9.65% CAGR to 2030, giving early movers a defensible payor-mix advantage. Larger health systems are converting underutilised hospital outpatient departments into dedicated hybrid ASCs to comply with the 24-hour discharge rule while tapping higher case volumes.
Certificate-of-Need Deregulation Enabling Rapid Build-Outs
Legislative rollbacks in Georgia, Florida, and West Virginia are lowering barriers to entry for greenfield developments. Georgia’s HB 1339, in force since July 2024, exempts many new centers from the previous CON process, prompting a pipeline of more than 30 filings in metro Atlanta alone. Operators with sophisticated site-selection analytics are locking in leases near population growth corridors ahead of rivals and leveraging local physician partnerships to accelerate payer credentialing. The pace of filings indicates a likely supply surge that could compress occupancy in the medium term yet should widen patient access in historically underserved suburbs.
High-Deductible Health Plans & Price Transparency Steering Patients Toward Low-Cost ASCs
Across the United States, average ASC commercial pricing sits at 162% of Medicare versus 234% for hospital outpatient departments, yielding material savings for cost-sensitive patients.[2]RAND Corporation, “Nationwide Commercial Price Transparency Study,” rand.org Mandated hospital price-posting and employer-sponsored transparency tools are making relative price differentials visible at the consumer level. Centers that package procedures into all-inclusive bundles and market predictable invoices are winning direct-to-employer contracts, siphoning elective volumes out of traditional hospital channels.
AI-Driven Workflow Solutions Raising Throughput in Ophthalmology & Orthopedics
AI-powered scheduling reduced case cancellations by 27% and improved on-time starts by 34% in a 2024 multi-state network study.[3]Agency for Healthcare Research and Quality, “Artificial Intelligence in Ambulatory Surgery Centers,” ahrq.gov In ophthalmology suites, computer-assisted diagnostic scoring cuts pre-operative assessment times by 41%, allowing cataract centers to add two to three additional cases per room each day. Higher throughput not only boosts margins but also raises surgeon satisfaction, which in turn drives physician referral loyalty.
Restraints Impact Analysis*
| Restraint | (~) % Impact on CAGR Forecast | Geographic Relevance | Impact Timeline |
|---|---|---|---|
| Peri-operative nurse & CRNA shortages | -1.4% | United States, Canada | Short term (≤ 2 years) |
| Reimbursement gap vs HOPD on complex cases | -1.2% | United States | Medium term (2-4 years) |
| High initial setup costs | -1.0% | Global | Long term (≥4 years) |
| Shortage of skilled healthcare professionals | -0.9% | Emerging markets | Long term (≥4 years) |
| Source: Mordor Intelligence | |||
Peri-operative Nurse & Anesthetist Shortages Limiting OR Utilisation Rates
The supply of certified registered nurse anesthetists remains below demand, especially in rural markets where they are often the sole anaesthesia providers. Rising wage inflation and burnout have compounded recruitment challenges, forcing some centers to cap block times even when demand exists. Operators are responding with accelerated residency pipelines and tuition assistance agreements tied to multi-year employment contracts. Centers that offer flexible scheduling and clinical ladders are holding turnover to the low single digits, sustaining utilisation levels.
Reimbursement Gaps vs HOPD Eroding Margins in Cardiac & Spine Cases
Although CMS granted ASCs a 2.9% payment increase for 2025, the site-of-service differential on high-acuity codes persists. Capital-intensive cardiac and spine procedures can still carry thinner margins at ASCs than in hospital outpatient departments, pressuring independent centers to reassess case mixes. Many are entering joint ventures with health systems that contribute equipment capital and extend higher commercial rates, helping sustain financial viability without sacrificing operational agility.
*Our forecasts treat driver/restraint impacts as directional, not additive. The impact forecasts reflect baseline growth, mix effects, and variable interactions.
Segment Analysis
By Center Type: Specialised Focus Remains Dominant While Diversification Gains Speed
Single-specialty centers generated 61.78% of 2025 revenue, underpinned by clinically efficient musculoskeletal, ophthalmic, and pain-management service lines. The operators of single-specialty sites reported average same-room turnover times under 14 minutes, a key factor in physician loyalty. Focused staffing models, equipment reuse, and aligned implant formularies have historically driven EBITDA margins into the mid-30% range.
Multi-specialty centers, while smaller today, are forecast to outgrow single-discipline peers at 8.09% annually through 2031. Diversified case mixes cushion reimbursement volatility and boost scheduling density across the week. Larger systems are layering endoscopy, ENT, and women’s health into existing orthopedic hubs, raising yield on fixed costs. This pivot is expected to push the multi-specialty slice of the ambulatory surgical centers market share several points higher over the next five years.


By Modality: Freestanding Footprint Leads but Hospital-Based Growth Accelerates
Freestanding facilities held 66.10% of 2025 revenue. Their independence from hospital campuses allows flexible site selection near high-income suburbs and employer clusters, a distinct access advantage. Many also operate extended hours, capturing after-work cases that hospitals struggle to schedule.
Hospital-based ASCs represented 33.90% of revenue but are set to grow at a 8.76% CAGR. Health systems are converting underused procedural suites into compliant ambulatory sites to defend referral bases and secure downstream imaging and inpatient volumes. Early evidence suggests that alignment with hospital electronic health records shortens referral cycles, driving incremental growth. This shift should steadily lift the hospital-affiliated slice of the ambulatory surgical centers market size, especially for spine and structural heart programs that demand costly imaging infrastructure.
By Ownership: Physician Control Continues But Corporate Consolidation Intensifies
Physician owners commanded 59.35% of revenue in 2025, a testament to surgeon preference for clinical autonomy. Average distributions per partner remained attractive even after the 2.9% Medicare rate adjustment, keeping many single-site ventures independent. Yet corporate and private-equity platforms, benefiting from 7× EBITDA buyout leverage, are expanding at a 9.74% CAGR. Scale unlocks payer-contract clout, supply-chain rebates, and shared revenue-cycle services. Consequently, the corporate slice of the ambulatory surgical centers market share is likely to climb despite entrenched physician ownership.
Joint-venture structures offer a middle path, mixing surgeon governance with hospital capital. Tenet Healthcare’s USPI portfolio grew to 438 centers by 2021 and targets 575-600 by 2025, with management projecting ASC contributions to about half of adjusted EBITDA. Similar deals are rising in cardiovascular and gastroenterology niches where device costs are high.
By Services: Surgical Core Dominates While Diagnostics Gather Momentum
Surgical procedures produced 76.65% of 2025 revenue, reflecting that orthopedic joint replacement, cataract extraction, and pain injections remain top volume drivers. The ambulatory surgical centers market size for surgery is forecast to rise steadily, buoyed by expanding CPT approvals.
Diagnostic imaging and ancillary testing, comprising 23.35% of revenue, are poised for 9.18% annual growth. Centers adding on-site MRI or CT gain scheduling control and retain downstream income. CMS telehealth parity and caregiver-training codes, effective 2025, further support non-procedural revenue streams, strengthening diversification strategies.

By Specialty: Orthopedics Leads While Cardiovascular Surges
Orthopedics accounted for 29.78% of 2025 revenue and remains the anchor specialty. Predictable implant pricing, bundled payment familiarity, and robotic-assisted knee technology keep volumes high. The ambulatory surgical centers market maintains orthopedics as its most enormous pillar even as musculoskeletal reimbursement tightens.
Cardiovascular procedures, newly liberated by CMS site-of-service updates, will scale at a 9.18% CAGR. Early adopters are investing in hybrid cath labs and ICP-qualified nursing skill sets. Higher case complexity raises average revenue per procedure, positioning cardiology as a key earnings accelerator through 2031.
Geography Analysis
North America captured 36.10% of 2025 revenue, cementing its leadership position. Continued Certificate-of-Need rollbacks and consistent CMS payment updates encourage regional expansion. Robotic-enabled spine programs, underpinned by a USD 1 million donation to Halifax’s QEII Health Sciences Centre in January 2024, showcase the region’s tilt toward technology-rich high-acuity cases. These investments should lift regional case acuity and support modest pricing power despite payer scrutiny.
Europe presents a more heterogeneous adoption pattern. The United Kingdom, Germany, and France lead development, each leveraging public-private partnership frameworks that balance access mandates with private-sector efficiency. Stringent postoperative quality metrics and integrated care pathways support steady conversion of day-case potential into ambulatory volumes.
Asia delivers the fastest expansion, logging a projected 9.95% CAGR through 2031. Rising middle-class demand, private health-insurance growth, and public incentives for infrastructure build-outs spur construction across China and India. Multinational operators are trial-launching joint-venture ASCs within tertiary hospitals to mitigate regulatory risk while capturing self-pay demand. As procedure migration takes hold, the Asian contribution to global ambulatory surgical centers market share is set to rise materially.

Competitive Landscape
The sector remains moderately concentrated. The top five multi-facility groups hold a higher revenue share together, leaving ample room for independents. Tenet’s USPI division aims for up to 600 centers by 2025, leveraging system alliances to secure physician alignment.
Traditionally, hospital-centric device firms are pivoting to support ASC growth. In June 2024, Zimmer Biomet launched tailored joint-replacement education modules with Becker’s ASC, positioning implants alongside workflow consulting. Medtech vendors that offer inventory financing and implant-as-a-service models gain preferred-vendor status among cost-aware administrators.
Technology-enabled disruptors are emerging. Cloud-based revenue-cycle platforms and AI-driven scheduling SaaS vendors are lowering administrative burdens for single-site physicians. Early adopters report denial rates under 2% and staff productivity gains above 20%. These efficiencies help smaller operators remain independent in consolidating the ambulatory surgical center market.
Ambulatory Surgery Center Industry Leaders
AMSURG
Tenet Healthcare
HCA Healthcare
Surgical Care Affiliates
Cerner Corporation
- *Disclaimer: Major Players sorted in no particular order

Recent Industry Developments
- January 2025: CMS announced that 53.4% of Traditional Medicare beneficiaries are now in accountable care relationships, with a goal of 100% by 2030, signaling continued emphasis on value-based care models that favor cost-effective ASC settings.
- December 2024: CMS refined its nomination process for adding new procedures to the ASC list, signaling openness to stakeholder proposals.
- November 2024: Georgia implemented HB 1339, revising the Certificate of Need process and introducing new exemptions for ASCs effective July 1, 2024, creating immediate market entry opportunities in previously restricted areas.
- August 2024: CMS approved separate payments enabling small hospitals to stock essential medicines, indirectly stabilizing ASC supply chains.
- August 2024: CMS announced the implementation of revised Medicare IPPS wage index values for FY 2025, impacting payment rates for hospital-owned ASCs and potentially altering competitive dynamics between hospital-owned and independent facilities.


Research Methodology Framework and Report Scope
Market Definitions and Key Coverage
According to Mordor Intelligence, our study defines the ambulatory surgery center (ASC) market as the total annual revenue generated by stand-alone, non-hospital facilities that deliver same-day surgical, diagnostic, or preventive procedures. Single-specialty and multi-specialty centers operated by physicians, hospitals, or private investors in every region are counted.
Scope Exclusion: hospital outpatient departments, office-based procedure suites, and pure ASC IT service revenues.
Segmentation Overview
- By Center Type
- Single-Specialty Centers
- Gastroenterology Centers
- Ophthalmology Centers
- Orthopedic Centers
- Pain Management Centers
- Cardiology Centers
- Cosmetic Surgery Centers
- Other Single-Specialty
- Multi-Specialty Centers
- Single-Specialty Centers
- By Modality
- Hospital-based ASCs
- Freestanding ASCs
- By Ownership
- Physician-Owned
- Hospital-Owned
- Corporate / Private-Equity-Owned
- Joint-Venture
- By Services
- Surgical Services
- Diagnostic and Imaging Services
- By Specialty
- Gastroenterology
- Ophthalmology
- Orthopedics
- Pain / Neurology
- Cardiovascular
- ENT
- Urology
- Gynecology
- Plastics and Reconstructive
- Geography
- North America
- United States
- Canada
- Mexico
- Europe
- Germany
- United Kingdom
- France
- Italy
- Spain
- Rest of Europe
- Asia-Pacific
- China
- Japan
- India
- South Korea
- Australia
- Rest of Asia-Pacific
- Middle East and Africa
- GCC
- South Africa
- Rest of Middle East and Africa
- South America
- Brazil
- Argentina
- Rest of South America
- North America
Detailed Research Methodology and Data Validation
Primary Research
We interview ASC administrators, reimbursement managers, and device distributors across North America, Europe, Asia-Pacific, and the Gulf. Their insights on case-mix shifts, pricing pressure, and expansion pipelines let us stress-test secondary findings and close data gaps.
Desk Research
Mordor Intelligence analysts first map the global stock of licensed ASCs through open sources such as CMS Provider of Services files, Eurostat, Japan MHLW facility lists, and the Ambulatory Surgery Center Association. Procedure volumes, tariff schedules, and replacement cycles are then drawn from WHO expenditure tables, national fee manuals, peer-reviewed journals, and large 10-Ks. D&B Hoovers and Dow Jones Factiva supply missing financial ranges.
The sources listed are illustrative, not exhaustive.
Market-Sizing & Forecasting
We begin top-down: active center count multiplied by average revenue per center, reconstructed from capacity, payer mix, and typical reimbursement. Results are cross-checked with sampled bottom-up roll-ups of chain disclosures and channel ASP multiplied by volume probes. Key inputs include procedure volumes, reimbursement updates, regulatory additions to the ASC-approved list, inflation, and capital renewal cycles. A multivariate regression on these variables, supported by scenario bands for policy shocks, yields the 2025-2030 curve. Gaps are bridged with medians from comparable centers. This is where Mordor Intelligence differentiates by blending quantified drivers with on-ground sentiment.
Data Validation & Update Cycle
We run variance screens, peer review, and management sign-off. Models refresh every twelve months, reopening sooner when policy or M&A events move baselines, so clients always receive the newest view.
Why Mordor's Ambulatory Surgery Center Baseline Commands Confidence
Published figures diverge because firms choose different facility mixes, revenue lines, and refresh timings.
By anchoring on audited center counts, real-world economics, and a balanced top-down and bottom-up blend, we provide a traceable midpoint for decision making.
Benchmark comparison
| Market Size | Anonymized source | Primary gap driver |
|---|---|---|
| USD 83.88 B (2025) | Mordor Intelligence | - |
| USD 88.93 B (2025) | Global Consultancy A | Adds software and hardware sales to service revenue |
| USD 142.86 B (2024) | Industry Association B | Bundles hospital outpatient departments and applies broad healthcare spend ratios |
The comparison shows how wider or narrower scopes inflate totals, whereas Mordor Intelligence's disciplined variable set and annual refresh keep our baseline reliable, transparent, and easy to audit.


Key Questions Answered in the Report
What is driving the rapid growth of cardiovascular procedures in the ambulatory surgical centers market?
Higher-acuity cardiac interventions were added to the CMS ASC Covered Procedures List for 2025, enabling centers with hybrid cath labs to capture new volumes forecast to rise at a 9.18% CAGR through 2031.
How do freestanding centers compare financially with hospital-based ASCs?
Freestanding facilities controlled 66.10% of 2025 revenue and often benefit from lower overheads, whereas hospital-based sites are expected to log an 8.76% CAGR as systems repurpose unused outpatient space.
Why are multi-specialty ASCs growing faster than single-specialty sites?
Diversified case mixes cushion reimbursement risk and lift scheduling density, supporting a 8.09% CAGR for multi-specialty centers versus slower single-specialty growth.
What staffing challenges most impact ASC growth?
Shortages of peri-operative nurses and CRNAs suppress room utilisation and add wage pressure, with recruitment gaps estimated to trim overall CAGR by 1.4 percentage points in the short term.
Are diagnostic services becoming a meaningful revenue stream for ASCs?
Yes, diagnostic and imaging lines, currently 23.35% of revenue, are projected to grow at 9.18% annually, allowing centers to offer end-to-end care and improve scheduling efficiency.
Page last updated on:


