Alpha Lipoic Acid Market Size and Share
Market Overview
| Study Period | 2021 - 2031 |
|---|---|
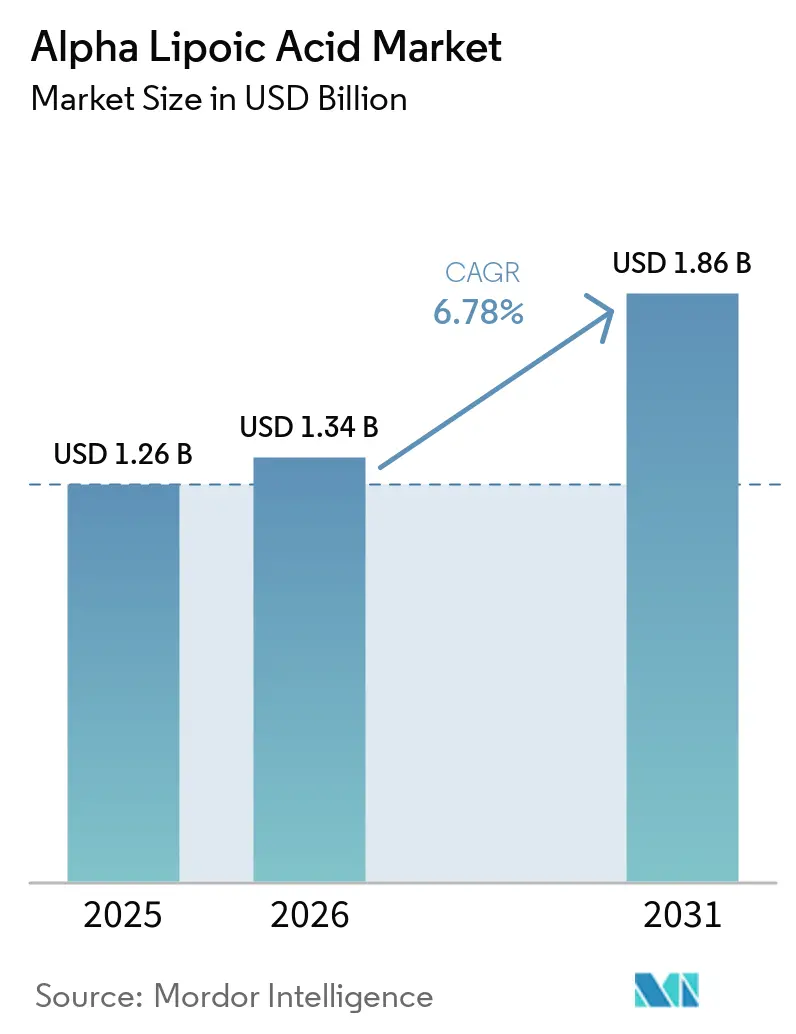
| Market Size (2026) | USD 1.34 Billion |
| Market Size (2031) | USD 1.86 Billion |
| Growth Rate (2026 - 2031) | 6.78% CAGR |
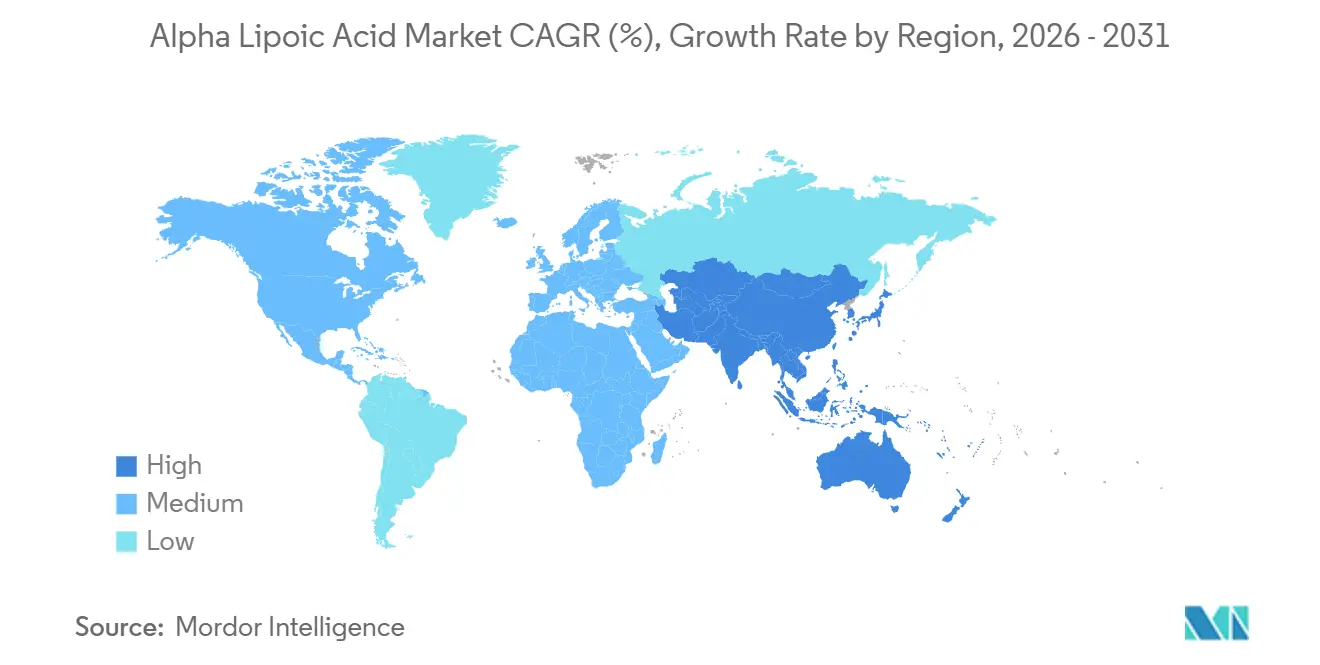
| Fastest Growing Market | Asia-Pacific |
| Largest Market | Asia-Pacific |
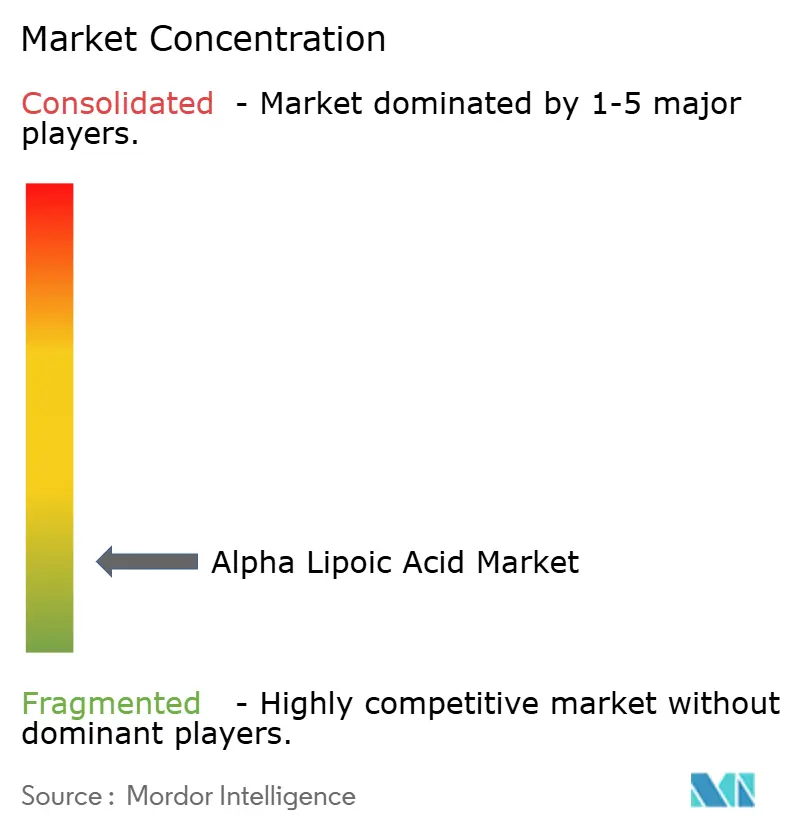
| Market Concentration | Low |
Major Players *Disclaimer: Major Players sorted in no particular order Image © Mordor Intelligence. Reuse requires attribution under CC BY 4.0. | |
Alpha Lipoic Acid Market Analysis by Mordor Intelligence
The Alpha Lipoic Acid Market size is projected to expand from USD 1.26 billion in 2025 and USD 1.34 billion in 2026 to USD 1.86 billion by 2031, registering a CAGR of 6.78% between 2026 to 2031. Pharmaceutical formulations led demand with 41.30% share in 2025, yet dietary supplements and vitamins will post the fastest 7.34% CAGR through 2031 as preventive-health narratives reach mass consumers. R-alpha lipoic acid held 54.10% of 2025 revenue and will outpace racemic grades because new diastereomeric salt resolution methods now deliver >99% enantiomeric excess at economically viable yields. Asia-Pacific contributed 29.95% of the value in 2025 and will expand at 7.65% thanks to China’s low-cost capacity and rising domestic supplement use. Heightened regulatory oversight in the European Union, coupled with biocatalytic production and sustained-release delivery systems, will reshape supply-chain strategies, product positioning, and competitive dynamics over the forecast horizon.
Key Report Takeaways
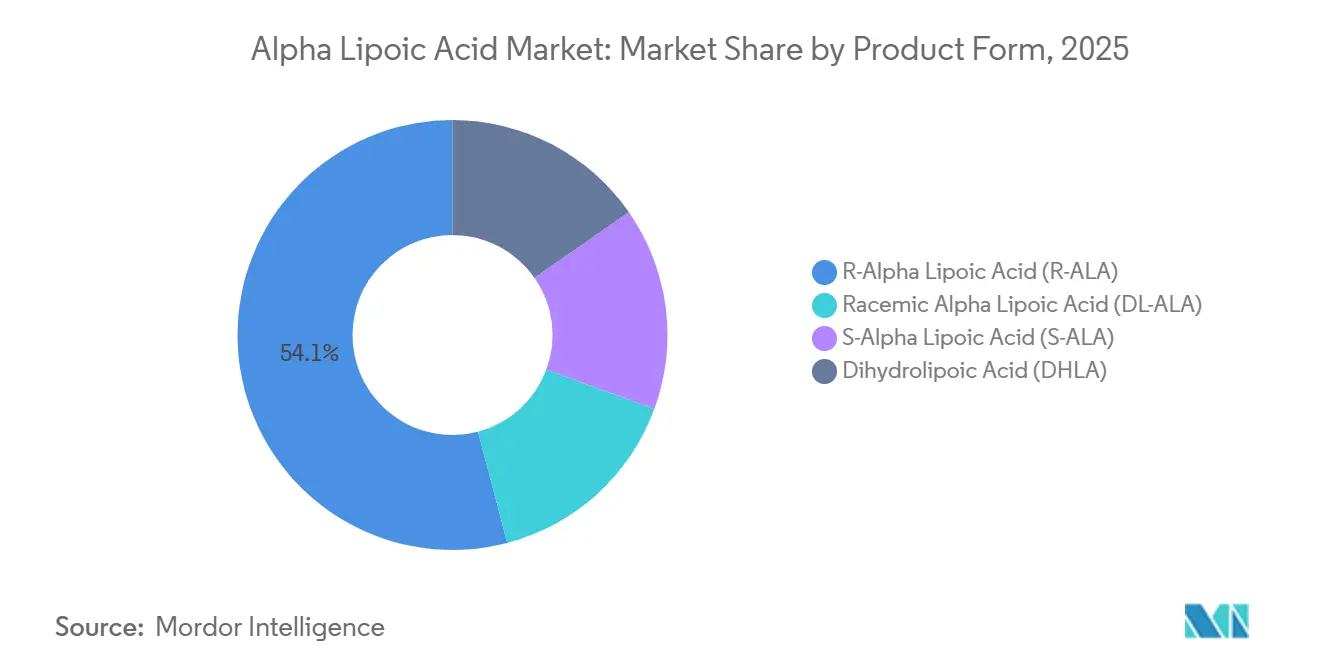
- By product form, R-alpha lipoic acid commanded 54.10% of 2025 revenue while registering the highest projected 7.45% CAGR to 2031.
- By application, dietary supplements and vitamins will rise at 7.34% to 2031, overtaking pharmaceutical formulations that held a 41.30% share in 2025.
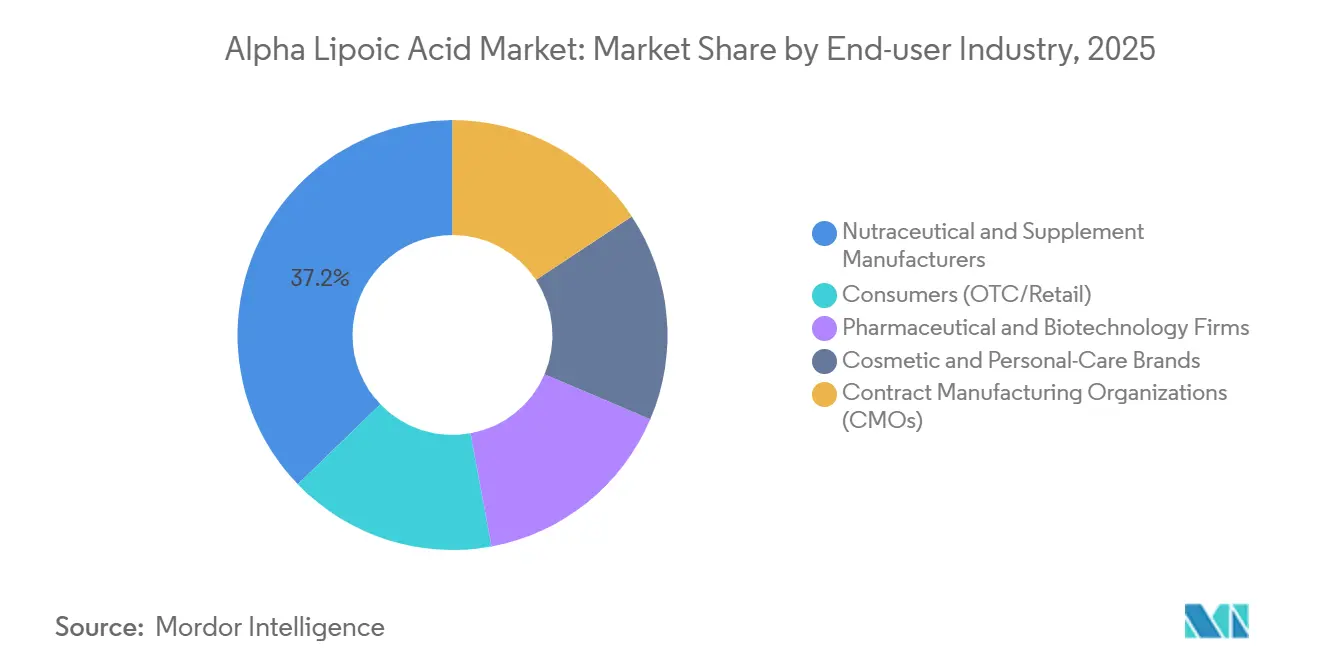
- By end-user, the consumers segment is forecast to post the strongest 7.53% CAGR through 2031, outpacing nutraceutical manufacturers that held 37.20% share in 2025.
- Asia-Pacific accounted for 29.95% market share in 2025 and is anticipated to grow with the fastest CAGR of 7.65% during 2026-2031.
Note: Market size and forecast figures in this report are generated using Mordor Intelligence’s proprietary estimation framework, updated with the latest available data and insights as of January 2026.
Global Alpha Lipoic Acid Market Trends and Insights
Drivers Impact Analysis*
| Drivers | (~) % Impact on CAGR Forecast | Geographic Relevance | Impact Timeline |
|---|---|---|---|
| Rising consumer awareness of antioxidant health benefits | +1.2% | Global, with early adoption in North America and Western Europe | Medium term (2-4 years) |
| Growing demand in dietary supplements and functional foods | +1.5% | Global, strongest in North America, Asia-Pacific urban centers | Short term (≤ 2 years) |
| Increasing pharmaceutical applications in diabetic neuropathy and neuroprotection | +1.3% | North America, Europe, Japan (established clinical guidelines); emerging in India, Brazil | Long term (≥ 4 years) |
| Advances in enantiomeric purification enabling premium R-ALA products | +1.0% | Global manufacturing hubs (China, India, Germany); premium-segment demand in North America, Japan | Medium term (2-4 years) |
| Biocatalytic and flow-chemistry scale-up reducing production costs | +0.8% | Asia-Pacific (China, India), with technology transfer to North America and Europe | Long term (≥ 4 years) |
| Source: Mordor Intelligence | |||
Rising Consumer Awareness of Antioxidant Health Benefits
Clinical evidence that ALA regenerates vitamins C and E has filtered into mainstream wellness communication, prompting aging populations to adopt daily 300-600mg capsules that claim metabolic and cardiovascular support. E-commerce multiplies visibility; Amazon listed 690 ALA items in 2025, and top-selling 600mg products logged over 20,000 annual sales, underscoring buyer acceptance beyond physician-prescribed channels. Brands combine ALA with coenzyme Q10 and mushroom extracts to deliver synergistic ATP gains, enabling premium positioning built on mechanistic data. Marketing momentum, however, is tempered by FDA enforcement letters that target unsubstantiated disease claims, guiding advertisers toward structure-function language that withstands scrutiny. The resulting environment rewards transparent dosing, third-party certifications, and consumer education that links oxidative-stress mitigation to healthy aging outcomes.
Growing Demand in Dietary Supplements and Functional Foods
Between 2026 and 2031, the alpha lipoic acid market will add significant incremental supplement sales as formulators retrofit multivitamins with ALA doses aligned to DSHEA-permitted claims on glucose and energy support[1]U.S. Food and Drug Administration, “Structure/Function Claims,” fda.gov. Encapsulation solutions such as octenylsuccinylated starch and β-cyclodextrin now stabilize ALA in shelf-stable protein shakes, a format previously constrained by 30-50% potency loss at 40°C over four weeks. Japan’s Pharma Foods International offers an encapsulated bulk grade that reduces degradation and has already seeded beverage launches across Asia-Pacific convenience chains. In North America, direct-to-consumer websites pair R-ALA with branded delivery systems that promise higher bioavailability and advertise science-linked benefits without triggering drug-claim thresholds. Accelerated formulation cycles and lower minimum-order quantities at contract manufacturers shorten product-launch lead-times, moving market share toward agile brands that react quickly to consumer feedback loops.
Increasing Pharmaceutical Applications in Diabetic Neuropathy and Neuroprotection
Randomized trials such as SYDNEY and NATHAN demonstrate that 600 mg/day intravenous or oral ALA decreases neuropathic pain scores and improves nerve conduction, findings that earned ALA a place in European Diabetes Federation guides while stimulating global prescription demand. Velpharm’s 2025 approval of an ALA concentrate for diabetic polyneuropathy expands domestic Russian supply amid diabetes incidence growth to 4.3 million infusion packages sold in 2024. Neuroprotection research extends to cognitive decline, with early human studies exploring mitochondrial cofactors but no Phase III confirmation yet, limiting payer reimbursements outside neuropathy indications. Pharmaceutical buyers insist on ≥99.0% purity consistent with European Pharmacopoeia Y0000546, driving demand for high-specification R-ALA from Western or cGMP-audited Asian plants. In markets with limited reimbursement, such as Latin America, off-patent DL-ALA infusion solutions retain share due to affordability relative to premium enantiomeric forms.
Advances in Enantiomeric Purification Enabling Premium R-ALA Products
Patented diastereomeric salt resolution using α-methylbenzylamine raises R-ALA yields to 55-60%, shrinking the historical price gap between R-ALA and racemate. Shandong Qidu Pharmaceutical integrates one-pot racemic synthesis with downstream resolution, lowering unit costs by nearly 30% and fostering wider nutraceutical adoption. Jarrow Formulas commercialized a bilayer tablet that spreads R-ALA release over 10 hours, lengthening the compound’s 30-minute plasma half-life and supporting twice-daily dosing adherence. As investment shifts toward sustained-release, liposomal, and nano-carrier formats, branded products differentiate through pharmacokinetic claims rather than commodity pricing. By 2028, enzyme-catalyzed asymmetric routes are expected to lift microbial titers above 10 g/L, removing the need for chiral resolution and narrowing cost spreads still further.
Restraints Impact Analysis*
| Restraints | (~) % Impact on CAGR Forecast | Geographic Relevance | Impact Timeline |
|---|---|---|---|
| Stringent global regulations on supplement claims and purity | -1.5% | Europe (EFSA surveillance), North America (FDA enforcement), Japan (MHLW) | Short term (≤ 2 years) |
| Volatile raw-material pricing and supply-chain concentration | -0.9% | Global, with acute impact in North America and Europe dependent on Chinese imports | Medium term (2-4 years) |
| Photo/thermo-instability limiting beverage applications | -0.6% | Global functional-food segment, most pronounced in North America and Europe | Medium term (2-4 years) |
| Source: Mordor Intelligence | |||
Stringent Global Regulations on Supplement Claims and Purity
EFSA’s 2021 opinion linked ALA consumption to insulin autoimmune syndrome in genetically predisposed individuals, and the European Commission placed ALA under Part C surveillance in 2025, raising compliance costs for formulators that must add genetic-risk warnings and submit safety dossiers[2]European Commission, “Directive 2002/46/EC Annex III Part C,” europa.eu. FDA warning letters during 2024-2025 curtailed U.S. disease-treatment claims and forced marketers to revise labels or face enforcement. Japan’s MHLW demands clinical substantiation for functional claims, extending time-to-market beyond U.S. norms and moderating product turnover in Asia’s third-largest supplement economy. Pharmaceutical-grade supply must satisfy European Pharmacopoeia Y0000546 and USP 1368201 purity thresholds, adding USD 5-10/kg to production costs through additional chromatographic polishing. Smaller brands without dedicated regulatory budgets therefore stall entry, reducing near-term growth momentum despite strong consumer interest.
Volatile Raw-Material Pricing and Supply-Chain Concentration
Octanoic acid prices swung 15-25% in 2024-2025 due to El Niño-driven palm kernel and coconut oil shortages, inflating ALA conversion costs and squeezing supplement margins. Two Chinese firms supplied nearly half of global capacity in 2025, creating geographic concentration risks highlighted when Red Sea shipping disruptions lifted freight rates 40-60% to North America and Europe. Western brands hedge with dual-sourcing and inventory buffers, yet a 20-30% domestic premium keeps most reliant on Chinese bulk imports. Periodic environmental shutdowns in Shandong and Jiangsu provinces to meet air-quality targets can shave 10-15% of quarterly output, causing spot-price surges of USD 20-40/kg. Capacity additions at Shandong Longzen offer relief, but buyers still monitor geopolitical tensions that could disrupt critical antioxidant supply.
*Our forecasts treat driver/restraint impacts as directional, not additive. The impact forecasts reflect baseline growth, mix effects, and variable interactions.
Segment Analysis
By Product Form: R-Enantiomer Captures Premium Positioning
R-alpha lipoic acid captured 54.10% revenue in 2025 and is expected to grow at 7.45% through 2031, driven by >99% enantiomeric-excess production that narrows historical price gaps. The alpha lipoic acid market size attributable to R-ALA will approach USD 1 billion by the end of the forecast period. Racemic DL-ALA retains cost leadership at USD 30-60/kg and remains favored for infusion solutions in price-sensitive regions.
Jarrow Formulas’ sustained-release R-ALA tablet delivers a 40-60% higher plasma area under the curve than S-ALA, showcasing formulation innovation that commands 15-20% price premiums. Upcoming enzyme-catalyzed syntheses promise ≥24g/L/h space-time yields and could cut R-ALA costs by a further 20% when titers rise above 10g/L, tilting competitive advantage away from racemic material before the decade ends.


By Application: Supplements Extend Lead Over Pharma
Pharmaceutical formulations held 41.30% share in 2025, supported by diabetic neuropathy protocols that specify 600mg/day ALA. The alpha lipoic acid market share for dietary supplements is expected to grow with a 7.34% CAGR through 2031, propelled by direct-to-consumer sales channels and bundling with synergistic antioxidants.
Functional foods and beverages grow from a small base as encapsulation solves instability challenges, yet capsule and tablet forms dominate because of lower cost and simpler compliance. Cosmetic applications, leveraging ALA’s antioxidant profile at 2-5% inclusion, will expand steadily, aided by nanocarrier systems that boost dermal penetration without new regulatory barriers.
By End-User Industry: OTC Retail Reconfigures Supply Chains
Nutraceutical and supplement manufacturers accounted for 37.20% share of the market in 2025. The consumers industry segment is forecast to post the fastest 7.53% CAGR through 2031 as digital platforms bypass wholesale distributors and let brands capture margin while interacting directly with consumers. The alpha lipoic acid market size for OTC retail could surpass USD 700 million by 2031.
Contract manufacturing organizations adapt by offering 500-1,000kg minimum-order quantities and four-week lead-times, enabling rapid SKU launches that respond to social-media trends. Pharmaceutical and biotech firms continue to pay 20-30% premiums for cGMP batches that meet USP and European Pharmacopoeia monographs, a niche sustained by prescription demand for diabetic neuropathy therapy.
Geography Analysis
Asia-Pacific represented 29.95% of 2025 revenue and will grow at 7.65%, anchored by China’s 45% share of global capacity and India’s 25% contribution that together produce more than 1,100 metric tons annually. Order lead-times from major Chinese plants fall below six weeks as continuous-flow retrofits raise throughput and lower unit cost. Domestic supplement uptake climbs in Tier-1 Chinese and Indian cities where preventive-health spending rises with disposable income, reinforcing regional demand beyond export commitments.
North America accounted for a significant market share in 2025. Amazon’s expansive catalog and the FDA’s structure-function latitude encourage frequent reformulations that keep SKUs fresh and widen consumer choice. Canada’s pre-market authorization process, although slower, assures safety and allows higher shelf prices that offset smaller volumes. Mexico’s 8-10% annual nutraceutical growth relies heavily on imported ALA, exposing the supply chain to freight volatility but also driving opportunities for local toll manufacturing.
Europe witness a considerable demand for alpha lipoic acid owing to research and development in nutraceutical and supplement products and dietary supplements. Germany’s ceiling of 600 mg/day aligns with clinical norms, yet France’s preference for medicinal classification constrains over-the-counter sales. Italy’s pharmacy channel uses pharmacist counseling to justify EUR 0.50-0.80 per-capsule price points. South America, led by Brazil’s 60% share of regional value, grows at mid-single digits under ANVISA’s 600 mg intake cap, while the Middle East and Africa add incremental volumes in high-income Gulf states where imported clinical-grade supplements command premium pricing.

Competitive Landscape
The alpha-lipoic acid market is fragmented. Western producers such as AlzChem specialize in pharmaceutical-grade R-ALA that commands 20-30% premiums and meets European Pharmacopoeia traceability, positioning them as preferred suppliers for clinical and research applications. Shandong Longzen’s 400-metric-ton cGMP plant, with an extra 200 tons coming online in 2026, aims to merge Asian cost efficiency with Western quality documentation, tightening competition across both price and compliance axes.
Strategic partnerships illustrate consolidation. NutriOriginal’s 2025 supply agreement with a top-two ALA manufacturer secures traceability and protects against shipping disruptions that inflated 2024 freight rates. Patent filings cluster around sustained-release tablets, liposomal carriers, and enzyme-catalyzed production; Chinese inventors dominate raw-material innovations, while U.S. and European assignees focus on delivery-system protection.
Contract development and manufacturing organizations differentiate through ISO 9001 and ISO 13485 certifications that guarantee batch integrity, winning contracts from sports-nutrition brands that demand contaminant-free labels. As R-ALA costs fall, proprietary delivery technologies rather than raw-material access become the key battleground, signaling a shift toward formulation-led competition inside the alpha lipoic acid market.
Alpha Lipoic Acid Industry Leaders
Shandong Longzen Pharmaceutical Co., Ltd
Shandong Luning Pharmaceutical Co., Ltd.
AlzChem Group AG
Source Naturals
NOW Foods
- *Disclaimer: Major Players sorted in no particular order

Recent Industry Developments
- September 2025: Velpharm Group received Russian approval for an alpha lipoic acid concentrate to treat diabetic polyneuropathy, expanding local supply and reducing import reliance.
- May 2025: The European Commission placed ALA under Part C surveillance in Directive 2002/46/EC, triggering enhanced monitoring and additional data-submission obligations for manufacturers.


Global Alpha Lipoic Acid Market Report Scope
Alpha lipoic acid is a powerful antioxidant that facilitates the conversion of nutrients into energy and mitigates oxidative stress. It is commonly marketed as a dietary supplement and is utilized for applications such as managing nerve pain, supporting weight management, and regulating blood sugar levels.
The alpha lipoic acid market is segmented by product form, application, end-user industry, and geography. By product form, the market is segmented into R-alpha lipoic acid (R-ALA), racemic alpha lipoic acid (DL-ALA), S-alpha lipoic acid (S-ALA), and dihydrolipoic acid (DHLA). By application, the market is segmented into functional foods and beverages, pharmaceutical formulations, cosmetics and personal care, veterinary and animal nutrition, and other industrial uses.By end-user industry, the market is segmented into consumers (OTC/retail), nutraceutical and supplement manufacturers, pharmaceutical and biotechnology firms, cosmetic and personal-care brands, and contract manufacturing organizations (CMOs). The report also covers the market size and forecasts for the alpha lipoic acid market in 16 countries across major regions. For each segment, the market sizing and forecasts have been done based on revenue (USD).
| R-Alpha Lipoic Acid (R-ALA) |
| Racemic Alpha Lipoic Acid (DL-ALA) |
| S-Alpha Lipoic Acid (S-ALA) |
| Dihydrolipoic Acid (DHLA) |
| Functional Foods and Beverages |
| Pharmaceutical Formulations |
| Cosmetics and Personal Care |
| Veterinary and Animal Nutrition |
| Other Industrial Uses |
| Consumers (OTC/Retail) |
| Nutraceutical and Supplement Manufacturers |
| Pharmaceutical and Biotechnology Firms |
| Cosmetic and Personal-Care Brands |
| Contract Manufacturing Organizations (CMOs) |
| Asia-Pacific | China |
| India | |
| Japan | |
| South Korea | |
| Rest of Asia-Pacific | |
| North America | United States |
| Canada | |
| Mexico | |
| Europe | Germany |
| United Kingdom | |
| France | |
| Italy | |
| Rest of Europe | |
| South America | Brazil |
| Argentina | |
| Rest of South America | |
| Middle-East and Africa | United Arab Emirates |
| Saudi Arabia | |
| South Africa | |
| Rest of Middle-East and Africa |
| By Product Form | R-Alpha Lipoic Acid (R-ALA) | |
| Racemic Alpha Lipoic Acid (DL-ALA) | ||
| S-Alpha Lipoic Acid (S-ALA) | ||
| Dihydrolipoic Acid (DHLA) | ||
| By Application | Functional Foods and Beverages | |
| Pharmaceutical Formulations | ||
| Cosmetics and Personal Care | ||
| Veterinary and Animal Nutrition | ||
| Other Industrial Uses | ||
| By End-user Industry | Consumers (OTC/Retail) | |
| Nutraceutical and Supplement Manufacturers | ||
| Pharmaceutical and Biotechnology Firms | ||
| Cosmetic and Personal-Care Brands | ||
| Contract Manufacturing Organizations (CMOs) | ||
| By Geography | Asia-Pacific | China |
| India | ||
| Japan | ||
| South Korea | ||
| Rest of Asia-Pacific | ||
| North America | United States | |
| Canada | ||
| Mexico | ||
| Europe | Germany | |
| United Kingdom | ||
| France | ||
| Italy | ||
| Rest of Europe | ||
| South America | Brazil | |
| Argentina | ||
| Rest of South America | ||
| Middle-East and Africa | United Arab Emirates | |
| Saudi Arabia | ||
| South Africa | ||
| Rest of Middle-East and Africa | ||


Key Questions Answered in the Report
What is the projected value of the alpha lipoic acid market by 2031?
It is forecast to reach USD 1.86 billion by 2031 on a 6.78% CAGR from 2026.
Which product form grows the fastest?
R-alpha lipoic acid advances at a 7.45% CAGR through 2031 as improved purification narrows its cost premium.
Why is dietary supplement demand accelerating?
Direct-to-consumer e-commerce and DSHEA-permitted energy and glucose claims lift supplement uptake at a 7.34% CAGR through 2031.
How does EFSA surveillance affect European sales?
Extra monitoring and label warnings raise compliance costs and slow premium-segment growth.
What drives interest in sustained-release formulations?
They extend ALA’s 30-minute plasma half-life to improve patient adherence and support premium pricing.
Page last updated on:


