
Hydroxypropionic Acid Market Size and Share
Market Overview
| Study Period | 2020 - 2031 |
|---|---|
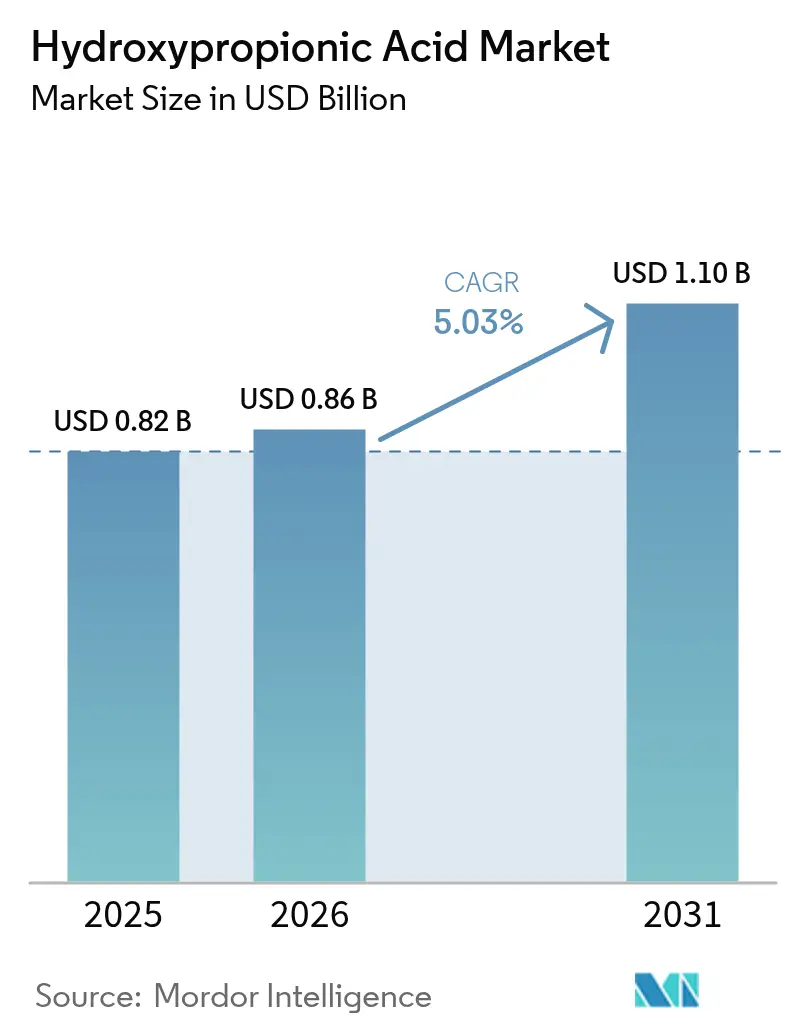
| Market Size (2026) | USD 0.86 Billion |
| Market Size (2031) | USD 1.1 Billion |
| Growth Rate (2026 - 2031) | 5.03 % |
| Fastest Growing Market | Asia Pacific |
| Largest Market | Asia Pacific |
| Market Concentration | High |
Major Players *Disclaimer: Major Players sorted in no particular order Image © Mordor Intelligence. Reuse requires attribution under CC BY 4.0. | |
Hydroxypropionic Acid Market Analysis by Mordor Intelligence
The hydroxypropionic acid market size was valued at USD 0.82 billion in 2025 and estimated to grow from USD 0.86 billion in 2026 to reach USD 1.10 billion by 2031, at a CAGR of 5.03% during the forecast period (2026-2031). Growth rests on the compound’s versatility as a bio-based intermediate for acrylics, biodegradable polymers, and specialty additives that satisfy tightening low-VOC rules. Corporate decarbonization targets, premium pricing for bio-content, and process innovations that narrow cost gaps with petro-routes all reinforce demand momentum. Asia-Pacific leads uptake thanks to abundant glycerol supplies from biodiesel, a dense fermentation asset base, and policy incentives that reward bio-platform chemicals. North America and Europe remain pivotal because regulators there enforce strict fugitive-emission thresholds in architectural and industrial coatings. Technology diversification continues as electro-chemical CO₂ reduction enters pilot scale, complementing dominant microbial fermentation and underscoring industry intent to reach carbon-negative production.
Key Report Takeaways
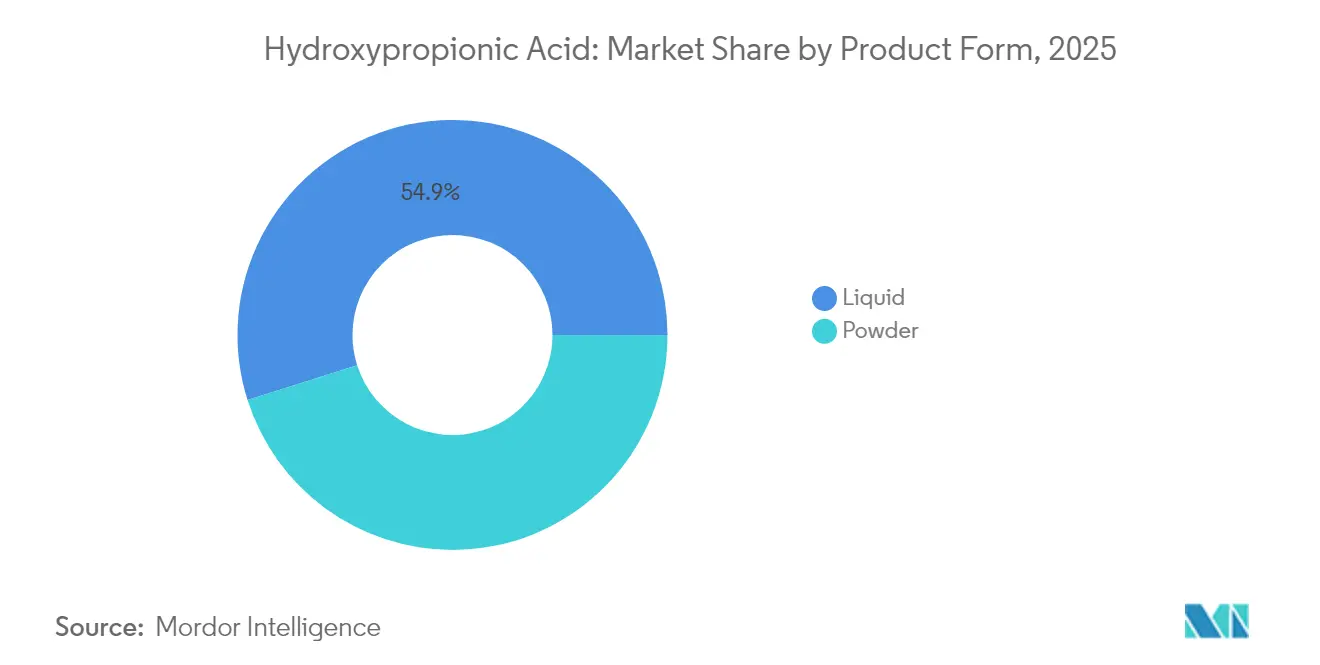
- By product form, liquid grades held 54.88% of the hydroxypropionic acid market share in 2025, while powder grades are projected to expand at a 6.03% CAGR through 2031.
- By production technology, microbial fermentation commanded 48.65% of 2025 revenue; electro-chemical CO₂ reduction records the fastest projected CAGR at 6.82% through 2031.
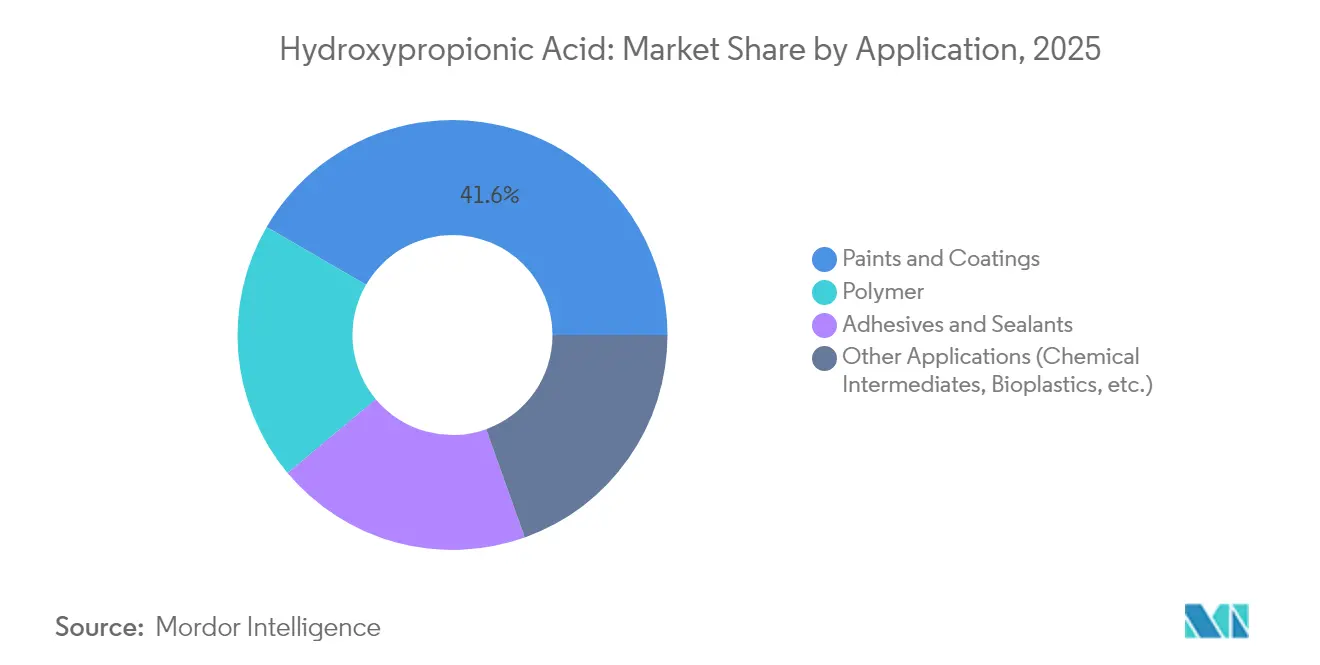
- By application, paints and coatings contributed 41.62% of the hydroxypropionic acid market size in 2025; the “other applications” cluster (chemical intermediates and bioplastics) is forecast to accelerate at a 6.45% CAGR to 2031.
- By geography, Asia-Pacific led with a 47.21% hydroxypropionic acid market share in 2025 and is set to progress at a 5.78% CAGR to 2031.
Note: Market size and forecast figures in this report are generated using Mordor Intelligence’s proprietary estimation framework, updated with the latest available data and insights as of 2026.
Market Trends and Insights
Drivers Impact Analysis of Hydroxypropionic Acid Market*
| Driver | (~) % Impact on CAGR Forecast | Geographic Relevance | Impact Timeline |
|---|---|---|---|
| Industrial shift to bio-acrylic intermediates | +1.2% | Global, led by Asia-Pacific and North America | Medium term (2-4 years) |
| Expanding demand in high-performance paints & coatings | +0.9% | North America & EU, expanding to APAC | Short term (≤ 2 years) |
| Adoption in UV-curable & water-borne polymer systems | +0.7% | Global, concentrated in developed markets | Medium term (2-4 years) |
| Regulatory push for low-VOC, sustainable additives | +0.8% | North America & EU, emerging in APAC | Long term (≥ 4 years) |
| Rising use as pH-neutral lactate substitute in cell-culture media | +0.4% | Global, led by pharmaceutical hubs | Long term (≥ 4 years) |
| Source: Mordor Intelligence | |||
Industrial Shift To Bio-Acrylic Intermediates
Commercial rollout of bio-acrylic acid from 3-hydroxypropionic acid by LG Chem in 2025 has validated scale economics and secured 100% bio-based certification[1]LG Chem, “LG Chem Starts World’s First Commercial Bio-Acrylic Acid Plant,” chemicalprocessing.com. Transition momentum rises as downstream users in cosmetics, hygiene films, and super-absorbents adopt the new feedstock to lock in Scope-3 emission cuts. Process intensification has lifted fermentation titers toward 120 g/L, trimming downstream purification costs and narrowing the parity gap with petro-routes. Carbon border adjustments in the EU and the United States sharpen the incentive to localize bio-routes that carry lower embedded emissions. Producers that master integrated fermentation and dehydration lines are positioned to command premium margins while accessing incentive pools tied to renewable carbon content.
Expanding Demand In High-Performance Paints & Coatings
Formulators of aerospace, automotive, and marine coatings have escalated trials of hydroxypropionic-based epoxy hardeners after studies showed better crosslink density and enhanced salt-spray resistance than conventional amines. Regulatory caps such as the U.S. EPA’s 50 g/L VOC limit for flat architectural paint accelerate reformulation cycles[2]U.S. Environmental Protection Agency, “Architectural Coatings Rules and VOC Limits,” epa.gov. Producers highlight lower curing temperature windows that cut energy use during OEM finishing. Early adopters report material savings because higher functionality enables lower hardener loadings. Market pull will likely intensify once major tier-one coating suppliers certify the additive for water-borne systems aimed at electric-vehicle battery housings, an application that demands both chemical resilience and low outgassing.
Adoption In UV-Curable & Water-Borne Polymer Systems
UV-curable inks for electronics and flexible packaging adopt hydroxypropionic oligomers to raise crosslink density without compromising low-temperature cure profiles, thus protecting heat-sensitive substrates. Water-borne emulsions benefit from the compound’s pH-neutrality, which stabilizes dispersions and simplifies additive packages. Adoption rises in printed-circuit-board conformal coatings where precision patterning is critical. Suppliers cite faster line speeds and lower reject rates once hydroxypropionic grades replace volatile glycol ethers. Growth accelerates further as Asia-Pacific electronics assemblers face stricter indoor air-quality standards that penalize solvent carryover.
Regulatory Push For Low-VOC, Sustainable Additives
California’s South Coast Air Quality Management District enforces some of the strictest architectural coating thresholds worldwide, creating a template other regions follow. The European Commission readies a 2027 revision to the Industrial Emissions Directive that will make bio-based content reporting mandatory for polymer additives. Such rules shift procurement specifications away from petro-routes. Producers with life-cycle-assessment data and recognized certification (e.g., USDA BioPreferred) secure early mover status. Downstream brands monetize sustainability claims through eco-labels, reinforcing diffuse pressure along the value chain.
Restraints Impact Analysis of Hydroxypropionic Acid Market*
| Restraint | (~) % Impact on CAGR Forecast | Geographic Relevance | Impact Timeline |
|---|---|---|---|
| High downstream conversion costs vs. propionic & acrylic acid | -0.8% | Global, most acute in cost-sensitive markets | Short term (≤ 2 years) |
| Volatility in glycerol feedstock pricing | -0.6% | Global, tied to biodiesel production cycles | Medium term (2-4 years) |
| Enzyme deactivation in high-salinity bioreactors limiting scale-up | -0.4% | Manufacturing regions with water quality challenges | Long term (≥ 4 years) |
| Source: Mordor Intelligence | |||
High Downstream Conversion Costs Vs. Propionic & Acrylic Acid
Current fermentation pathways yield production costs near USD 6.1/kg, roughly 25% above legacy petrochemical routes. The penalty reflects multi-step purification, high energy inputs for evaporation, and acid recovery inefficiencies. Process models show profitability demands volumetric productivity above 2 g/L·h and titers beyond 100 g/L. Until those thresholds become common, price-sensitive adhesive and preservative markets remain tethered to propionic and acrylic acid. Larger bio-plants scheduled for 2027 may deliver scale economies that reset the cost curve, yet investors remain wary of margin dilution if carbon credit schemes weaken.
Volatility In Glycerol Feedstock Pricing
Crude glycerol trades between USD 0.07 and USD 0.15 per kilogram, but spikes when biodiesel mandates surge, as witnessed after Europe raised its renewable fuel quota in late 2024. Purity swings from 65% to 85% create batch variability that drives extra neutralization steps, inflating unit costs. Long-term offtake contracts mitigate some risk but embed take-or-pay clauses that pressure balance sheets when biodiesel volumes dip. Developers pursue glucose and methanol routes, yet capex intensity and untested enzymes slow diversification.
*Our forecasts treat driver/restraint impacts as directional, not additive. The impact forecasts reflect baseline growth, mix effects, and variable interactions.
Hydroxypropionic Acid Market Segment Analysis
By Product Form:
Liquid Grades Remain The Workhorse, Powder Variants Climb In Specialist NichesThe hydroxypropionic acid market size for liquid formulations captured 54.88% hydroxypropionic acid market share. Demand is anchored in paints, polymer dispersions, and adhesive blends that value pumpable consistency, low impurity load, and seamless dosing into continuous reactors. Producers capitalize on lower logistics costs by shipping concentrated aqueous blends that avoid crystallization. Capacity additions in China and Malaysia further consolidate supply, reinforcing the segment’s scale advantage.
Powder grades are projected to grow at a 6.03% CAGR through 2031. Uptake accelerates where moisture sensitivity or ultraprecision dosing is crucial, notably in cell-culture media and controlled-release fertilizers. The hydroxypropionic acid market positions powder as an enabler for high-purity applications because spray-drying removes trace salts that compromise downstream reactions. Producers invest in low-energy agitated thin-film dryers to cut operational costs and meet rising GMP standards. Market penetration will deepen once contract manufacturers in India and Singapore validate large-scale lyophilization lines able to deliver kilogram-scale batches with sub-0.1% residual moisture.



By Production Technology:
Fermentation Dominates, Electro-Chemical CO₂ Reduction Shows Breakout PotentialMicrobial fermentation yielded 48.65% by revenue of the hydroxypropionic acid market in 2025. Technology maturity, glycerol feedstock synergy, and compatibility with incumbent ethanol and lactic acid plants confer cost benefits. Advances in CRISPR-enabled strain engineering elevate substrate uptake rates and tolerance to higher acid titers, lowering downstream separation loads.
Electro-chemical CO₂ reduction is the fastest-growing route, advancing at a 6.82% CAGR from a small base of USD 27.3 million in 2025. Breakthrough catalysts using copper-based nanoclusters have raised faradaic efficiency above 25%, a threshold deemed commercially interesting. Pilot units slated for Texas and Denmark integrate with renewable power purchase agreements to create near-zero-carbon intensity product streams. Should electricity prices remain muted during off-peak hours, production economics could undercut fermentation in regions that lack low-cost glycerol. Chemical synthesis via β-propiolactone hydrolysis retains a niche foothold where acetaldehyde is locally abundant, but environmental scrutiny on carcinogenic intermediates restricts expansion.
By Application:
Paints & Coatings Retain Scale, Diversified Intermediates AcceleratePaints and coatings contributed USD 341.3 million, or 41.62% of 2025 global revenue, making the cluster the single largest consumer of the compound. Architectural paints in North America and the EU tap hydroxypropionic acid to comply with 50 g/L VOC ceilings and usher in extended exterior durability. Two-component polyurethane marine coatings highlight higher gloss retention and impact resistance during service testing, extending dry-dock intervals for shipowners. The segment’s mature supply chains and standardized performance metrics keep demand resilient even during cyclical slowdowns in construction.
The “other applications” umbrella—including biodegradable polymers, chemical intermediates, and pharmaceuticals—generated USD 160.2 million in 2025 but will surge at a 6.45% CAGR. Bio-acrylic acid emerges as the headline driver, with LG Chem’s South Korean complex targeting 50 kilotons per year by 2027. Bioplastic compounders in Japan blend hydroxypropionic acid-based copolymers into flexible food packaging films that meet compostability standards without sacrificing barrier performance. Pharmaceutical demand materializes as the molecule’s 3-carbon backbone integrates into antibiotic side chains and specialty excipients.
Geography Analysis
APAC Hydroxypropionic Acid Market
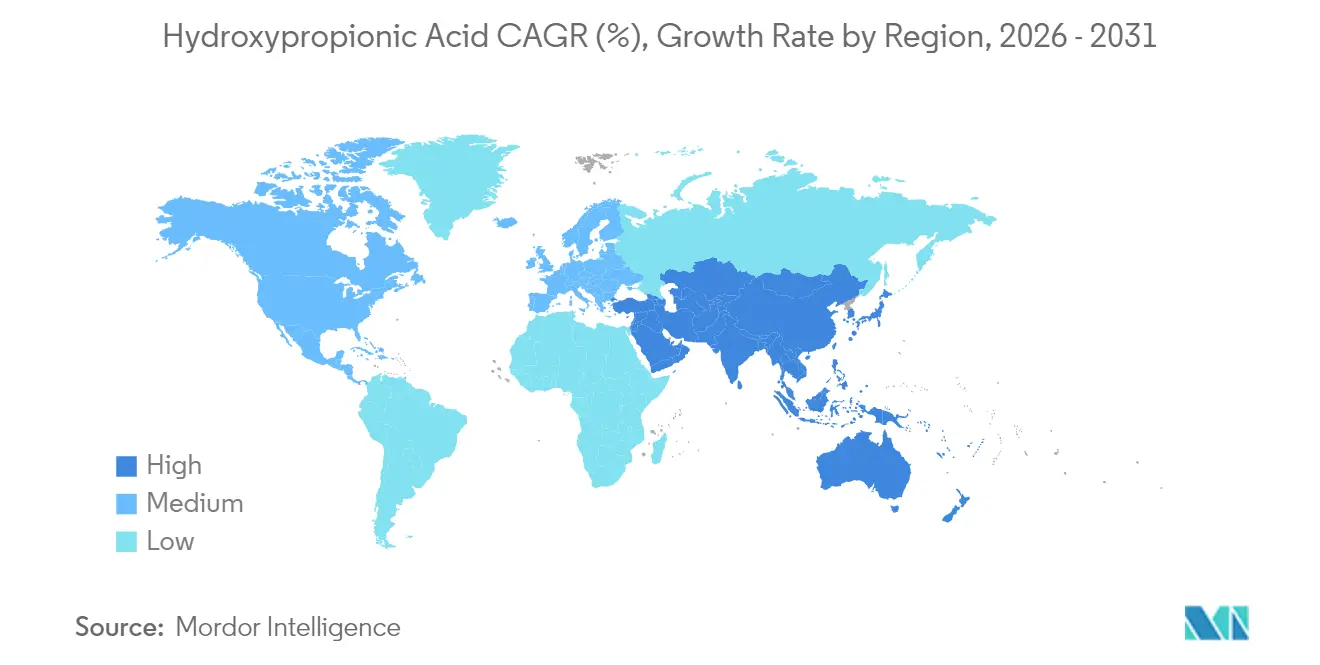
Asia-Pacific is the epicenter of demand, commanding a 47.21% hydroxypropionic acid market share in 2025. Regional revenue stood at USD 387.1 million and is forecast to rise at a 5.78% CAGR to 2031. China anchors consumption as paint formulators and plasticizers pivot to bio-routes aligned with its dual-carbon goals. Provincial grants for bio-based chemical parks in Jiangsu and Zhejiang include interest-free loans for fermentation lines and expedited environmental approvals. Japan contributes high-margin volume through electronics and medical device polymers that prize ultrahigh purity. India’s national bio-economy policy incentivizes domestic fermentation projects, attracting joint ventures between local agro-processors and European specialty firms.
North America Hydroxypropionic Acid Market
In North America, Regulatory certainty under the U.S. Clean Air Act, alongside corporate science-based targets, channels steady procurement into automotive OEM coating lines. Feedstock security weighed in favor of the region when Dow secured cellulosic ethanol-derived ethylene via a 2024 offtake agreement. Canada’s forestry residues enter the supply chain through pilot glycerol-to-hydroxypropionic routes at Quebec’s bio-refineries. The regional growth trajectory aligns with decarbonization mandates in federal procurement that privilege low-emission material inputs.
Europe Hydroxypropionic Acid Market
Stringent REACH regulations in Europe and the forthcoming revision of the IED keep demand oriented toward bio-based compliance solutions. Germany’s Leuna bio-refinery investment by UPM will supply hydroxy-derived intermediates at 220,000 tons per year starting mid-2025. Scandinavia and the Benelux strengthen the regional innovation pipeline through public-private consortia that fund catalyst discovery and enzyme engineering. Despite cost headwinds from elevated energy prices, downstream users pay premiums for assured traceability and eco-label eligibility.
LATAM and MEA Hydroxypropionic Acid Market
Latin America and the Middle East & Africa share a smaller footprint but post rising uptake tied to biodiesel coproduct utilization and food-grade plastic packaging mandates. Brazil leverages abundant sugarcane syrup to trial glucose-fed fermentation lines, while Saudi Arabia’s industrial clusters probe salt-tolerant strains to capitalize on coastal desalination infrastructure.

Regulatory Landscape
Hydroxypropionic acid (3-hydroxypropionic acid, 3-HPA) producers selling into Europe operate under REACH and CLP expectations administered by ECHA, including classification and labeling requirements tied to substance dossiers and downstream communication.
In the United States, chemical suppliers and formulators also face documentation and labeling compliance upgrades under OSHA, with a May 19, 2026 deadline widely cited for updating Safety Data Sheets and labels under the Hazard Communication Standard final rule for newly placed chemicals. Adjacent regulatory pathways are better established for lactic acid (2-hydroxypropionic acid), including US FDA GRAS standing for specified uses and US EPA registration as a plant-growth regulator, highlighting a divergence in regulatory precedents versus industrial-chemical registration pathways that 3-HPA participants navigate for broader commercialization.
Value Chain Analysis
The value chain begins with renewable-carbon feedstocks, most commonly crude glycerol linked to biodiesel output, along with emerging waste-biomass and sugar-based inputs for fermentation. Upstream capability centers on strain development and bioprocessing, with microbial fermentation remaining the dominant route. Downstream purification then becomes cost-critical, including salt management and concentration steps that deliver liquid grades for bulk industrial users and high-purity powder grades for precision formulations.
Midstream and downstream links include storage and logistics for aqueous acids, distribution through chemical suppliers, and integration with end-use formulators in paints and coatings, polymers, adhesives, and chemical intermediates. Cross-chain integration is increasingly visible through government-backed scale-up programs that connect feedstock sourcing, fermentation scale-up, and downstream application development within a single execution framework. For example, NOROO Holdings was selected in 2026 to lead a South Korean national project supported by MOTIE and managed by KEIT to advance scale-up of 3-HP production from waste biomass, reinforcing the role of consortia in de-risking commercialization and shortening qualification cycles with downstream users.
Competitive Landscape
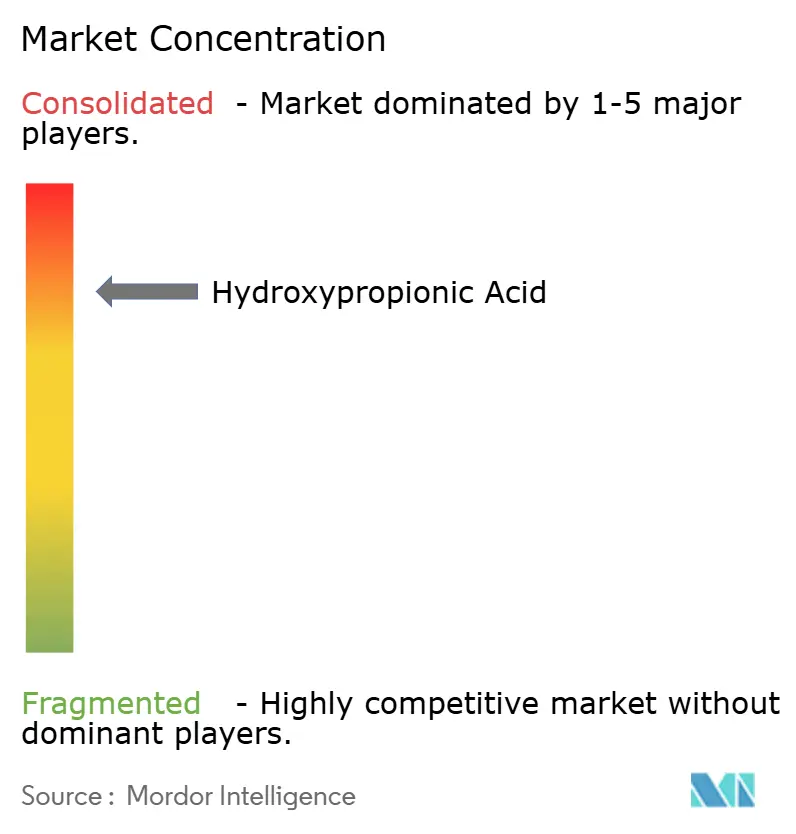
The hydroxypropionic acid market is highly concentrated and dominated by BASF, Corbion, and DSM-Firmenich, leveraging vertically integrated platforms for feedstock aggregation, fermentation, and formulary services. Competitive intensity arises from joint development agreements with coating majors, while smaller manufacturers focus on GMP-compliant pharmaceutical micro-batches. Entry barriers include expertise in fermentation, salt separations, and capital-intensive reactors.
Hydroxypropionic Acid Industry Leaders
BASF
ADM
Cargill
Novozymes
Corbion
- *Disclaimer: Major Players sorted in no particular order
Hydroxypropionic Acid Market Companies Covered in this Report
- ADM
- Alfa Aesar (Thermo Fisher)
- BASF
- Capot Chemical
- Cargill
- Corbion
- DSM-Firmenich
- DuPont de Nemours
- Genomatica
- Ginkgo Bioworks
- Kaneka Corporation
- LG Chem
- Metabolic Explorer
- Novozymes
- Oakwood Products
- Sigma-Aldrich (Merck)
- Spectrum Chemical
- SynQuest Laboratories
- Toronto Research Chemicals
- Zhejiang Jiang Chemical

Market Opportunities and Future Outlook
A near-term whitespace exists where conversion-linked demand creation connects hydroxypropionic acid supply with downstream dehydration and derivative qualification, enabling higher-value offtake in acrylics and bio-derived polymers. The market has a concrete proof point in downstream pull-through from 3-HP into acrylic value chains, including LG Chem commercializing bio-acrylic acid from 3-hydroxypropionic acid in 2025 with USDA bio-based certification, which helps coatings, hygiene films, and related users translate procurement into measurable bio-content claims.
Technology and feedstock diversification also create room for producers to reduce cost and carbon-intensity barriers that limit adoption in price-sensitive segments. In 2026, a South Korean government-backed program selected NOROO Holdings as lead executing organization (with KEIT oversight) to advance large-scale production of 3-HP from waste biomass, signaling public support for scale-up, circular feedstocks, and downstream product development in bio-derived polymers. Separately, published 2026 academic work demonstrating high-yield 3-HP production using Issatchenkia orientalis, backed by techno-economic validation, adds non-commercial evidence that process optimization and alternative organism platforms are moving toward commercially relevant performance thresholds.
Recent Industry Developments in Hydroxypropionic Acid Market
- June 2026: NOROO Holdings was selected as the lead executing organization for a South Korean national program backed by MOTIE and KEIT to advance large-scale 3-hydroxypropionic acid production from waste biomass. The program links feedstock, fermentation scale-up, and downstream high-value bio-derived polymer development, tightening integration across the 3-HP value chain.
- February 2025: LG Chem accelerated commercial production of 100% plant-based acrylic acid derived from 3-hydroxypropionic acid produced via microbial fermentation and highlighted USDA Certified Biobased Product labeling. The move validated a high-volume derivative pathway for 3-HP and strengthened the business case for integrated dehydration-to-acrylic lines. It also increased downstream familiarity with 3-HP-based intermediates in coatings and polymer applications where bio-content certification is embedded in procurement specifications.
- December 2024: Europe raised its renewable fuel quota, a policy shift that contributed to higher biodiesel output in the region and increased sensitivity of crude glycerol pricing, an important fermentation feedstock for 3-HP routes. The change showed how fuel-policy cycles can transmit volatility into bio-based chemical input costs. For hydroxypropionic acid producers, it reinforced the strategic value of feedstock optionality (waste biomass or sugar-based routes) and contracting structures that stabilize input economics.


Hydroxypropionic Acid Market Report Scope and Research Methodology
Market Definition and Coverage
For this study, the market covers the value of hydroxypropionic acid sold for industrial use, across the main supply routes and forms, and counted where it is consumed by downstream manufacturers.
Scope exclusions: We exclude downstream derivatives and end products made from hydroxypropionic acid, such as acrylic acid, 1,3-propanediol, and finished bioplastics.
Segments Covered in This Report
- By Product Form
- Powder
- Liquid
- By Production Technology
- Chemical Synthesis (β-propiolactone hydrolysis, etc.)
- Microbial Fermentation – Glycerol Route
- Microbial Fermentation – Glucose Route
- Electro-chemical CO₂ Reduction
- Other Emerging Routes
- By Application
- Paints and Coatings
- Polymer
- Adhesives and Sealants
- Other Applications (Chemical Intermediates, Bioplastics, etc.)
- By Geography
- Asia-Pacific
- China
- Japan
- India
- South Korea
- Rest of Asia-Pacific
- North America
- United States
- Canada
- Mexico
- Europe
- Germany
- United Kingdom
- France
- Italy
- Rest of Europe
- South America
- Brazil
- Argentina
- Rest of South America
- Middle East and Africa
- Saudi Arabia
- South Africa
- Rest of Middle East and Africa
- Asia-Pacific
Data Sources, Market Sizing, and Validation
Desk Research
We begin with desk work to lock the market boundary, map the value chain, and form an initial view of demand by region and end use. Public sources such as the US EPA, Eurostat, UN Comtrade, the USITC DataWeb, and the World Bank are used to understand trade direction, chemical industry activity, and macro indicators that influence consumption.
Company annual reports, investor presentations, product technical sheets, association websites, and reputable industry press are then reviewed to identify production routes, typical product forms, and price direction. Where needed, we also use paid subscriptions for company financials and intelligence, patent databases, and shipment-level trade data to fill gaps and cross-check assumptions. The sources named here are illustrative, and many other references were used for data collection, validation, and clarification.
Primary Interviews and Surveys
Primary work is used to validate what desk sources cannot reliably show, especially the split between merchant sales and captive use, and the practical adoption pace across applications. We speak with producers, distributors, formulators, and procurement and plant teams, and then we test assumptions on pricing, substitution, and supply tightness across APAC, EMEA, and the Americas.
Distribution of primary research fieldwork respondents
| Company type | Respondent position | Region |
|---|---|---|
| Top tier: 27% | CXOs: 12% | APAC: 45% |
| Mid tier: 59% | Functional/Unit leaders: 34% | EMEA: 29% |
| Smaller Players: 14% | Managers: 54% | Americas: 26% |
Market-Sizing & Forecasting
The core sizing is built using a top-down approach where chemical output signals and trade patterns are reconstructed into an addressable demand pool for hydroxypropionic acid by region. We then corroborate the totals with selective bottom-up checks, such as sampled supplier capacity-to-sales logic, channel conversations on import dependence, and volume-by-application sanity checks using typical usage intensity.
Inputs used in the model include capacity additions and utilization direction, the share of captive consumption versus merchant availability, typical pricing by form (liquid versus powder) and purity needs, and demand indicators from key consuming industries like coatings, polymers, and chemical intermediates. Where gaps exist in country-level visibility, the model uses proxy indicators such as regional chemical production indices and trade unit values, and then tightens assumptions through expert feedback.
For forecasting, we apply scenario analysis so that changes in fermentation route economics, regulatory pull for lower-carbon intermediates, and downstream production plans can be reflected without overfitting. The final outlook is anchored to the consensus range gathered from interviews and then stress-tested for near-term supply constraints and pricing normalization.
Data Validation & Update Cycle
Outputs are checked against independent signals, including trade direction, known capacity moves, and application-level demand narratives gathered during interviews. If a region shows an unusual jump versus its chemical output or import pattern, it is flagged, reviewed by another analyst, and corrected only after the assumption trail is documented.
We run variance checks across price, volume, and implied consumption per end use to ensure the totals make practical sense, and then a multi-step internal review is completed before sign-off. Reports refresh annually, and interim updates are triggered when material events occur, such as plant start-ups, closures, or sharp feedstock shifts. Before delivery, an analyst performs a fresh pass so clients receive the latest updated view.
Mordor Intelligence's Hydroxypropionic Acid Market Size Compared Against Other Published Estimates
Published market values for hydroxypropionic acid can vary because the scope line is not drawn the same way, and the model inputs are not always consistent. Differences usually come from what gets counted as hydroxypropionic acid, how captive use is treated, and how pricing is converted and refreshed.
Trade unit values, regional capacity signals, and interview feedback on captive consumption are the checks that keep Mordor Intelligence tied to hydroxypropionic acid demand as an intermediate, with downstream derivatives like acrylic acid and 1,3-propanediol excluded.
Benchmark comparison
| Source | Market Size | Gaps in Research Methodology |
|---|---|---|
| Mordor Intelligence | USD 0.86 B (2026) | |
| Industry Publisher A | USD 0.19 B (2025) | This figure appears to lean toward a narrower view that tracks merchant sales only, which can undercount volumes that are produced and consumed inside integrated chemical operations. |
| Industry Publisher B | USD 1.48 B (2025) | This figure likely uses broader inclusion rules that can blend adjacent bio-based chemical intermediates and faster adoption assumptions, which raises the base year total without clear separation from derivative value pools. |
The spread in the table mainly comes from scope differences and how captive volumes are handled, followed by how pricing and adoption ramps are applied across regions. Our checks are kept simple and repeatable, so the totals can be traced back to observable signals and then confirmed through expert re-validation.


Key Questions Answered in the Report
What is the current Hydroxypropionic Acid Market size?
The market stands at USD 0.86 billion in 2026 and is projected to reach USD 1.10 billion by 2031.
Which region leads global demand?
Asia-Pacific holds 47.21% of 2025 revenue due to strong biotechnology investments and abundant glycerol feedstock.
Why are paints and coatings the largest application?
Stricter VOC limits and the compound’s superior crosslinking performance have pushed paints and coatings to 41.62% of 2025 volume.
What technology dominates production?
Microbial fermentation accounts for 48.65% of the 2025 supply base, although electro-chemical CO₂ reduction shows the fastest growth.
Page last updated on:


 Your data is secure and never sold or shared.


