
Formic Acid Market Size and Share
Market Overview
| Study Period | 2020 - 2031 |
|---|---|
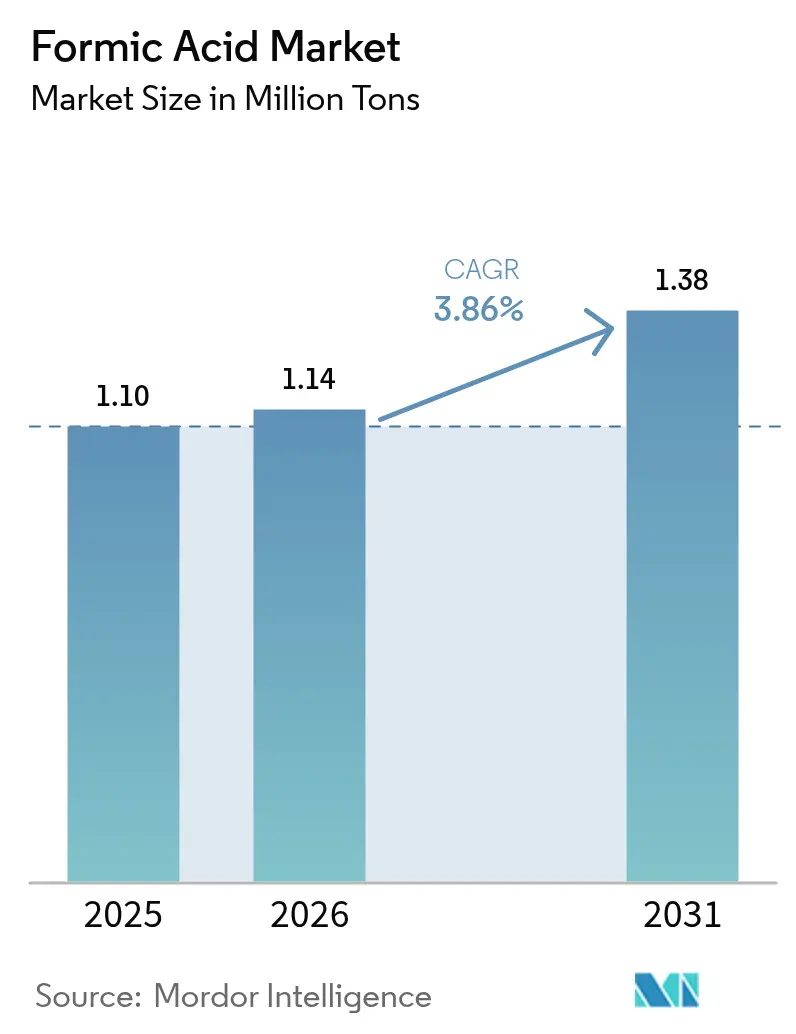
| Market Volume (2026) | 1.14 Million tons |
| Market Volume (2031) | 1.38 Million tons |
| Growth Rate (2026 - 2031) | 3.86 % |
| Fastest Growing Market | Asia-Pacific |
| Largest Market | Asia-Pacific |
| Market Concentration | High |
Major Players *Disclaimer: Major Players sorted in no particular order Image © Mordor Intelligence. Reuse requires attribution under CC BY 4.0. | |
Formic Acid Market Analysis by Mordor Intelligence
The Formic Acid market size is expected to grow from 1.10 Million tons in 2025 to 1.14 Million tons in 2026 and is forecast to reach 1.38 Million tons by 2031 at 3.86% CAGR over 2026-2031. Rising demand for antibiotic-free animal feed, accelerating investment in bio-based production, and steady uptake across leather, rubber, and pharmaceutical applications underpin this growth path. Animal feed preservation already captures 37.04% of global consumption, and bio-based routes are expanding at 4.72% CAGR as producers seek lower-carbon footprints. Regional momentum is led by Asia-Pacific, where abundant manufacturing capacity and supportive policies are expected to secure a 4.61% regional CAGR through 2030. Process innovation—most notably electrochemical CO₂-to-formic acid conversion—could further reshape supply economics as pilot projects move toward commercial scale
Key Report Takeaways
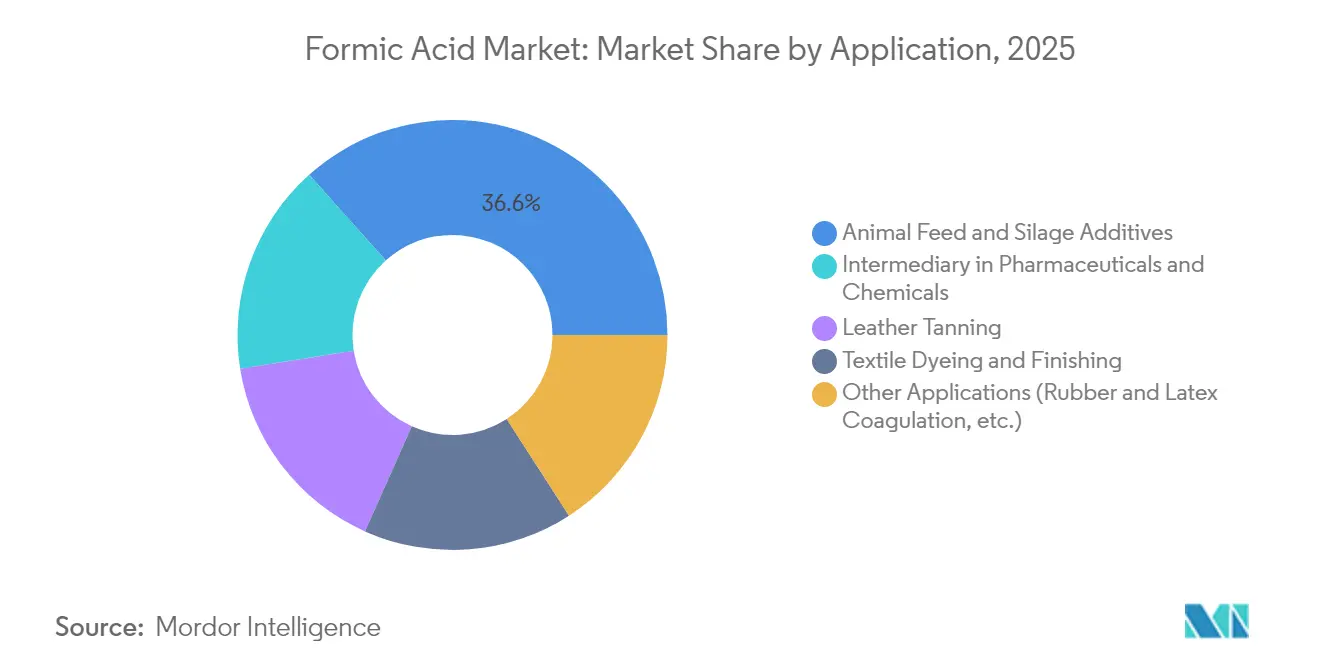
- By application, animal feed & silage additives led with 36.62% of formic acid market share in 2025; the segment is projected to grow at 4.12% CAGR through 2031.
- By production route, methyl formate hydrolysis held 58.74% of the formic acid market size in 2025, while bio-based pathways are set to expand at a 4.6% CAGR.
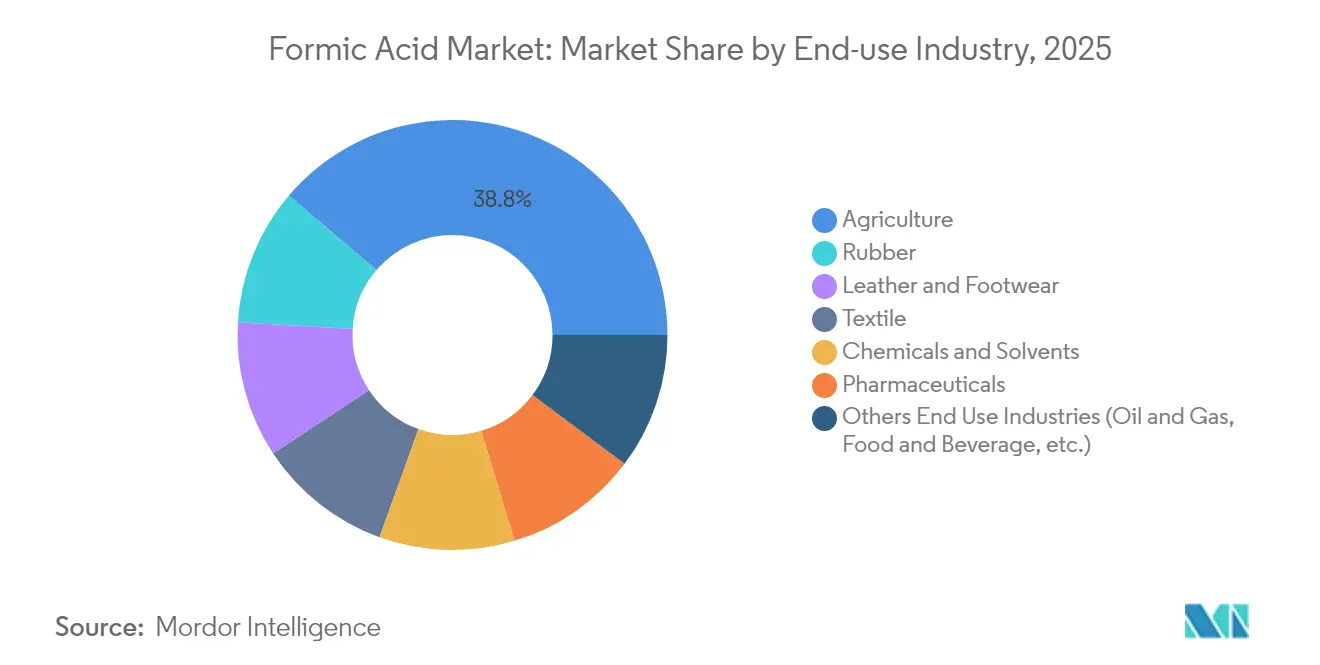
- By end-use industry, agriculture commanded 38.76% of the formic acid market share in 2025; pharmaceuticals represent the fastest-growing end use at a 4.38% CAGR.
- By geography, Asia-Pacific dominated with 52.88% of the formic acid market in 2025 and is advancing at a 4.49% regional CAGR.
Note: Market size and forecast figures in this report are generated using Mordor Intelligence’s proprietary estimation framework, updated with the latest available data and insights as of 2026.
Market Trends and Insights
Drivers Impact Analysis of Formic Acid Market*
| Driver | (~) % Impact on CAGR Forecast | Geographic Relevance | Impact Timeline |
|---|---|---|---|
| Growing demand for animal feed and silage additives | +1.2% | Europe & North America (highest); global | Medium term (2-4 years) |
| Substantial demand from leather and tanning industry | +0.8% | China & India | Medium term (2-4 years) |
| Increasing demand for rubber products | +0.7% | Southeast Asia | Short term (≤ 2 years) |
| Growing adoption in pharmaceutical industry | +0.6% | North America & Europe | Long term (≥ 5 years) |
| Growing Advancements in Bio-based Production | +0.5% | Europe and North America | Long term (≥5 yrs) |
| Source: Mordor Intelligence | |||


Growing Demand for Animal Feed and Silage Additives
Demand for antibiotic-free livestock production has positioned formic acid as a preferred preservative and antimicrobial. At 4 kg/ton in poultry diets, the acid can drive Salmonella counts to undetectable levels, safeguarding food safety and reinforcing regulatory compliance. The European Food Safety Authority allows inclusion rates up to 12,000 mg/kg for pigs and 10,000 mg/kg for poultry, providing legal certainty that accelerates adoption[1]European Food Safety Authority, “Formic Acid for All Animal Species,” efsa.europa.eu. These factors collectively lift feed-segment consumption above overall formic acid market growth.
Substantial Demand from Leather and Tanning Industry
Premium leather production relies on formic acid to adjust bath pH to 3.8–4.2, accelerating chrome fixation while lowering salt loads compared with mineral acids. Chinese and Indian tanneries, which supply a sizable portion of global hides, increasingly specify ≥ 85% purity, opening price-premium opportunities for suppliers able to guarantee consistency.
Increasing Demand for Rubber Products
Natural rubber processors prefer formic acid for precise coagulation, cutting sheet-drying times and enhancing tensile strength. BASF notes that 85% and 94% grades deliver the best cost-performance balance, supporting accelerated uptake across Malaysia, Thailand, and Indonesia.
Growing Adoption in Pharmaceutical Industry for Antibacterial Properties
Research teams are engineering formic-acid-derived hydrogels that speed diabetic wound healing by promoting tissue regeneration. The compound’s compatibility with numerous functional groups also makes it an essential intermediate in active pharmaceutical ingredient synthesis, pushing demand for pharmaceutical-grade material that commands higher margins.
Restraints Impact Analysis of Formic Acid Market*
| Restraint | (~) % Impact on CAGR Forecast | Geographic Relevance | Impact Timeline |
|---|---|---|---|
| Methanol feedstock price volatility | −0.9% | Global | Short term (≤ 2 years) |
| Risks related to corrosion and handling | −0.6% | Global | Medium term (2-4 years) |
| Rising Usage of Bio-propionic Acid as Alternative | -0.3% | Europe and North America | Long term (≥5 yrs) |
| Source: Mordor Intelligence | |||
Methanol Feedstock Price Volatility
Because methanol represents 60–70% of production costs in methyl formate hydrolysis, natural-gas-linked price swings compress margins and complicate long-term supply contracts. Producers are hedging by piloting CO₂ electro-reduction routes that could break feedstock dependence if renewable power prices keep falling.
Risks Related to Corrosion and Handling
Concentrations above 85% corrode carbon steel and require stainless-steel or polymer-lined equipment, elevating capital costs. OSHA exposure limits of 5 ppm further mandate strict ventilation and personal protective measures [2]National Institute for Occupational Safety and Health, “Formic Acid – NIOSH Pocket Guide to Chemical Hazards,” cdc.gov. Formulators such as Borregaard have responded with lignosulfonate-buffered blends that cut corrosivity while maintaining antimicrobial action, opening access for smaller feed mills.
*Our forecasts treat driver/restraint impacts as directional, not additive. The impact forecasts reflect baseline growth, mix effects, and variable interactions.
Formic Acid Market Segment Analysis
Application:
Feed Additives Drive Market MomentumAnimal feed & silage additives controlled 36.62% of global volume in 2025, giving the segment the largest slice of formic acid market size. Supported by regulatory curbs on antibiotic growth promoters, this share is projected to widen at a 4.12% CAGR. In poultry rations, inclusion rates of 4 kg/ton eliminate detectable Salmonella, boosting farmer confidence and retailer acceptance. Leather tanning remains the second-largest application, capitalizing on the acid’s pH control and chrome-penetration benefits, while textile mills value its dye-bath buffering capability. Pharmaceutical and specialty chemical uses are emerging, where high-purity requirements yield premium prices.
Growth prospects extend to natural rubber processing, which adopts formic acid for faster coagulation kinetics and higher aggregate tensile strength. Cleaning and descaling occupy a steady but smaller niche, leveraging the acid’s mineral-scale dissolving power at lower environmental impact than stronger inorganic acids. Safety-engineered formulations such as SoftAcid broaden access among smaller operations, suggesting incremental demand upside over the forecast period.


Production Method:
Efficiency Drives Process InnovationMethyl formate hydrolysis retained 58.74% share of the formic acid market in 2025, reflecting favorable scale economics and mature technology. Carbonylation remains the runner-up, while bio-based routes are rising rapidly at 4.6% CAGR as manufacturers aim to decouple from fossil inputs. The oxalic-acid route occupies a niche for ultra-high-purity output. Breakthroughs from the National Renewable Energy Laboratory have shown that a membrane-electrode assembly can convert CO₂ directly to concentrated formic acid at high Faradaic efficiency, laying groundwork for commercial roll-out if renewable power costs drop below 2.3 cents/kWh.
Over the next decade, capital deployment is expected to tilt toward low-carbon pathways, especially in Europe and North America where carbon-pricing regimes tighten. Producers investing early in CO₂-to-formic acid facilities can secure first-mover advantages in green-chemistry procurement channels, potentially reshaping regional competitive standings.
End-use Industry:
Agricultural Applications Lead GrowthAgriculture represented 38.76% of 2025 demand and is set to expand at a 4.33% CAGR through 2031—greater than the overall formic acid market. Adoption is driven by livestock producers replacing antibiotics with organic acids to comply with tightening food-safety rules. Leather & footwear ranked second in volume; continued urbanization in Asia supports steady growth for this segment despite rising environmental scrutiny. Textile mills use the acid as a dye-bath pH adjuster, while chemicals & solvents consumers value its reactivity for producing esters and formates.
Pharmaceutical uses, though smaller in volume, deliver high margins thanks to stringent purity standards. Rubber manufacturers in Southeast Asia are boosting intake in line with rising natural-rubber output. Early exploration of formic acid as a hydrogen carrier for fuel-cell mobility could unlock fresh demand if infrastructure matures, bolstering long-term upside.
Geography Analysis
APAC Formic Acid Market
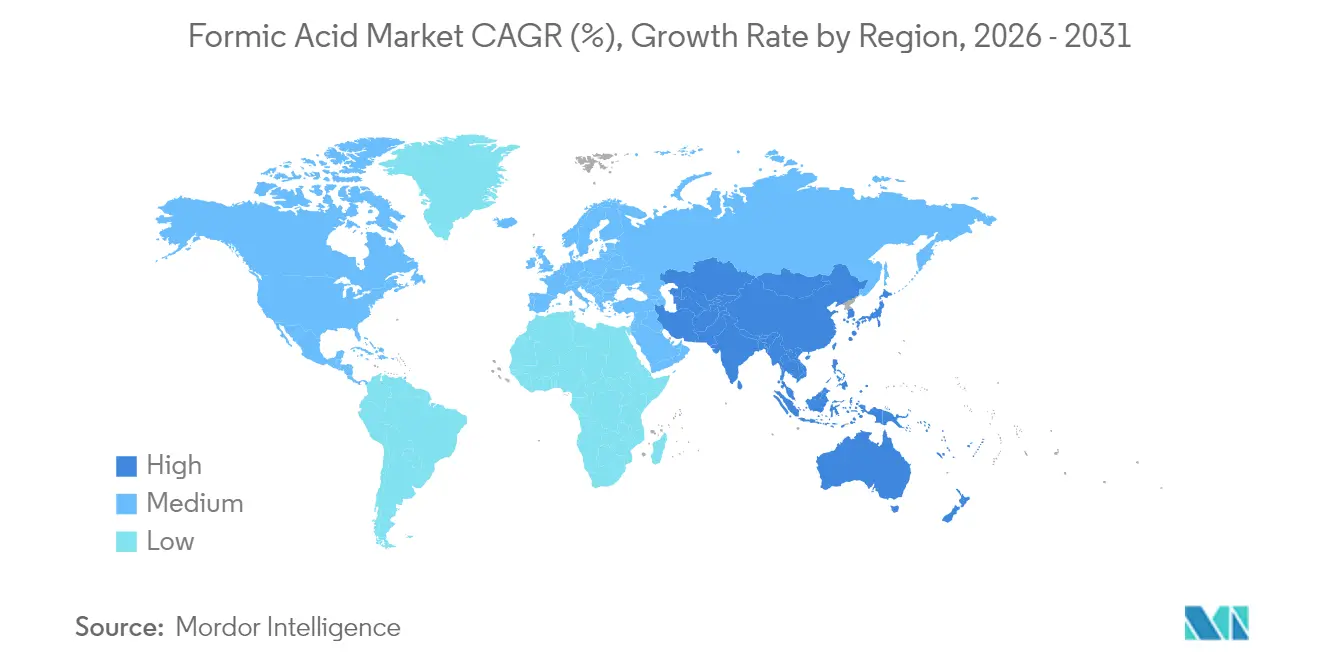
Asia-Pacific held 52.88% of global consumption in 2025, giving the region the largest slice of formic acid market share. China dominates regional supply, leveraging integrated methanol and downstream chemical complexes to ensure cost competitiveness. India’s producers, supported by export incentives and growing domestic leather output, are building new plants that lift regional self-sufficiency. Japan and South Korea source high-purity material for electronics and pharmaceutical synthesis, while Indonesia drives incremental growth through rubber-sector uptake.
North America Formic Acid Market
North America is the second-largest region, propelled by a vast animal-protein sector and government funding for CO₂-utilization R&D. The United States leads pilot deployment of electrochemical production units, eyeing commercial scale by decade-end. Canada’s demand is tied mainly to grain and livestock production, whereas Mexico sees rising leather and textile usage.
Europe, South America and Middle East Formic Acid Market
Europe combines strict feed and chemical regulations with aggressive decarbonization targets, spurring investment in bio-based processes. EU anti-dumping measures on imported chemicals intensify competition and encourage local capacity expansion. South America’s growth centers on Brazil’s expanding livestock sector, while the Middle East benefits from diversification agendas that encourage specialty-chemical investments. Cross-regional trade flows will likely stay fluid as Asia grows exports and western regions pivot to low-carbon supply chains.
Mordor Intelligence provides coverage of the formic acid market across other key regional markets, including Asia and Europe, each with their regulatory frameworks and demand patterns. Detailed country-level analysis extends to Saudi Arabia incorporating local coverage and market participation, as required.

Value Chain Analysis
The formic acid value chain begins with upstream energy-linked feedstocks, with methanol (and associated carbon monoxide supply) forming the cost anchor for the dominant methyl formate hydrolysis route, which held 58.74% of production in 2025. Producers convert methanol to methyl formate and hydrolyze it to formic acid, while niche routes, including formate-salt-based steps and oxalic-acid pathways, address specialty and higher-purity needs. Methanol price volatility remains a structural pressure because it represents 60-70% of production cost for methyl formate hydrolysis, keeping producer margins sensitive to natural gas and methanol cycle swings.
Midstream value creation focuses on purification (industrial versus higher-purity grades) and formulation into application-specific blends, followed by bulk storage and hazardous-chemical compliant transport (drums, IBCs, tank trucks, and ISO tanks). Downstream demand is fragmented across animal feed and silage additives (36.62% of 2025 volume), leather tanning, textiles, rubber coagulation, and pharmaceutical and chemical intermediates, which raises the importance of distributors and regional stock points for service levels. Bottlenecks tend to be linked to logistics disruptions (port congestion and railcar availability) and import dependence in some consuming markets, while larger integrated players, such as BASF and major Chinese and Indian producers, mitigate risk through scale, multi-plant footprints, and tighter alignment with large end users and formulators.
Competitive Landscape
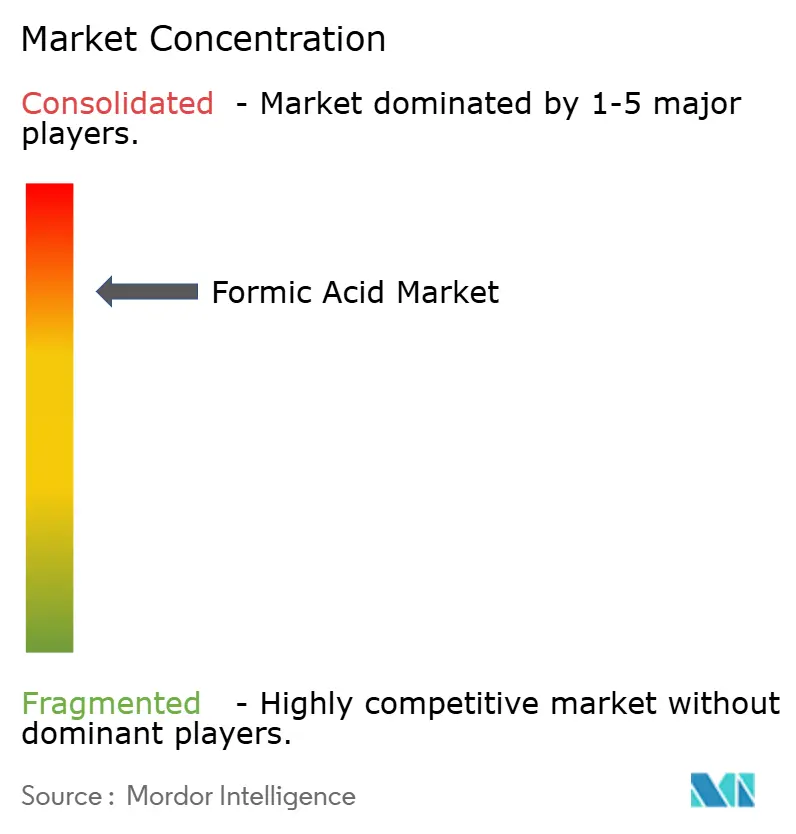
The formic acid market is consolidated, with BASF leading through integrated plants in Germany, China, and the U.S., mitigating feedstock volatility. Chinese firms like LUXI Group and Shandong Rongyue Chemical are expanding with units exceeding 100,000 tons/year, enhancing regional self-reliance and pressuring prices. Strategic moves include forward integration into feed-acid blends, renewable power agreements, and joint ventures targeting pharmaceutical-grade volumes. Start-ups, supported by public R&D grants, are scaling electrochemical devices to reduce carbon intensity and costs. BASF’s industrial heat pump at Ludwigshafen will produce CO₂-free steam, emphasizing sustainability. With North American capacity retiring and Asian self-sufficiency rising, competition is shifting to quality and carbon footprint. Suppliers meeting cradle-to-gate emissions benchmarks can secure premium contracts in feed, pharma, and energy storage markets.
Formic Acid Industry Leaders
Eastman Chemical Company
Shandong Acid Technology Co. Ltd.
BASF
Luxi Chemical Group Co.,Ltd.
Gujarat Narmada Valley Fertilizers and Chemicals Ltd
- *Disclaimer: Major Players sorted in no particular order
Formic Acid Market Companies Covered in this Report
- BASF
- Eastman Chemical Company
- Gujarat Narmada Valley Fertilizers and Chemicals Ltd
- Luxi Chemical Group Co.,Ltd.
- Perstorp
- POLIOLI SpA
- Sintas Kurama Perdana
- Rashtriya Chemicals and Fertilizers Ltd
- Shandong Acid Technology Co., Ltd.
- Shandong Rongyue Chemical Co. Ltd
- Wuhan Ruisunny Chemical Co. Ltd

Market Opportunities and Future Outlook
Decarbonized production is the main whitespace in the supply base, given the market's reliance on methanol-based routes and the push for lower-carbon intermediates in regulated supply chains. A concrete example is the July 2026 partnership announcement between Adani Enterprises Limited and Dioxycle to develop and pilot a low-carbon formic acid facility in India using captured CO2 and renewable electricity, reflecting wider commercial interest in CO2-utilization and electrified pathways for commodity acids. Process innovation around CO2-to-formic acid electrochemical conversion is also moving from lab and pilot work toward scaling, which creates an additional option for producers aiming to reduce exposure to methanol feedstock swings.
On the demand side, higher-purity and performance-differentiated grades create room for value capture beyond standard industrial material, especially where qualification and consistency are required. Electronics and semiconductor manufacturing also uses high-purity formic acid as a residue-free cleaning agent, supporting demand for suppliers that can provide dependable purification, contamination control, and documentation alongside stable regional distribution. In animal nutrition, adoption is supported by antibiotic-reduction programs and defined inclusion allowances in major markets (for example EFSA guidance for multiple species), which underpins continued expansion of formulated feed-acid blends that improve handling and reduce corrosivity for smaller feed mills. At the same time, capacity additions and announced expansion plans in China, alongside investment signals from other regional producers, strengthen incentives for non-integrated suppliers to move up the value chain into specialty grades, application blends, and service-led distribution rather than competing only on undifferentiated bulk volume.
Recent Industry Developments in Formic Acid Market
- July 2026: Adani Enterprises Limited and Dioxycle announced a partnership to develop and pilot India's first low-carbon formic acid facility using captured CO2 and renewable electricity at an Adani Group site. The collaboration underscores growing commercial interest in CO2-utilization routes for formic acid and adds a new pathway for Indian supply beyond conventional methanol-based production.
- September 2025: BASF held a groundbreaking ceremony for an industrial heat pump at its Ludwigshafen site to generate CO2-free steam for formic acid production, with commissioning scheduled for mid-2027. The project ties formic acid output to lower-emissions utility integration and supports BASF's positioning with customers that track product carbon footprint.
- October 2024: BASF secured funding from Germany's Federal Ministry for Economic Affairs and Climate Action to build a large industrial heat pump tied to its formic acid value chain at Ludwigshafen, targeting up to a 98% reduction in greenhouse gas emissions for the steam supply to the plant when operating. The funding supports capital deployment toward lower-carbon production infrastructure in Europe, where decarbonization requirements increasingly influence supplier selection.


Formic Acid Market Report Scope and Research Methodology
Market Definition and Coverage
For this methodology, the market covers formic acid sold for commercial use, measured in physical volume, across the main end-use applications and regions where it is produced, traded, and consumed.
Scope exclusions: Derivatives and downstream formulations that use formic acid as an input are excluded when they are priced and traded as separate products.
Segments Covered in This Report
- By Application
- Animal Feed and Silage Additives
- Leather Tanning
- Textile Dyeing and Finishing
- Intermediary in Pharmaceuticals and Chemicals
- Other Applications (Rubber and Latex Coagulation, Cleaning and Descaling Agents, etc.)
- By Production Method
- Methyl Formate Hydrolysis
- Carbonylation Technology
- Other Production Methods (Oxalic-acid Route, Fermentation/Bio-based Route)
- By End-use Industry
- Agriculture
- Leather and Footwear
- Textile
- Chemicals and Solvents
- Pharmaceuticals
- Rubber
- Others End User Industries (Oil and Gas, Food and Beverage, etc.)
- By Geography
- Asia-Pacific
- China
- India
- Japan
- South Korea
- Rest of Asia-Pacific
- North America
- United States
- Canada
- Mexico
- Europe
- Germany
- United Kingdom
- France
- Italy
- Rest of Europe
- South America
- Brazil
- Argentina
- Rest of South America
- Middle East and Africa
- Saudi Arabia
- South Africa
- Rest of Middle-East and Africa
- Asia-Pacific
Data Sources, Market Sizing, and Validation
Desk Research
Desk research was used to build the starting map of supply, demand, and trade flows for formic acid, and then to set realistic ranges for utilization, import reliance, and end-use splits. We typically pull public sources such as UN Comtrade for trade trends, USGS and national geological or chemical statistics where available, and OECD and World Bank indicators that help explain industrial output and livestock activity.
To ground the chemical and application logic, we also review sources such as FAO publications on silage and feed preservation practices, environmental and chemical safety releases from agencies such as the US EPA and ECHA, and peer-reviewed journals that discuss process routes and concentration grades. Company annual reports, investor presentations, and reputable press are used to confirm capacity additions, shutdowns, and regional footprint, and a paid subscription for company financials, news screening, patents, and shipment-level trade checks is used selectively to cross-verify timelines and volumes. These examples are not exhaustive, and other public sources were also referenced to collect, validate, and clarify data points.
Primary Interviews and Surveys
Primary interviews and surveys were run with a mix of producers, distributors, and downstream users that purchase formic acid for agriculture, leather, textiles, and chemical intermediates. The respondent input helped confirm typical concentration mixes, regional pricing behavior, substitution patterns, and the practical share going into each use case. We then used the feedback to sanity check the desk assumptions across APAC, EMEA, and the Americas.
Distribution of primary research fieldwork respondents
| Company type | Respondent position | Region |
|---|---|---|
| Top tier: 32% | CXOs: 18% | APAC: 40% |
| Mid tier: 50% | Functional/Unit leaders: 29% | EMEA: 33% |
| Smaller Players: 18% | Managers: 53% | Americas: 27% |
Market-Sizing & Forecasting
Sizing is built using a top-down structure where production, capacity, and trade data are used to reconstruct the regional demand pool in tons, which is then split into major uses based on verified consumption signals. To keep the output practical, we corroborate totals with selective bottom-up approximations, such as sampling supplier shipments and matching typical price ranges to volume bands, followed by adjustments when the two views disagree.
Key inputs in our model include plant capacity additions and utilization ranges, import and export direction by major corridors, livestock and silage preservation intensity as a demand indicator, leather and textile activity signals, and observed concentration grade mix in trade and procurement. For forecasting, scenario analysis is applied around utilization recovery, trade policy shifts, and end-use momentum, and then the final path is aligned to what primary respondents describe as the most likely base case. Where local data is thin, we gap-fill using proxy ratios from similar countries and then re-check the implied per-capita or per-output consumption to keep it realistic.
Data Validation & Update Cycle
Outputs are triangulated across supply-side signals, demand indicators, and trade movements, and then variance checks are run to flag unusual jumps in a country or application split. If a variance cannot be explained by a capacity event, a regulation shift, or a trade change, we re-check the inputs and, when needed, re-contact respondents to confirm what changed on the ground.
A multi-step internal review is completed before sign-off so assumptions, units, and conversions are consistent across regions. Reports are refreshed annually, and interim updates are triggered by material events such as major capacity starts, extended outages, or sharp feedstock and pricing swings. Before delivery, a final analyst pass is completed so clients receive the latest updated view.
Mordor Intelligence's Formic Acid Market Size Versus Other Published Estimates
Published market sizes for formic acid can look far apart because different studies do not always measure the same thing, even when the titles look similar. The biggest differences usually come from whether the output is in value or volume, the year used as the starting point, and how trade and concentration grades are handled in regional totals.
Downstream derivatives and formulated products often get folded into some revenue estimates, but they sit outside Mordor Intelligence's scope because the model tracks only formic acid volumes in tons to keep supply and trade checks consistent. Gaps can also be created when one estimate assumes faster price inflation, uses aggressive utilization recovery, or converts currencies using different timing, which then lifts the USD number even if tonnage is similar.
Benchmark comparison
| Source | Market Size | Gaps in Research Methodology |
|---|---|---|
| Mordor Intelligence | USD 1.14 M (2026) | |
| Global Consultancy A | USD 2.37 B (2024) | Reports a value-based market and may include broader grade and downstream revenue capture, so the total rises versus a tons-only accounting. |
| Trade Journal B | USD 1.30 B (2024) | Uses revenue sizing with its own grade mix and price assumptions, and the USD total shifts with inflation and currency timing rather than only volume changes. |
The table shows that most of the spread is not a pure demand disagreement, it is mainly an output choice of tons versus revenue and how adjacent product revenues are treated. By keeping the steps tied to capacity, trade, and end-use volume signals, the estimate stays easier to replicate and to stress test when assumptions like utilization or pricing are updated.


Key Questions Answered in the Report
What is the current Formic Acid Market size?
The formic acid market stands at 1.14 million tons in 2026 and is projected to reach 1.38 million tons by 2031 at a 3.86% CAGR.
Which application segment leads global demand?
Animal feed & silage additives dominate, holding 36.62% of formic acid market share in 2025 and growing at 4.12% CAGR through 2031.
Why is Asia-Pacific the largest regional market?
Asia-Pacific benefits from extensive manufacturing capacity, especially in China and India, giving the region 52.88% of global volume and the fastest regional CAGR of 4.49%.
How are producers addressing methanol price volatility?
Leading companies are piloting CO₂-to-formic acid electrochemical routes and investing in renewable-power-driven heat-integration projects to decouple costs from fossil feedstocks.
What makes formic acid attractive to the pharmaceutical sector?
Pharmaceutical-grade formic acid offers high purity and versatile reactivity, enabling synthesis of complex molecules and advanced hydrogels that accelerate wound healing.
Page last updated on:


 Your data is secure and never sold or shared.


