
Phosphoric Acid Market Size and Share
Market Overview
| Study Period | 2021 - 2031 |
|---|---|
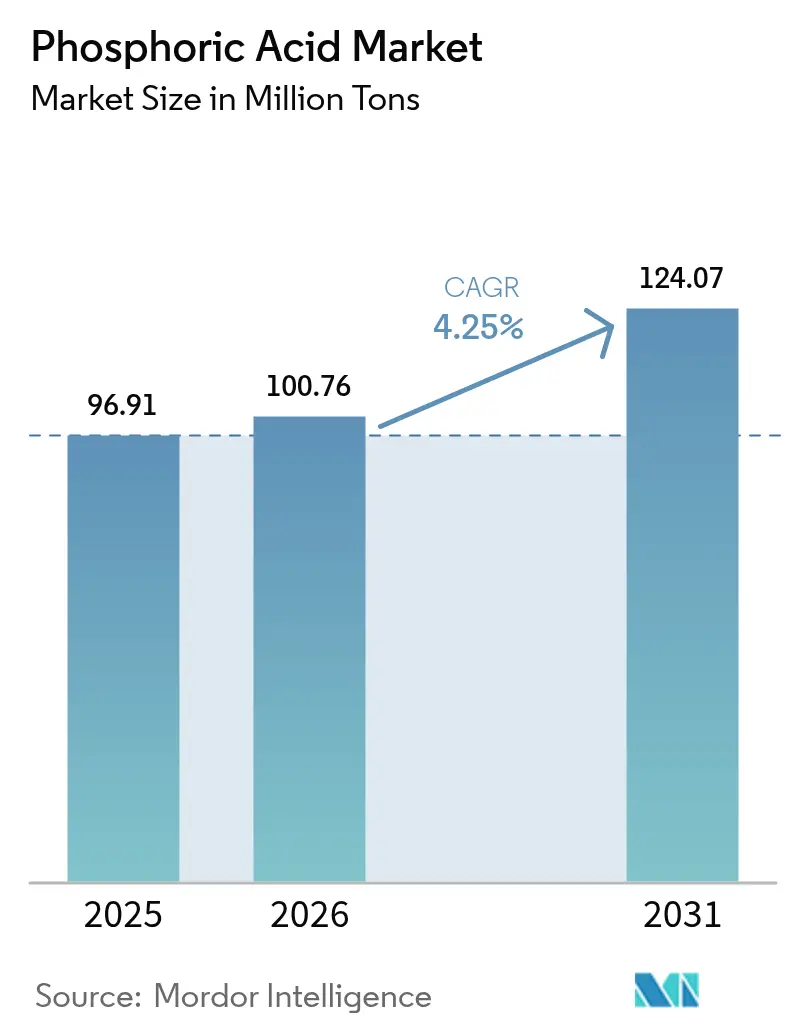
| Market Volume (2026) | 100.76 Million tons |
| Market Volume (2031) | 124.07 Million tons |
| Growth Rate (2026 - 2031) | 4.25 % |
| Fastest Growing Market | Asia Pacific |
| Largest Market | Asia Pacific |
| Market Concentration | Medium |
Major Players *Disclaimer: Major Players sorted in no particular order Image © Mordor Intelligence. Reuse requires attribution under CC BY 4.0. | |
Phosphoric Acid Market Analysis by Mordor Intelligence
The Phosphoric Acid Market size is projected to be 96.91 million tons in 2025, 100.76 million tons in 2026, and reach 124.07 million tons by 2031, growing at a CAGR of 4.25% from 2026 to 2031. Fertilizer‐grade material continues to dominate volumes, yet heightened food-security programs and the steady switch from citric to phosphoric blends in ready-to-drink beverages are widening the customer base. Chinese and Moroccan producers still anchor cost leadership, but closed-loop recycling of LiFePO₄ cathodes is beginning to redirect investment toward secondary-source capacity that bypasses phosphogypsum disposal. Micro-flotation of low-grade ores is stretching the life of mature deposits, while electronics-grade and ultra-pure variants cushion specialty players against fertilizer price swings.
Key Report Takeaways
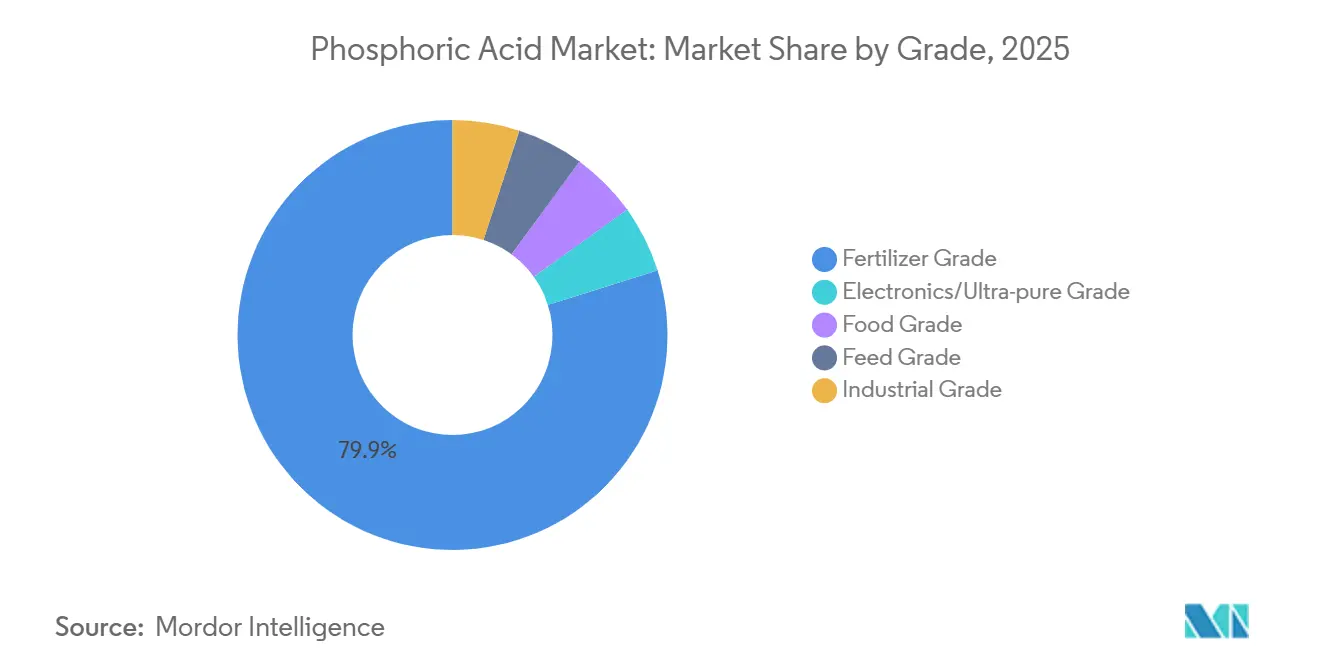
- By grade, fertilizer-grade captured 79.87% of the phosphoric acid market share in 2025, while food-grade advanced at a 4.59% CAGR through 2031.
- By process, the wet process accounted for 90.51% share of the phosphoric acid market size in 2025, while secondary-source/recovery advanced at a 5.22% CAGR through 2031.
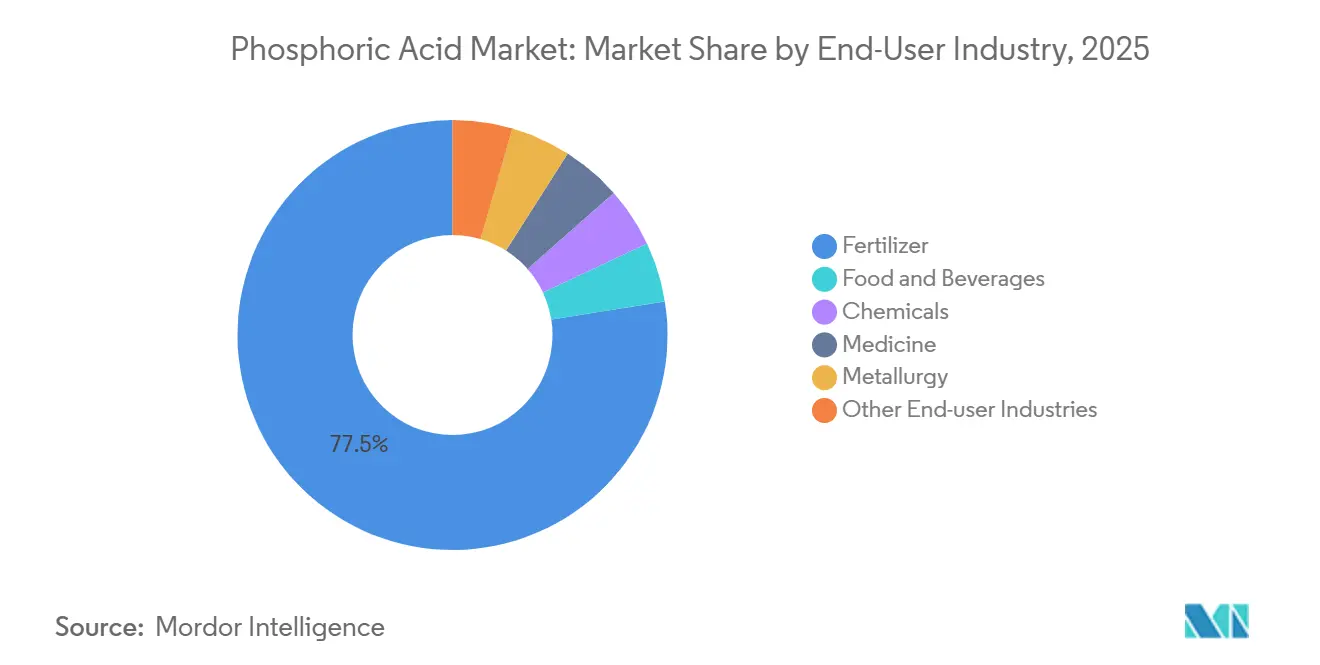
- By end-user industry, fertilizer led with a 77.49% revenue share in 2025 in the phosphoric acid market, while food and beverages advanced at a 4.72% CAGR through 2031.
- By geography, Asia-Pacific held 55.97% of the global phosphoric acid market share in 2025 and is forecast to post a 4.54% CAGR to 2031.
Note: Market size and forecast figures in this report are generated using Mordor Intelligence’s proprietary estimation framework, updated with the latest available data and insights as of 2026.
Market Trends and Insights
Drivers Impact Analysis of Phosphoric Acid Market*
| Driver | (~) % Impact on CAGR Forecast | Geographic Relevance | Impact Timeline |
|---|---|---|---|
| Fertilizer-grade demand acceleration in food-security programs | +1.2% | India, Sub-Saharan Africa, Southeast Asia | Medium term (2-4 years) |
| Processed food & RTD beverage acidulant uptake | +0.7% | North America, Europe, APAC urban centers | Short term (≤2 years) |
| LiFePO₄ battery production & closed-loop recycling | +0.9% | China, South Korea, European EV hubs | Medium term (2-4 years) |
| High-purity electronics-etch demand in semiconductor fabs | +0.6% | Taiwan, South Korea, Japan, United States | Long term (≥4 years) |
| Low-grade ore micro-flotation unlocking new capacity | +0.5% | Morocco, Jordan, Saudi Arabia, China | Long term (≥4 years) |
| Source: Mordor Intelligence | |||
Fertilizer-Grade Demand Acceleration in Food-Security Programs
India committed USD 4.2 billion in 2025 to subsidize diammonium phosphate, an outlay that lifted domestic phosphoric acid offtake by 1.8 million tons[1]Government of India, “Fertilizer Subsidy Budget 2025,” fertiliser.nic.in. The African Union’s Agenda 2063 targets fertilizer use of 50 kg per hectare by 2030, triple today’s level, pulling in more imported acid across the continent. China’s 22% export-quota cut on phosphate rock in 2024 has already rerouted buyers toward Moroccan cargoes, supporting merchant acid pricing above USD 900 per ton through 2027. Sovereign programs are also accelerating backward integration; IFFCO’s 500,000-ton Paradip unit entered service in 2025, trimming India’s import reliance below 50%.
Processed Food & RTD Beverage Acidulant Uptake
US soft-drink formulators replaced 340,000 tons of citric acid with phosphoric alternatives in 2025 to neutralize tart flavors while meeting the FDA’s 0.5% additive ceiling that sits well above normal inclusion rates[2]Food and Drug Administration, “Phosphate Additive Guidance 2024,” fda.gov. Globally, ready-to-drink coffee and tea volumes are rising at a 6.1% CAGR to 2030, each liter requiring phosphoric chelation to prevent protein precipitation. Per-capita soft-drink intake in China is still one-third of the US figure, signaling ample growth headroom. Europe’s E338 classification continues to approve phosphoric use in dairy desserts and processed cheese, adding 180,000 tons of demand in 2025.
LiFePO₄ Battery Production & Closed-Loop Recycling
LiFePO₄ cathodes supplied 42% of EV battery capacity in 2025, consuming 2.1 million tons of battery-grade acid. Selective sulfuric leaching of spent cathodes now recovers phosphoric acid at 92-96% purity, eliminating phosphogypsum disposal and meeting China’s 25% recycled-content mandate for 2026 batteries. CATL and BYD each started 50,000-ton recovery lines in 2025, while Europe’s Battery Regulation fixes a 12% recycled phosphorus threshold by 2031.
High-Purity Electronics-Etch Demand in Semiconductor Fabs
Semiconductor fabs used 78,000 tons of over and equal to 99.999% phosphoric acid in 2025; TSMC alone absorbed 22%. U.S. CHIPS Act funding has Intel and Samsung building Arizona and Texas complexes that will jointly need 18,000 tons a year after 2028. Etchant prices run 8-12 times fertilizer-grade because multi-stage ion-exchange removes metals below parts-per-billion thresholds. Shrinking node sizes toward 3 nm are expected to lift etchant volumes 14% annually through 2030.
Restraints Impact Analysis of Phosphoric Acid Market*
| Restraint | (~) % Impact on CAGR Forecast | Geographic Relevance | Impact Timeline |
|---|---|---|---|
| Rock-phosphate supply shocks from Morocco & China | -0.8% | Import-dependent Asia-Pacific and Europe | Short term (≤2 years) |
| Zero-liquid-discharge rules inflating effluent costs | -0.5% | European Union, United States, India | Medium term (2-4 years) |
| Non-phosphate water-treatment chemistries gaining share | -0.3% | North America, Europe | Long term (≥4 years) |
| Source: Mordor Intelligence | |||
Rock-Phosphate Supply Shocks from Morocco and China
Morocco's OCP Group controls approximately 70% of global seawater-grade phosphate rock reserves, yet extraction rates at the Khouribga and Youssoufia mines face geological constraints as ore grades decline from 32% P₂O₅ in 2020 to 28% P₂O₅ in 2025, requiring higher beneficiation costs. China’s 22% export-quota reduction in 2024 limited shipments to 4.8 million tons, forcing Asian buyers to pay USD 85-110 per-ton freight premiums on Moroccan supply. Conveyor sabotage in Western Sahara idled 1.2 million tons of capacity for three months in 2024, exposing a single-source risk.
Zero-Liquid-Discharge Rules Inflating Effluent Costs
Wet-process phosphoric acid production generates 4.5–5.2 tons of phosphogypsum per ton of P₂O₅, creating 220 million tons of annual waste globally; zero-liquid-discharge mandates in the European Union's Industrial Emissions Directive and California's Porter-Cologne Water Quality Control Act require closed-loop water recycling and crystalline salt disposal, adding USD 18–25 million in capital expenditure per 200,000-ton annual capacity plant. California’s Porter-Cologne Act and India’s 2025 CPCB guidelines impose similar thresholds, pushing retrofit costs above USD 12 million per legacy facility.
*Our forecasts treat driver/restraint impacts as directional, not additive. The impact forecasts reflect baseline growth, mix effects, and variable interactions.
Phosphoric Acid Market Segment Analysis
By Grade:
Specialty Variants Outpace Commodity TonnageFertilizer-grade captured 79.87% of 2025 output, yet food-grade will advance at 4.59% CAGR through 2031 as beverage formulators escalate pH-stabilizer use. Electronics and ultra-pure grade, with their price realization, 8-12 times fertilizer levels, protect margins, a clear benefit for niche suppliers.
Price bifurcation is widening. Taiwan Semiconductor Manufacturing Company’s Arizona fab alone locks in 6,800 tons a year of over and equal to 99.999% material with premiums of 40-60% above spot. EFSA’s 2024 re-evaluation of additive E338 reinforced the regulatory comfort, stimulating dedicated food-grade investments.



By Process:
Wet-Process Dominance Faces Circular-Economy DisruptionWet-process routes commanded 90.51% of 2025 production volume, leveraging sulfuric acid digestion of phosphate rock to yield 28–32% P₂O₅ merchant-grade acid, yet secondary-source recovery will grow at 5.22% CAGR through 2031 as battery recyclers and rare-earth element extraction plants commercialize closed-loop phosphorus streams. Thermal acid stayed at lower tonnage because the power requirements of 12-14 MWh per ton keep costs elevated.
Recyclers eliminate USD 40-60 per-ton phosphogypsum liabilities and tap feedstocks that assay 18-22% phosphorus, above many natural ores. CATL’s 50,000-ton Ningde unit illustrates the economics, retrieving battery-grade phosphoric acid at 94% purity while meeting China’s recycled-content mandate.
By End-User Industry:
Fertilizer Anchor Meets Specialty GrowthFertilizer retained 77.49% of demand in 2025, linked tightly to crop subsidies and grain prices, whereas food-and-beverage applications will lift their share as citric substitution accelerates. Chemical detergents face share erosion from phosphorus-free formulas, and metallurgy demand benefits from new micro-flotation installations.
Fertilizer demand remains tightly coupled to crop prices and subsidy programs; India's 2025 allocation of USD 4.2 billion for diammonium phosphate subsidies directly lifted domestic phosphoric acid consumption by 1.8 million tons. Food and beverage growth is concentrated in Asia-Pacific, where per-capita soft-drink consumption in China (39 liters in 2025) and India (12 liters) trails developed-market levels by 60–70%, suggesting sustained acidulant demand as middle-class expansion continues. Conversely, phosphate-based detergents ceded eight points of North American laundry-aid share between 2020-2025.
Geography Analysis
APAC Phosphoric Acid Market
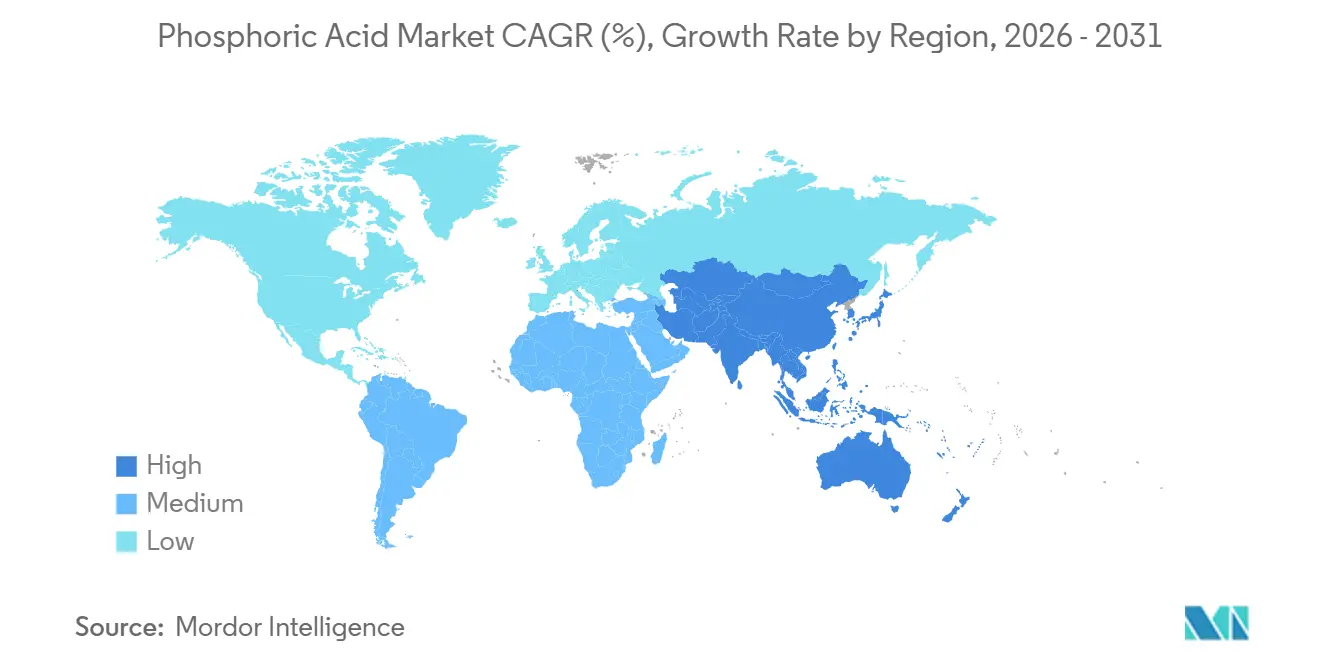
Asia-Pacific held 55.97% volume share in 2025 and will lead global expansion at 4.54% CAGR through 2031, propelled by China's 40 million ton annual production capacity and India's drive to halve diammonium phosphate imports by 2028 through backward integration. Japan and South Korea collectively consumed substantial amounts of electronics-grade phosphoric acid in 2025, with Samsung Electronics and SK Hynix securing long-term supply contracts from Prayon and Innophos to support memory-chip production expansions.
North America and APAC Phosphoric Acid Market
In North America, Mosaic’s Florida-Louisiana chain produced 4.8 million tons, but Asia-Pacific will continue to outrun Western tonnage growth. The US CHIPS and Science Act is driving a counter-trend in ultra-pure phosphoric acid demand; Intel's Arizona fab and Samsung's Texas facility will collectively consume a significant amount annually by 2028, requiring dedicated supply agreements with Innophos and Prayon. Canada lacks economic ore, so Nutrien imports merchant acid to blend with potash.
Europe Phosphoric Acid Market
In Europe, production is concentrated in Belgium (Prayon), Finland (Yara), and Russia (PhosAgro), yet the region faces structural decline as zero-liquid-discharge mandates and carbon-border adjustment mechanisms inflate production costs. Europe confronts cost pressure from water-recovery rules and sanctions on Russian supply. Prayon spent USD 85 million in 2024 to reach 95% water recycling, while Russian exports into the bloc fell 80% since 2023. Germany’s BASF and France’s Timac are testing rare-earth extraction from imported streams to hedge margins.

Value Chain Analysis
The value chain starts with phosphate rock mining and beneficiation, including micro-flotation and reverse-flotation for lower-grade ores, with sulfur and ammonia supply shaping delivered costs. Most volumes are produced through the wet process, where sulfuric acid digests phosphate rock to yield merchant-grade phosphoric acid alongside a phosphogypsum byproduct stream. That byproduct handling and disposal burden is one reason secondary-source and recovery routes are drawing more attention, particularly where they bypass gypsum management. Upstream-to-midstream players such as OCP Group, Mosaic, PhosAgro, Yara, ICL, and regionally integrated exporters such as Indorama/ICS (Senegal) tend to operate across captive rock, acid, and fertilizer assets, which reduces exposure to traded intermediates.
Downstream, acid is either consumed captively in DAP/MAP/NPK fertilizer plants or sold as merchant acid to fertilizer blenders and specialty converters, including food additives, metal treatment chemicals, and ultra-pure electronics etchants. Distribution is dominated by bulk marine logistics from resource hubs into import-dependent demand centers, and supply can tighten when export restrictions and quotas are used to protect domestic food security, prompting buyers to diversify sourcing and expand backward integration. Specialty end-use chains for food and electronics/ultra-pure grades add purification and quality-control steps, such as multi-stage ion exchange and tighter metals management in packaging and handling, shifting value capture toward suppliers with dedicated purification capacity, traceability, and long-term offtake commitments.
Competitive Landscape
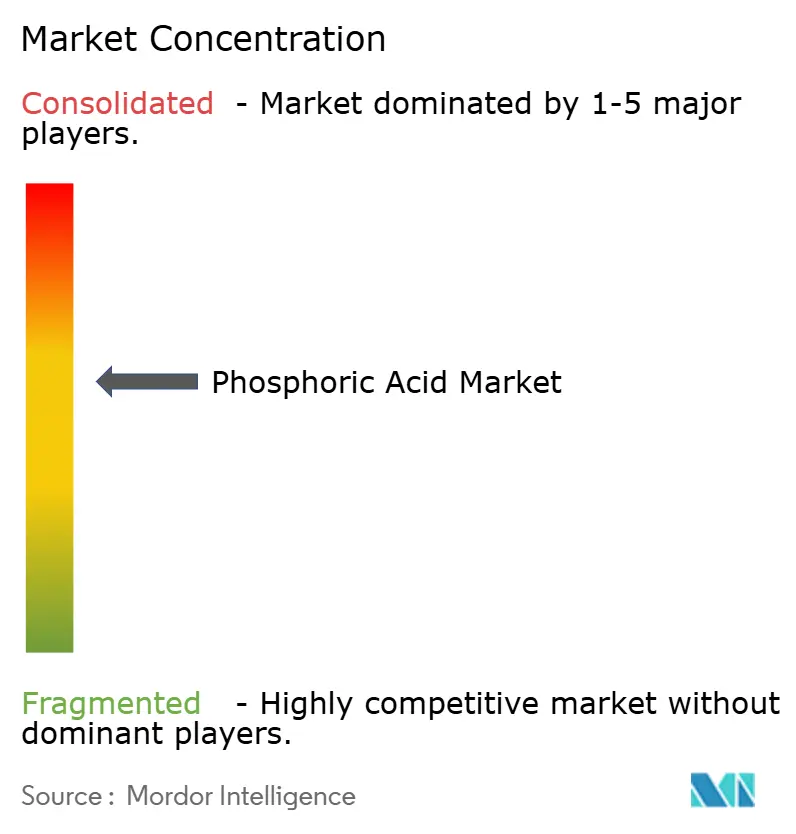
The Phosphoric Acid market is moderately concentrated. Technology adoption is splitting the field. OCP, Ma’aden, and Mosaic are scaling micro- or reverse-flotation to exploit 12-16% P₂O₅ ores. Meanwhile, CATL’s recovery line treats phosphoric acid as a co-product, bypassing gypsum disposal altogether. Smaller standalone merchants struggle to fund USD 18-25 million compliance retrofits, pushing the sector toward consolidation.
Phosphoric Acid Industry Leaders
Mosaic
OCP
Nutrien
Yara International
ICL
- *Disclaimer: Major Players sorted in no particular order
Phosphoric Acid Market Companies Covered in this Report
- Aditya Birla Group
- Agropolychim
- EuroChem Group
- ICL
- IFFCO
- Innophos
- J.R. Simplot Company
- Jordan Phosphate Mines Company, PLC. (JPMC)
- Mosaic
- Nutrien
- OCP
- PhosAgro Group
- Prayon
- Sterlite Copper (A Unit of Vedanta Limited)
- Yara International
- Yuntianhua Co., Ltd.

Market Opportunities and Future Outlook
A practical opportunity is import-substitution and backward integration in major fertilizer-consuming markets, with India providing visible project evidence in 2026. Rashtriya Chemicals and Fertilizers (RCF) received in-principle board approval for a 300 t/day phosphoric acid unit at Thal, Coromandel International began trial production at new phosphoric acid (650 t/day) and sulfuric acid (2,000 t/day) plants at Kakinada, and FACT announced a Capex 2.0 plan that includes a 700 t/day phosphoric acid plant at its Cochin division. Together, these efforts increase captive acid availability, reduce dependence on seaborne merchant acid and raw-material volatility, and create demand for related inputs and services, including sulfuric acid, evaporation systems, corrosion-resistant materials, and operations support tied to wet-process asset reliability.
Process-stream valorization and efficiency upgrades also offer room for differentiation, particularly around energy, water, and co-product economics. Industrial-scale validation of improved evaporation technology reported with GEA and Yara International points to measurable steam savings for concentration, while continued work on selective leaching and rare-earth enrichment highlights routes to monetize phosphate streams beyond fertilizer-grade acid. At the same time, new North American activity around local phosphoric acid production and purification, including Quebec-based initiatives, adds optionality for regional supply chains serving battery materials and other higher-purity applications, where supply assurance and impurity control command a premium.
Recent Industry Developments in Phosphoric Acid Market
- July 2026: The Mosaic Company announced additional phosphate operating rate cuts across four North American plants and multiple Brazilian facilities, citing sulfur shortages linked to wider supply disruptions. The company’s action highlighted how sulfur availability can constrain wet-process phosphoric acid and downstream phosphate fertilizer output, tightening the near-term supply chain for both integrated and merchant volumes.
- June 2026: Arianne Phosphate reported successful pilot-scale production of purified phosphoric acid in partnership with Travertine Technologies, including a process result featuring over 95% sulfur recovery. The outcome supports alternative purification and reagent-recovery flows that reduce input intensity and improve resilience for higher-purity end markets.
- March 2025: OCP Nutricrops made a strategic investment to increase fertilizer production capacity, expanding phosphoric acid availability as a core intermediate for phosphate fertilizers. The capacity expansion reinforced the role of large, vertically integrated producers in balancing global supply when import-dependent regions face rock, sulfur, and logistics volatility.


Phosphoric Acid Market Report Scope and Research Methodology
Market Definition and Coverage
This market is defined as the global demand and supply of phosphoric acid across common grades and production routes, measured primarily in physical volume and tracked through end-use consumption, production balance, and trade movements.
Scope exclusions: Retail packaged products that only contain phosphoric acid as a minor ingredient are excluded from the core market count.
Segments Covered in This Report
- By Grade
- Fertilizer Grade
- Food Grade
- Feed Grade
- Industrial Grade
- Electronics/Ultra-pure Grade
- By Process
- Wet-Process
- Thermal-Process
- Secondary-Source/Recovery
- By End-User Industry
- Fertilizer
- Food and Beverages
- Chemicals
- Medicine
- Metallurgy
- Other End-user Industries
- By Geography
- Asia-Pacific
- China
- India
- Japan
- South Korea
- ASEAN
- Rest of Asia-Pacific
- North America
- United States
- Canada
- Mexico
- Europe
- Germany
- United Kingdom
- France
- Italy
- Russia
- Rest of Europe
- South America
- Brazil
- Argentina
- Rest of South America
- Middle-East and Africa
- Saudi Arabia
- United Arab Emirates
- South Africa
- Egypt
- Rest of Middle-East and Africa
- Asia-Pacific
Data Sources, Market Sizing, and Validation
Desk Research
Desk research starts with mapping where phosphoric acid is produced, traded, and finally consumed, so our model has a grounded set of volumes and flows. Public sources, such as the USGS minerals statistics, UN Comtrade customs data, FAOSTAT fertilizer and agriculture indicators, International Fertilizer Association publications, and EPA or ECHA regulatory disclosures, help us frame capacity, import-export direction, and key use trends.
We also refer to company annual reports, investor presentations, and plant level announcements to understand expansions, shutdowns, and utilization shifts, which can tighten or loosen supply and move pricing. For supporting checks, we use paid subscriptions focused on company financials and intelligence, patent databases, and shipment-level trade data where available, which helps confirm timing and scale when public disclosures are incomplete. This desk list is not exhaustive, and many other public and paid sources were used to collect data, validate inputs, and clarify open questions.
Primary Interviews and Surveys
Primary work is used to pressure-test the desk view and to fill gaps around operating rates, contract versus spot exposure, and practical price realization by grade and region. We speak with producers, distributors, and large end users across APAC, EMEA, and the Americas so assumptions on trade flows, seasonality in fertilizer demand, and short-term disruptions can be checked before finalizing the model.
Distribution of primary research fieldwork respondents
| Company type | Respondent position | Region |
|---|---|---|
| Top tier: 28% | CXOs: 13% | APAC: 43% |
| Mid tier: 58% | Functional/Unit leaders: 34% | EMEA: 31% |
| Smaller Players: 14% | Managers: 53% | Americas: 26% |
Market-Sizing & Forecasting
Sizing uses a top-down build that reconstructs regional consumption from phosphate fertilizer output, industrial demand indicators, and net trade signals, and then converts those demand pools into phosphoric acid volumes by applying typical conversion factors and grade mix. To keep the totals realistic, results are corroborated with selective bottom-up approximations, such as sampling announced capacity by process route, checking utilization ranges from interviews, and comparing implied volumes against a short list of producer and channel checkpoints.
Key inputs used in the model include phosphoric acid production capacity and utilization, import-export balances by major trading corridors, fertilizer production volumes and planting season timing, industrial chemical output trends, and indicative acid price movements by grade. Since the report is volume-led, pricing is mainly used as a reasonableness check when value discussions appear, and any currency conversion is kept consistent to the same timing window used for the base year. Forecasts are built using scenario analysis supported by short-cycle signals like crop nutrient demand, capacity additions, and trade policy changes, and then refined with expert views on which drivers are likely to hold versus normalize.
Data Validation & Update Cycle
Model outputs are checked against independent signals, including trade totals, capacity announcements, and implied consumption intensity in fertilizer production, and then the numbers are reviewed for outliers by geography and grade. When a variance is large, we re-check assumptions, re-contact sources if needed, and adjust the conversion factors or utilization logic until the story and the math align.
Before sign-off, the work goes through multi-step analyst review so unit consistency, year mapping, and any currency timing used in cross-checks are clean and traceable. Reports are refreshed annually, and interim updates are made when material events occur, such as major plant outages, new capacity start-ups, or sharp feedstock and pricing swings. Right before delivery, a fresh pass is completed to reflect the latest available public releases and market signals.
Mordor Intelligence's Phosphoric Acid Market Size Versus Other Published Estimates
Different publishers often land on different market sizes because they do not always count the same thing, even when the title looks identical. In phosphoric acid, gaps usually come from whether the number is volume or value, how grades are grouped, and how trade and inventory movements are treated in the base year.
Another driver is refresh timing and currency timing, since acid prices can swing and a different averaging window can shift the implied market value even if volume is similar. The table spread is also explained by ASP logic, where some estimates apply a single global price and others separate wet-process versus thermal routes and fertilizer-grade versus higher purity uses, followed by validation checks that keep the totals tied to production and trade signals, which is the approach used in Mordor Intelligence.
Benchmark comparison
| Source | Market Size | Gaps in Research Methodology |
|---|---|---|
| Mordor Intelligence | USD 100.76 M (2026) | |
| Global Consultancy A | USD 45.80 B (2025) | This figure is value-based, so it depends heavily on the assumed average selling price and the currency averaging window, which can differ by region and contract mix. It also appears to use a different base year and may not align volume definitions across grades, making direct comparison to a volume-led estimate uneven. |
| Industry Publisher B | USD 54.21 B (2025) | The estimate is reported as revenue and can move materially based on whether fertilizer-grade pricing is blended with higher purity grades and how spot versus contract realizations are handled. Differences in refresh cadence and regional price weighting can also widen the gap even when underlying production and trade volumes are similar. |
Reading the three numbers together, the practical takeaway is that most divergence is created by units and pricing treatment, not only by demand direction. When the scope is kept consistent and the model is repeatedly checked against production, trade, and utilization signals, decision makers get a market view that is easier to track and update year to year.


Key Questions Answered in the Report
How large is the phosphoric acid market in 2026?
The phosphoric acid market size stands at 100.76 million tons in 2026.
What is the expected CAGR for global phosphoric acid demand through 2031?
Demand is forecast to register a 4.25% CAGR from 2026 to 2031.
Which grade shows the fastest growth through the forecast horizon?
Food-grade phosphoric acid is projected to expand at 4.59% CAGR through 2031.
Which region accounts for the bulk of phosphoric acid consumption?
Asia-Pacific leads with 55.97% of 2025 volumes and remains the fastest-growing region.
How are recycling trends affecting future phosphoric acid supply?
Closed-loop recovery from LiFePO₄ batteries could reach 10% of global output by 2031, easing reliance on mined phosphate rock.
Page last updated on:


 Your data is secure and never sold or shared.


