
Stearic Acid Market Size and Share
Market Overview
| Study Period | 2020 - 2031 |
|---|---|
| Market Volume (2026) | 10.51 Million tons |
| Market Volume (2031) | 13.59 Million tons |
| Growth Rate (2026 - 2031) | 5.31 % |
| Fastest Growing Market | Asia Pacific |
| Largest Market | Asia Pacific |
| Market Concentration | Medium |
Major Players *Disclaimer: Major Players sorted in no particular order Image © Mordor Intelligence. Reuse requires attribution under CC BY 4.0. | |
Stearic Acid Market Analysis by Mordor Intelligence
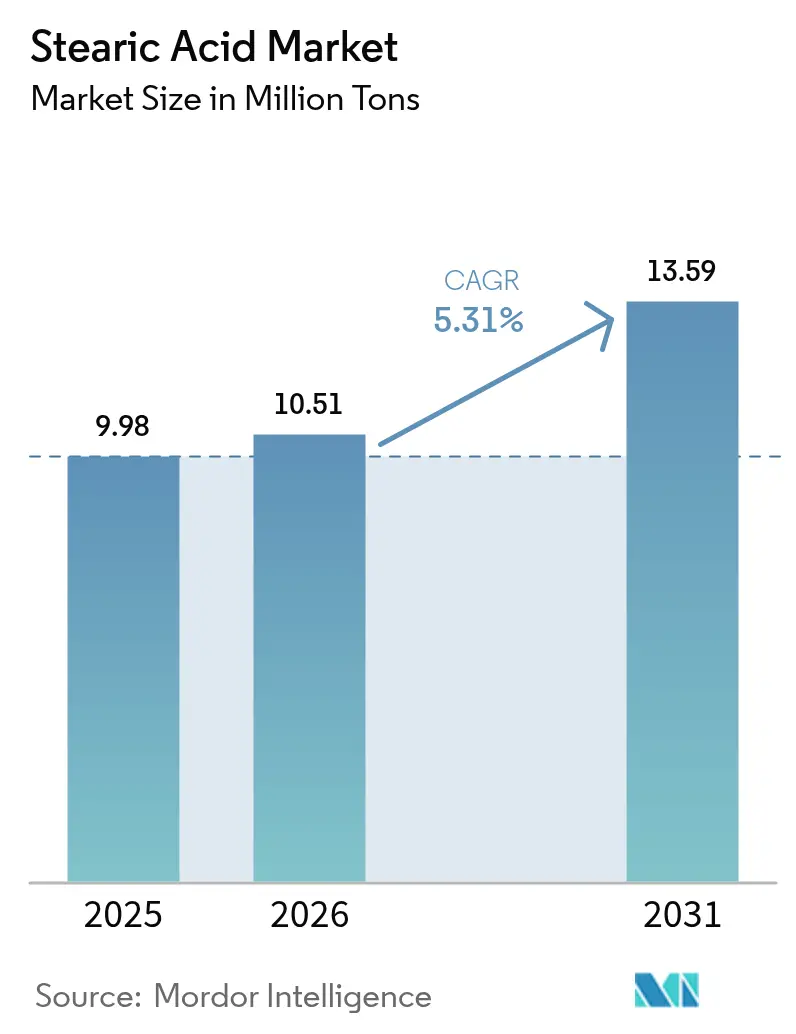
The Stearic Acid Market size was valued at 9.98 Million tons in 2025 and estimated to grow from 10.51 Million tons in 2026 to reach 13.59 Million tons by 2031, at a CAGR of 5.31% during the forecast period (2026-2031). Rising use in premium personal-care products, biodegradable plastics, and specialized lubricants anchors demand, while integrated palm-oil supply chains in Southeast Asia keep production costs relatively competitive. Manufacturers escalate capacity in Indonesia, Malaysia, and Thailand to secure feedstock and shorten lead times to export markets Sustainability mandates accelerate the pivot to vegetable-based inputs that meet Roundtable on Sustainable Palm Oil (RSPO) certification, reshaping global procurement models. Premium cosmetic and pharmaceutical grades register the quickest uptake as consumers pay for traceable and high-purity ingredients. At the same time, upstream volatility in palm-oil and tallow prices adds cost pressure, encouraging producers to diversify raw-material portfolios and adopt energy-efficient enzymatic technologies.
Key Report Takeaways
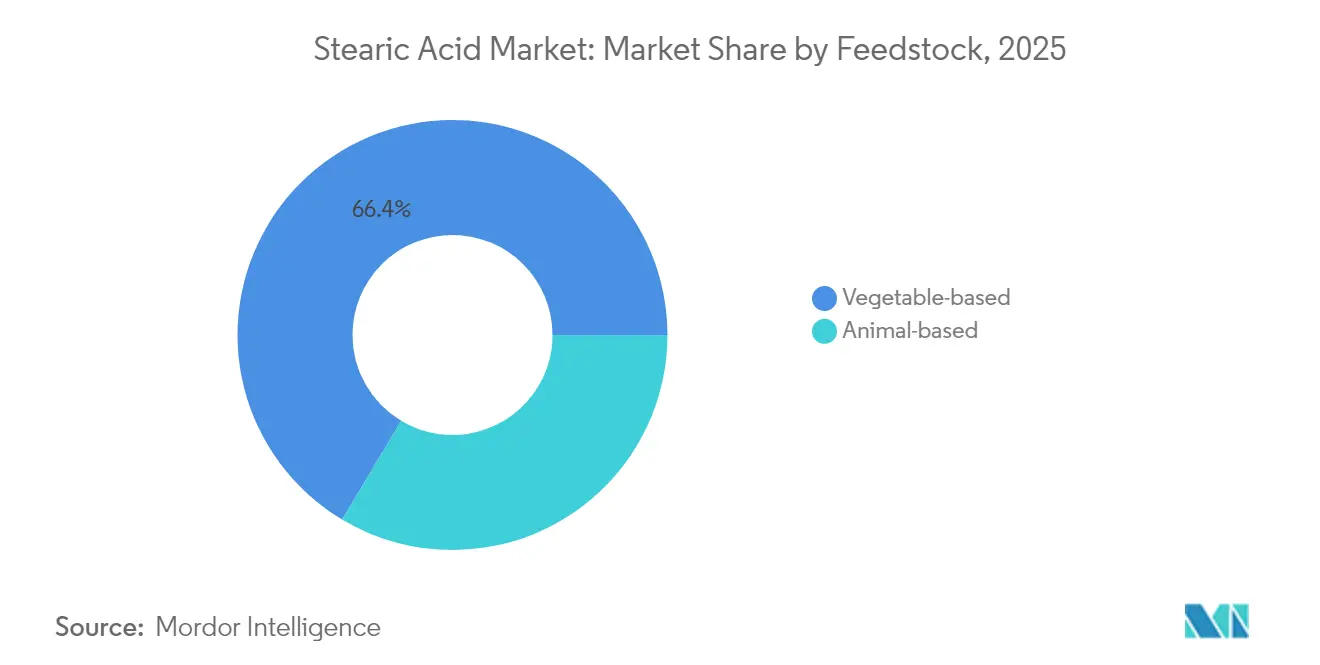
- By feedstock, vegetable-based sources captured 66.42% of stearic acid market share in 2025 and is forecast to expand at 5.47% CAGR to 2031.
- By grade, triple-pressed material led with 45.62% stearic acid market share in 2025, whereas cosmetic- and pharma-grade volumes are forecast to expand at 8.05% CAGR to 2031.
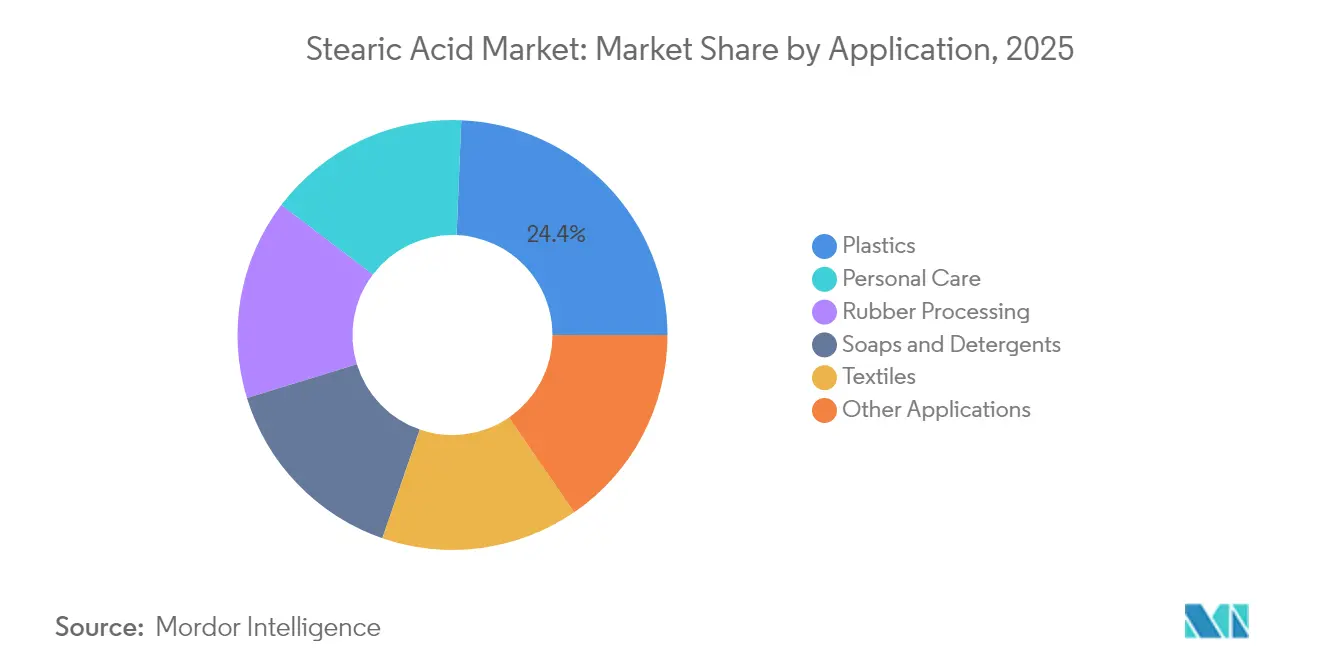
- By application, plastics commanded 24.35% of the stearic acid market size in 2025; personal-care uses are projected to advance at 8.33% CAGR through 2031.
- By geography, Asia-Pacific held 71.78% stearic acid market share in 2025, and the region is projected to grow at 5.69% CAGR to 2031.
Note: Market size and forecast figures in this report are generated using Mordor Intelligence’s proprietary estimation framework, updated with the latest available data and insights as of 2026.
Market Trends and Insights
Drivers Impact Analysis of Stearic Acid Market*
| Driver | (~) % Impact on CAGR Forecast | Geographic Relevance | Impact Timeline |
|---|---|---|---|
| Growth of Personal-Care Ingredients Demand | +1.2% | Global, with concentration in North America and EU premium segments | Medium term (2-4 years) |
| Expansion of Global Detergents Sector | +0.9% | APAC core, spill-over to MEA and Latin America | Long term (≥ 4 years) |
| Capacity Additions by Southeast-Asian Oleochemical Plants | +1.1% | APAC concentrated, with export benefits to global markets | Short term (≤ 2 years) |
| Shift Toward RSPO-Certified Palm Stearin Feedstocks | +0.8% | Global, with early adoption in EU and North America | Medium term (2-4 years) |
| Rapid Scale-Up of 3-D-Printed Biodegradable Plastics Using Stearic-Acid Lubricants | +0.6% | North America and EU innovation hubs, scaling to APAC | Long term (≥ 4 years) |
| Source: Mordor Intelligence | |||
Growth of Personal-Care Ingredients Demand
Clean-label trends drive strong uptake of high-purity stearic acid grades. BASF’s climate-adaptive beauty portfolio showcases renewable emulsifiers that illustrate how personal-care formulators substitute petrochemical waxes with vegetable-based fatty acids[1]BASF, “Climate-Adaptive Beauty at Cosmet’Agora 2025,” basf.com. Ingredient developers such as SMIngredients promote stearic-acid derivatives that allow “vegetable oil powder” labelling, widening acceptance in nutraceutical tablets. Multinationals secure certified supply chains; Kao achieved 87% traceability to plantation level in 2024, lowering deforestation risks and reassuring premium consumers. The US FDA’s GRAS affirmation continues to underpin confidence in cosmetic and topical use. Together these factors lock in volume growth for cosmetic- and pharma-grade material within the stearic acid market.
Expansion of Global Detergents Sector
Household-laundry growth in emerging economies elevates soap and surfactant demand. Asia-Pacific remains the largest detergent market by volume, supported by rising urbanization and disposable incomes. New sulfonation capacity in the Philippines adds 40,000 t annual supply of detergent intermediates, increasing regional pull for fatty-acid raw materials. Premium detergent formats that promise fabric care and fragrance longevity incorporate higher stearic acid loadings, lifting value per ton. The stearic acid market benefits further as brand owners replace petroleum-based surfactants with bio-based alternatives to gain “green” shelf appeal. Over the long run, the detergents driver secures predictable baseline consumption, especially for triple-pressed grades.
Capacity Additions by Southeast-Asian Oleochemical Plants
New investments across Indonesia, Malaysia, Thailand, and India shorten supply cycles and lower freight costs to global customers. Godrej Industries earmarked INR 600 crore to boost its Gujarat oleochemical complex, adding jobs and enhancing specialty downstream capabilities. Braskem Siam received approval for a 200,000 t bio-ethylene unit in Thailand that integrates with regional fatty-acid chains. These projects improve economies of scale, helping the stearic acid market maintain competitive pricing even when feedstock costs rise. Export-oriented plants also gain from ASEAN free-trade agreements that cut tariff barriers into high-value North American and European applications.
Shift Toward RSPO-Certified Palm Stearin Feedstocks
Brand commitments to deforestation-free sourcing accelerate certified-feedstock adoption. AAK verified 83% of its palm supply as deforestation-free and achieved 93% traceability to plantation in 2024. Downstream processors such as Stephenson Personal Care buy only sustainable palm derivatives, influencing purchase decisions deep into the value chain. The RSPO Shared Responsibility Scorecard tracks nearly 1,900 organizations, adding public accountability that nudges late adopters. Although certification premiums compress margins, access to sustainability-focused buyers compensates via higher volumes and longer-term contracts, sustaining growth within the stearic acid market.
Restraints Impact Analysis of Stearic Acid Market*
| Restraint | (~) % Impact on CAGR Forecast | Geographic Relevance | Impact Timeline |
|---|---|---|---|
| Volatility in Tallow and Palm Oil Prices | -1.4% | Global, with acute impact in import-dependent regions | Short term (≤ 2 years) |
| ESG-Driven Capital Flight from Palm-Based Supply Chains | -0.7% | EU and North America leading, spreading to APAC | Medium term (2-4 years) |
| Toxicity Concerns at High Concentrations | -0.6% | EU and North America regulatory focus, spreading globally | Medium term (2-4 years) |
| Source: Mordor Intelligence | |||
Volatility in Tallow and Palm-Oil Prices
Palm-oil futures hover between MYR 4,000 and 4,600 per t through early 2025 as tight supply meets biodiesel mandates in Indonesia and Malaysia. Similar swings in tallow and used-cooking-oil values arise as biofuel producers compete for feedstock, eroding oleochemical margins. Freight-rate fluctuations compound cost unpredictability; the FAO vegetable-oil index fell in April 2025 while ocean-shipping prices also declined. Stearic acid producers struggle to hedge because post-COVID correlations between crude, soybean, and palm prices weakened, reducing forecast accuracy. Elevated raw-material risk restricts spot-market buying and delays downstream project launches, restraining the stearic acid market.
ESG-Driven Capital Flight from Palm-Based Supply Chains
Institutional investors tighten screening for deforestation exposure, raising the cost of capital for processors relying strictly on palm derivatives. EU regulations that ban additional substances in cosmetics from September 2025 signal tougher scrutiny on ingredient provenance. Brand owners pledge full traceability by 2030, forcing suppliers to finance digital monitoring and independent audits. Some venture capital shifts toward fermentation start-ups such as C16 Biosciences that “brew” palm-oil substitutes, diverting funds from traditional refineries. While commercial scale remains distant, negative investor sentiment can delay brown-field upgrades essential for energy efficiency, weighing on long-term capacity growth within the stearic acid market.
*Our forecasts treat driver/restraint impacts as directional, not additive. The impact forecasts reflect baseline growth, mix effects, and variable interactions.
Stearic Acid Market Segment Analysis
By Feedstock:
Vegetable Sources Drive Sustainability TransitionVegetable-based inputs held 66.42% share of the stearic acid market in 2025, and volumes are forecast to rise at 5.47% CAGR through 2031 as major producers double down on RSPO-certified palm stearin. The stearic acid market size for vegetable feedstock is projected to grow by 2.45 million tons over the forecast, outpacing animal-fat counterparts. Integrated processors in Malaysia and Indonesia leverage contiguous plantations, refineries, and oleochemical units to minimize logistics costs while ensuring traceability. Enzymatic esterification developed by thyssenkrupp Uhde and Novonesis cuts energy use by 60%, enhancing sustainability credentials.
Animal-based routes, historically dominant in rubber additives, face image challenges over traceability and disease risk. Yet they retain niche relevance in applications requiring specific chain-length distributions and in regions where tallow is readily available from rendering industries. Regulatory tightening on veterinary drug residues could limit further share loss, but uptake will stay modest. As fermentation-based lipids mature, the stearic acid industry may witness a broader diversification of feedstock in the next decade, though commercial volumes remain limited today.



By Grade:
Premium Segments Capture Value MigrationTriple-pressed material accounted for 45.62% of the stearic acid market in 2025 and remains the workhorse for soap and detergent compounding due to its consistent acid value and color profile. Cosmetic- and pharma-grade stearic acid deliver the fastest revenue lift, with an 8.05% CAGR expected through 2031 as premium personal-care brands demand low-impurity inputs and hypoallergenic profiles. Producers invest in fractionation, hydrogenation, and high-vacuum distillation to achieve iodine values below 0.5 and meet pharmacopeia specifications.
Rubber grade stays integral to tire and hose manufacturing, acting as a dispersing aid for zinc oxide-an essential activator in vulcanization reactions. Food-grade volumes benefit from the US FDA GRAS status that covers flavor and glazing uses. The stearic acid market size commanded by premium grades is forecast to double by 2031 as nutraceutical tablets, ophthalmic ointments, and plant-based margarines ramp up. This value migration supports producers’ margin resilience despite raw-material price swings.
By Application:
Plastics Leadership Meets Personal-Care DynamismWith 24.35% share in 2025, plastics remain the largest outlet for stearic-acid use, notably in PVC where it functions as both internal and external lubricant to lower melt viscosity and improve surface gloss. Rising interest in biodegradable polymers reinforces demand because vegetable-based stearic acid aligns with end-of-life compostability claims. Personal-care formulations, however, show the highest pace, expanding at 8.33% CAGR to 2031 as consumers prefer plant-derived emulsifiers over synthetic waxes. The stearic acid market size for personal-care uses is projected to reach 2.28 million tons by 2031, reflecting widespread adoption in creams, sticks, and wipes.
Traditional soap and detergent applications continue to provide steady baseline volumes, particularly in populous Asian markets. Rubber processing absorbs steady tonnage for auto and industrial goods, while textile and metal-cleaning sectors explore bio-based lubricants that replace mineral-oil analogues. Niche growth arises from sustainable candles that use RSPO-certified stearin, improving burn time and fragrance throw. Overall, application diversification bolsters the resilience of the stearic acid market against single-sector downturns.
Geography Analysis
APAC Stearic Acid Market
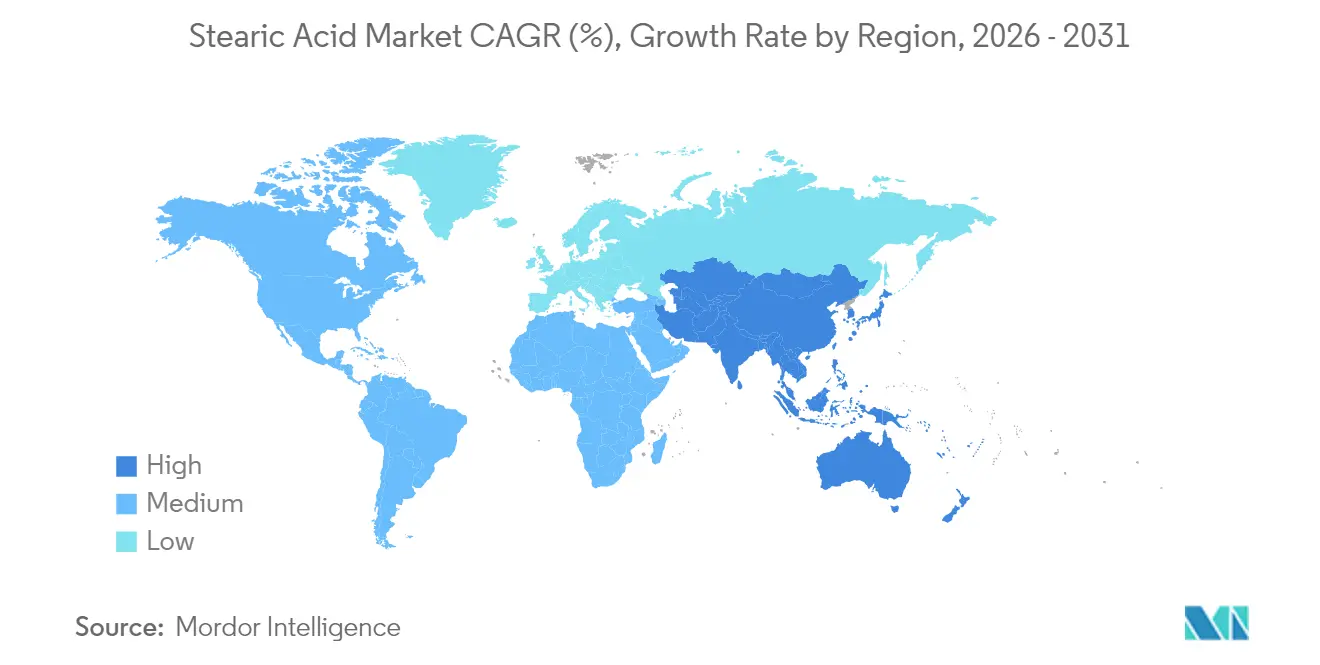
Asia-Pacific dominated the stearic acid market in 2025 with 71.78% share and is forecast to grow at 5.69% CAGR to 2031 as regional governments prioritize specialty-chemical value addition. Malaysia’s Chemical Industry Roadmap targets a 4.5% contribution to national GDP by 2030, supporting capacity upgrades and technology adoption across its oleochemical cluster. Indonesia’s push toward B40 biodiesel increases local palm-oil demand, lifting feedstock prices but also encouraging refinery downstream integration that benefits fatty-acid output.
North America and Europe Stearic Acid Market
North America ranks as a premium buyer base, driven by strict FDA compliance and consumer readiness to pay for certified inputs. Investments in precision-fermentation lipids promise future local supply, but today the region depends on imports from Southeast Asia for both commodity and high-grade material. Europe maintains a sustainability-led market environment. The stearic acid market size in the EU grows modestly yet consistently as cosmetics and food regulators tighten purity and traceability demands, creating a market for high-margin certified grades.
South America and MEA Stearic Acid Market
South America and the Middle-East and Africa are emerging growth territories. Brazil’s large agro-industrial base underpins domestic fatty-acid ester capacity, positioning the country to substitute imports in plastics and detergents. In the Gulf, new petrochemical parks integrate oleochemical trains that use imported palm stearin, capturing regional detergent demand. Rising urban populations, higher per-capita income, and supportive investment incentives make these geographies attractive for second-wave expansion in the stearic acid market.

Value Chain Analysis
The stearic acid value chain begins with triglyceride feedstocks, primarily palm-derived streams (including palm stearin and related fractions) and animal tallow, where feedstock costs account for most margin volatility. These inputs move through milling and refining, then into oleochemical conversion (fat splitting or hydrolysis to fatty acids, fractionation, hydrogenation, and finishing steps such as distillation and flaking or prilling) to produce industrial, triple-pressed, and higher-purity cosmetic or pharma grades.
Vertically integrated groups such as Wilmar International, KLK OLEO, and IOI Oleochemical cover feedstock sourcing, refining, and downstream fatty-acid derivatives, while other players use a mix of tolling, spot procurement, and long-term contracts to manage exposure to palm-oil and tallow price swings. Downstream, producers supply large soap and detergent manufacturers, plastics (including PVC additives), rubber processors, and personal-care formulators, as well as specialty chemical distributors that consolidate lots, manage quality documentation, and support import logistics for smaller buyers. Logistics and trade execution remain a key constraint because production is concentrated in Southeast Asia, making delivery reliability dependent on container availability, port throughput, and weather-driven shipping disruptions. RSPO-linked procurement and other certification and traceability requirements increasingly sit in the commercial and documentation layer of the chain, affecting supplier qualification, pricing structures, and the ability to win longer-duration supply agreements with multinational customers.
Competitive Landscape
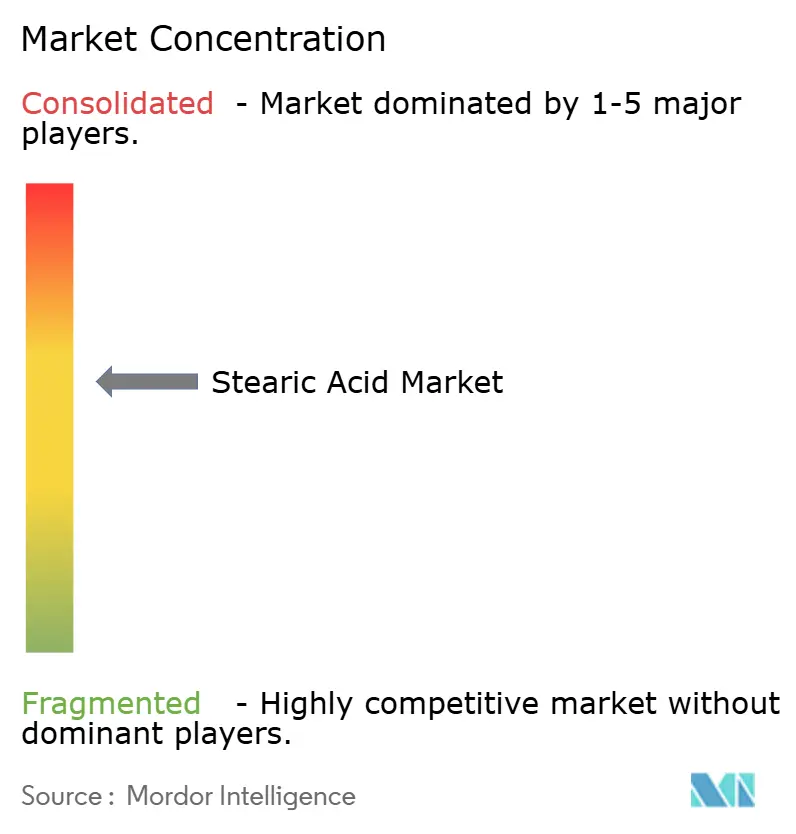
The stearic acid market is moderately consolidated. Top integrated players such as KLK, IOI, and Wilmar International secure scale advantages by controlling plantations, crushing, refining, and fatty-acid derivatization[2]KLK, “Sustainability Report 2025,” klk.com. Their vertically-linked models shelter margins against feedstock spikes and ensure delivery reliability to multinational customers who demand RSPO compliance. Mid-sized specialists focus on high-purity grades and geographic niches; for instance, Oleon added enzymatic lines in 2024 that cut reaction temperatures and shrink carbon footprints.
Strategic moves concentrate on sustainability and value-added derivatives. Wilmar’s introduction of transparent blockchain traceability in 2025 strengthens relationships with personal-care majors that now require granular proof of origin. Braskem Siam’s planned bio-ethylene plant pairs olefins with fatty acids, creating integrated green-plastic ecosystems in Thailand. Precision-fermentation innovators remain technological challengers; however, commercial output is unlikely to reach mass scale before 2030, giving incumbents time to enhance ESG credentials and adopt low-energy processes. Mergers and acquisitions target downstream capabilities in candles, metal cleaning, and 3D-printing additives, signalling a pivot toward specialty markets that defend margins.
Stearic Acid Industry Leaders
Wilmar International Ltd
Emery Oleochemicals
KLK OLEO
BASF SE
IOI Oleochemical
- *Disclaimer: Major Players sorted in no particular order
Stearic Acid Market Companies Covered in this Report
- 3F Industries Ltd
- Acme-Hardesty
- Adani Wilmar Ltd
- BASF SE
- Croda International Plc
- Emery Oleochemicals
- Godrej Industries Limited
- IOI Oleochemical
- Kao Corporation
- KLK OLEO
- New Japan Chemical Co. Ltd
- Oleon NV
- Pacific Oleochemicals Sdn Bhd
- Procter and Gamble
- PT SMART Tbk
- Twin Rivers Technologies, Inc.
- VVF Ltd
- Wilmar International Ltd

Market Opportunities and Future Outlook
The clearest opportunities sit in higher-margin grades where buyers require low-impurity inputs, tight lot-to-lot consistency, and auditable sourcing. Cosmetic and pharma-grade demand is supported by clean-label personal-care formulations and pharma excipient use cases, and by procurement shifts toward transparency-focused partnerships that include carbon-footprint and traceability information. Producers that combine RSPO-aligned sourcing with process upgrades such as energy-efficient enzymatic technologies and structured quality systems are positioned to capture value migration, while distributors and traders with strong documentation capabilities can reach smaller formulators that may not manage multi-origin qualification.
At the supply level, the near-term gap appears in debottlenecking and integration around Asian oleochemical hubs that shorten lead times to export markets and improve resilience to feedstock and freight shocks. Capacity actions across the wider palm and oleochemical ecosystem, including Apical’s expansion activity in Indonesia (Padang) and KLK Oleochemicals’ capacity expansion at Taiko Palm-Oleo (Zhangjiagang, China, to 500,000 tonnes annual processing capacity), indicate continued investment tied to downstream value addition along fatty-acid chains. On the demand side, stearic-acid use in biodegradable plastics and specialized lubricants, plus expansion of sustainability-focused candle waxes and metal-cleaning lubricants, creates room for tailored C16/C18 cuts and additive-grade performance packages where technical service and application development can support differentiation beyond commodity pricing.
Recent Industry Developments in Stearic Acid Market
- June 2026: Stearic acid pricing in the United States stayed flat in the latter half of June even as palm oil feedstock costs eased. The disconnect between feedstock movement and downstream prices pointed to tighter negotiation dynamics and contract pricing behavior, shaping near-term buying strategies for import-dependent consumers.
- November 2025: IOI Oleochemical reported a return to positive core EBIT margins in its downstream division in 1QFY26 after losses in 4QFY25. The margin swing highlighted how quickly profitability can change with utilization, product mix, and pricing discipline across Southeast Asian oleochemical chains supplying stearic acid and related derivatives.
- July 2024: Adani Wilmar Ltd acquired a 67% stake in specialty chemical manufacturer Omkar Chemicals. The transaction strengthened Adani Wilmar’s position in specialty ingredients used across home and personal care, polymers, pharmaceuticals, and industrial applications where stearic acid and related fatty-acid derivatives are key inputs.


Stearic Acid Market Report Scope and Research Methodology
Market Definition and Coverage
For this study, the market covers stearic acid sold into end-use applications, regardless of whether it is made from animal-based or vegetable-based feedstock, and tracked across major consuming regions.
Scope exclusions: This sizing does not count upstream fats and oils, mixed fatty acid streams sold without stearic acid separation, or downstream finished consumer products that only use stearic acid as an ingredient.
Segments Covered in This Report
- By Feedstock
- Animal-based
- Vegetable-based
- By Grade
- Triple-Pressed Stearic Acid
- Rubber-Grade Stearic Acid
- Food-Grade Stearic Acid
- Cosmetic-/Pharma-Grade Stearic Acid
- By Application
- Soaps and Detergents
- Personal Care
- Plastics
- Rubber Processing
- Textiles
- Other Applications
- By Geography
- Asia-Pacific
- China
- India
- Japan
- South Korea
- Rest of Asia-Pacific
- North America
- United States
- Canada
- Mexico
- Europe
- Germany
- United Kingdom
- France
- Italy
- Rest of Europe
- South America
- Brazil
- Argentina
- Rest of South America
- Middle-East and Africa
- Saudi Arabia
- South Africa
- Rest of Middle-East and Africa
- Asia-Pacific
Data Sources, Market Sizing, and Validation
Desk Research
Desk research was used to set the boundary of the market and to build a reliable starting point for supply, demand, and trade signals. We referenced public sources such as USGS and other national statistical agencies for chemical and industrial output cues, UN Comtrade and customs portals for import and export patterns, and FAO for upstream oils and fats context that affects availability.
To tighten the model, we also used sources such as industry and oleochemical association publications, peer-reviewed journals on fatty acid processing and specifications, and company annual reports and investor presentations for capacity notes and utilization commentary. In a few places, paid subscriptions for company financials and news and financials helped confirm plant announcements and timing. Patent databases were also used to validate process changes that could affect yield and product mix. These examples are not exhaustive, and many other public and subscription sources were used for data collection, validation, and clarification.
Primary Interviews and Surveys
Primary work focused on checking what is actually being produced and consumed, and how pricing and specifications move by region and end-use. We spoke with a mix of producers, distributors, and buyers from key application areas like soaps and detergents, rubber and plastics, and personal care, which helped close gaps that desk research cannot fully explain.
Inputs from these discussions were used to verify trade flow logic, typical grade splits, and the realistic pace of demand changes in APAC, EMEA, and the Americas, then to confirm whether model assumptions still held when market conditions shifted.
Distribution of primary research fieldwork respondents
| Company type | Respondent position | Region |
|---|---|---|
| Top tier: 35% | CXOs: 19% | APAC: 43% |
| Mid tier: 46% | Functional/Unit leaders: 27% | EMEA: 30% |
| Smaller Players: 19% | Managers: 54% | Americas: 27% |
Market-Sizing & Forecasting
Sizing was built using a top-down and bottom-up approach, where regional demand was first reconstructed from end-use consumption indicators and trade-adjusted availability, then cross-checked against selective supplier roll-ups. In practice, the top-down layer leaned on signals like soaps and detergents output, rubber compounding activity, and personal care manufacturing trends, which are then translated into stearic acid demand using application-level intensity assumptions.
On the model side, a few inputs mattered most: feedstock availability and price direction (animal fat and vegetable oil), capacity additions and utilization at key plants, grade mix shifts tied to end-use standards, and import and export movements that re-balance regional supply. Where bottom-up company approximations had gaps, we used a coverage factor based on known capacity, shipment routes, and distribution reach, then adjusted it only when interviews supported the change.
For forecasting, scenario analysis was used so the outlook could reflect different paths for feedstock pricing, capacity ramp-ups, and demand in core applications. Assumptions were refreshed with expert feedback, and the final forecast was kept consistent with observable demand signals rather than a purely trend-based extension.
Data Validation & Update Cycle
Outputs were validated by comparing results against independent checks such as import dependence by region, plausible utilization ranges, and whether implied consumption aligns with end-use production trends. When a variance looked too large, the underlying drivers were revisited, and follow-up questions were sent back to the market to confirm what changed and when.
Before sign-off, the model and its assumptions go through a multi-step review so that unit conversions, currency treatment (where relevant), and regional allocations remain consistent. Reports are refreshed annually, with interim updates when material events occur such as capacity changes or sharp feedstock swings. Right before delivery, a final analyst pass is done to ensure the latest public releases and confirmed industry updates are reflected.
Mordor Intelligence's Stearic Acid Market Size Versus Other Published Estimates
Published market sizes for stearic acid can differ quite a lot because the market boundary is not always treated the same way, and the unit of measure can also change the story. Some sources size the market in value terms, while others focus on physical volume, which makes the numbers look far apart even when the underlying demand pool is similar.
By tracking trade-adjusted volume (in tons) and then checking grade and end-use intensity assumptions through interviews, Mordor Intelligence keeps the estimate anchored to measurable supply and consumption signals instead of mixing in upstream oils or downstream finished products.
Benchmark comparison
| Source | Market Size | Gaps in Research Methodology |
|---|---|---|
| Mordor Intelligence | USD 10.51 M (2026) | |
| Industry Research House A | USD 12.32 B (2024) | This estimate is value-based and may include broader stearic acids pricing assumptions and application coverage, which can inflate totals versus a tonnage model, especially when ASPs are elevated. |
| Business Research Publisher B | USD 13.26 B (2025) | This estimate appears to focus on revenue with a base year tied to a different pricing cycle, and it can also differ on what is counted as stearic acid versus blended fatty acid products. |
The spread in the table is mainly explained by unit choice and boundary decisions. Revenue models are sensitive to ASP timing and to what adjacent fatty acids are bundled into scope, so totals can diverge even when tonnage demand is similar. Using clear inclusion rules and demand-linked checks keeps the result repeatable, which helps users reconcile differences when comparing volume-led and value-led estimates.


Key Questions Answered in the Report
What is the current size of the stearic acid market?
The stearic acid market size reached 10.51 million tons in 2026 and is forecast to rise to 13.59 million tons by 2031.
Which region dominates stearic acid production?
Asia-Pacific holds 71.78% share owing to integrated palm-oil infrastructure and rapid capacity expansion in Malaysia, Indonesia, Thailand, and India.
Which application segment is growing the fastest?
Personal-care formulations show the quickest trajectory at 8.33% CAGR as brands pursue clean-label emulsifiers and certified supply chains.
How are sustainability trends influencing feedstock choices?
Vegetable-based, RSPO-certified palm stearin already supplies 66.42% of global volume and continues to gain share as buyers enforce deforestation-free sourcing.
What technological advances are shaping the competitive landscape?
Energy-saving enzymatic esterification and blockchain-enabled traceability help producers reduce carbon footprints while meeting brand-owner transparency requirements.
Page last updated on:


 Your data is secure and never sold or shared.


