Africa Data Center Market Size and Share
Market Overview
| Study Period | 2020 - 2031 |
|---|---|
| Forecast Data Period | 2026 - 2031 |
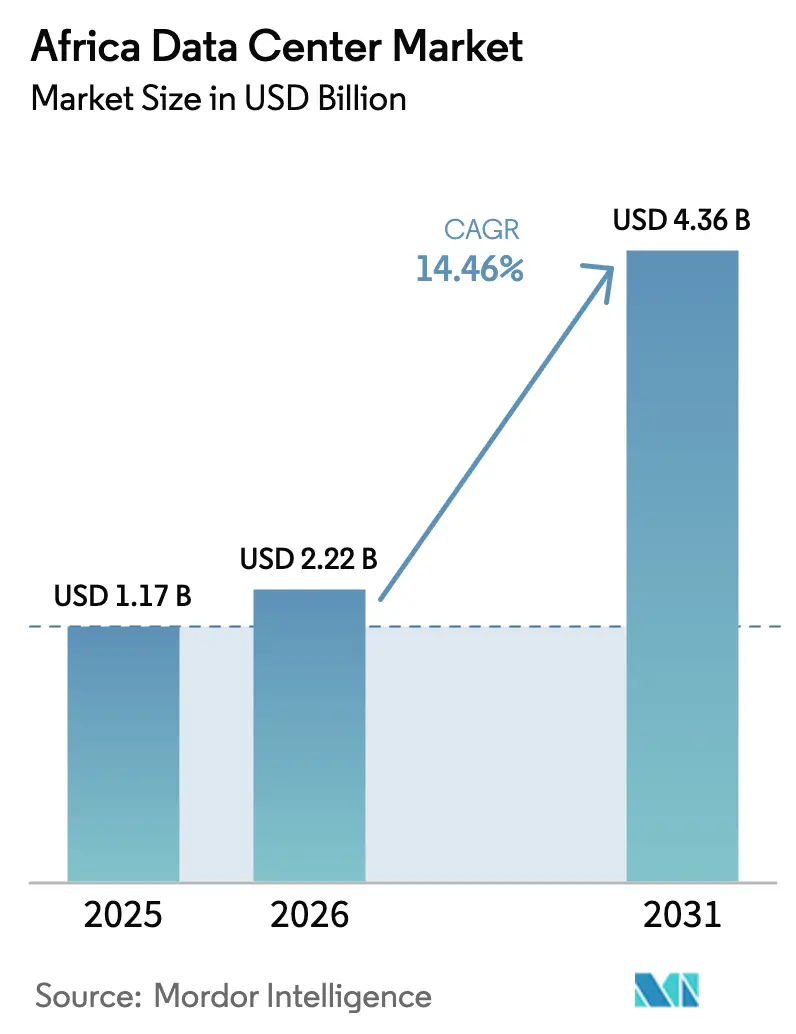
| Base Year Market Size (2025) | USD 1.17 Billion |
| Market Size (2026) | USD 2.22 Billion |
| Market Size (2031) | USD 4.36 Billion |
| Growth Rate (2026 - 2031) | 14.46% CAGR |
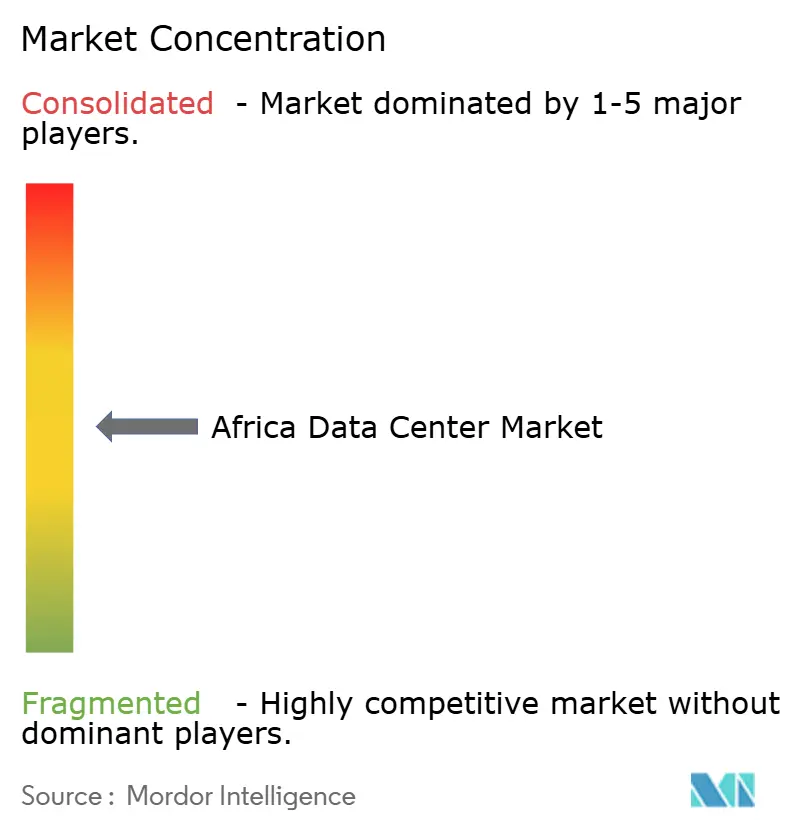
| Market Concentration | Medium |
Major Players *Disclaimer: Major Players sorted in no particular order Image © Mordor Intelligence. Reuse requires attribution under CC BY 4.0. | |
Africa Data Center Market Analysis by Mordor Intelligence
The Africa Data Center Market size was valued at USD 1.94 billion in 2025 and estimated to grow from USD 2.22 billion in 2026 to reach USD 4.36 billion by 2031, at a CAGR of 14.46% during the forecast period (2026-2031). In terms of IT load capacity, the market is expected to grow from 1.17 thousand megawatt in 2025 to 3.46 thousand megawatt by 2030, at a CAGR of 24.29% during the forecast period (2025-2030). The market segment shares and estimates are calculated and reported in terms of MW. The surge reflects a strategic pivot by enterprises and governments toward sovereign hosting, backed by subsea cable additions, 5G rollouts, and assertive data-residency rules, all of which lower latency and improve compliance economics for early movers in the Africa data center market. The investment up-cycle accelerates because grid constraints, once a deterrent, now favor operators that can bundle renewable power and compliance expertise. Demand also benefits from cloud-first mandates, growing fintech ecosystems, and renewable-powered campuses that lower total cost of ownership. Competition centers on energy sourcing, skilled labor, and regulatory navigation rather than sheer floor space, driving mergers and partnerships that consolidate fragmented local capacity into region-spanning platforms across the Africa data center market.
Key Report Takeaways
- By data center type, colocation captured 85.05% revenue share in 2025; hyperscale and self-built facilities are projected to advance at a 25.02% CAGR through 2031.
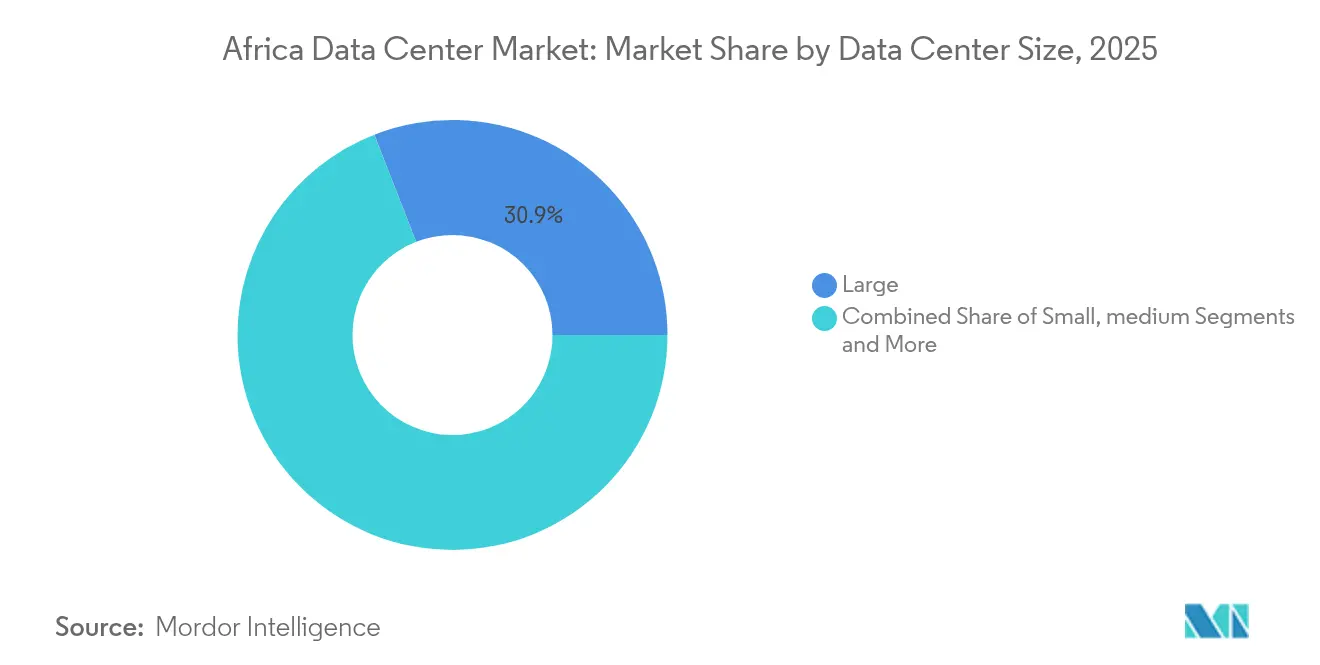
- By data center size, large facilities accounted for 30.92% of the Africa data center market size in 2025 and are expected to grow at a 24.12% CAGR during 2026-2031.
- By end-user industry, IT and telecom held a 57.88% share of the Africa data center market size in 2025, whereas BFSI is progressing at a 24.77% CAGR over the same span.
- By tier standard, Tier 3 facilities represented 57.92% of the Africa data center market size in 2025, while Tier 4 is expected to register the fastest growth at a 24.05% CAGR to 2031.
- By geography, South Africa led the Africa data center market share with 40.76% in 2025, while the Rest of Africa segment is forecasted to expand at a 26.04% CAGR through 2031.
Note: Market size and forecast figures in this report are generated using Mordor Intelligence’s proprietary estimation framework, updated with the latest available data and insights as of 2026.
Africa Data Center Market Trends and Insights
Drivers Impact Analysis*
| Driver | (~) % Impact on CAGR Forecast | Geographic Relevance | Impact Timeline |
|---|---|---|---|
| Rapid rollout of 5G and national backbone fibre projects | +4.2% | South Africa, Nigeria, Kenya, Ghana, Tanzania | Medium term (2-4 years) |
| Spiralling cloud-first digital transformation among African enterprises | +5.8% | Major urban and financial hubs across Africa | Short term (≤ 2 years) |
| Rising subsea cable landings boosting international bandwidth supply | +3.9% | South Africa, Nigeria, Kenya, Ghana, Senegal, Morocco | Long term (≥ 4 years) |
| Government data-sovereignty legislation driving in-country hosting | +4.7% | Nigeria, South Africa, Kenya, Ghana, Rwanda | Medium term (2-4 years) |
| Surging venture-capital and infrastructure-fund inflows | +3.1% | South Africa, Nigeria, Kenya, Ghana, Rwanda | Short term (≤ 2 years) |
| Emergence of green-hydrogen and renewable-powered campuses | +2.8% | South Africa, Morocco, Kenya, Nigeria, Ghana | Long term (≥ 4 years) |
| Source: Mordor Intelligence | |||


Spiralling Cloud-First Digital Transformation
Corporate cloud spending in Africa is growing 25-30% each year, forcing enterprises to blend international hyperscale capacity with local colocation for low-latency workloads.[1]Digital Realty, “Bridging Continents: The Role of Connectivity in Africa’s Digital Transformation,” digitalrealty.com Government IT mandates that stipulate minimum local sourcing, such as Nigeria’s 40% threshold, accelerate migrations from on-premise rooms to carrier-neutral facilities. Financial institutions process more than 60% of transactions via cloud-native cores, yet regulatory ceilings on offshore storage require compliant in-country infrastructure. This hybrid imperative elevates interconnection rich data centers that can knit public cloud nodes to enterprise cages without hair-pinning traffic through Europe or North America. The resulting demand spike benefits operators whose campuses incorporate dark fiber to multiple cloud on-ramps and who can offer audited data-protection controls sought by BFSI clients.
Government Data-Sovereignty Legislation
Nigeria’s Data Protection Act 2023, South Africa’s Protection of Personal Information Act, and Kenya’s Data Protection Act collectively obligate sensitive data to remain within national borders.[2]DLA Piper, “Data Protection in Nigeria,” dlapiperdataprotection.com Multinationals categorised as Data Controllers of Major Importance must process personal records locally or risk penalties up to 2% of annual turnover, reshaping site-selection criteria from power price to legal compliance. Financial regulators stipulate that customer banking data reside domestically, guaranteeing a baseline load for Tier 3 and Tier 4 halls. Cross-border transfer restrictions fragment previously centralised architectures, compelling cloud providers to replicate zones across multiple African markets. Operators that can marshal legal, cybersecurity, and audit expertise alongside robust uptime become preferred partners as data-residency complexity deepens.
Rapid 5G and National Backbone Fibre Projects
Spectrum auctions in South Africa and Nigeria and the National Optic Fibre Backbone initiative in Kenya shorten round-trip latency expectations to single-digit milliseconds.[3]Digital Realty, “Bridging Continents: The Role of Connectivity in Africa’s Digital Transformation,” digitalrealty.com Edge workloads—from telemedicine to real-time stock trading—must therefore localise compute racks in city-proximate data halls. Operators respond by designing modular pods that can bolt on to existing campuses or deploy in micro-sites within shopping malls and industrial parks. This densification raises aggregate rack demand even as individual edge sites remain under 1 MW, creating a complementary-not-competitive relationship with hyperscale estates. Fibre expansion simultaneously alleviates backhaul bottlenecks, allowing seamless traffic hand-off between metro edge nodes and larger regional hubs.
Rising Subsea Cable Landings
The 45 000 km 2Africa system plus Google’s Equiano route inject 180 Tbps of capacity, slashing international bandwidth tariffs by up to 70% for coastal landing nations. Streaming, gaming, and social-media giants can now cache content locally, shifting peering economics in favour of neutral data centers positioned close to cable terminations in Lagos, Cape Town, and Mombasa. Telecom incumbents partner with colocation specialists to monetise beach-manhole real estate, while secondary coastal cities bid for ancillary landing points to capture spill-over hosting demand. Nonetheless, bandwidth abundance remains geography-skewed, causing inland markets to lag unless terrestrial fibre corridors catch up with submarine capacity.
Restraints Impact Analysis*
| Restraint | (~) % Impact on CAGR Forecast | Geographic Relevance | Impact Timeline |
|---|---|---|---|
| Chronic grid instability and reliance on diesel generators | -3.2% | Sub-Saharan Africa excluding South Africa, particularly Nigeria, Ghana, Kenya | Short term (≤ 2 years) |
| Limited domestic skilled workforce for critical facility operations | -1.6% | Continental Africa with acute shortages in Nigeria, Kenya, Ghana | Medium term (2-4 years) |
| High import tariffs and logistics costs for mission-critical equipment | -1.8% | Continental Africa, with highest impact in landlocked countries and markets with complex customs procedures | Short term (≤ 2 years) |
| Political and security risks in key growth corridors | -1.4% | Sahel region, parts of East Africa, with spillover effects on investor confidence across emerging markets | Long term (≥ 4 years) |
| Source: Mordor Intelligence | |||
Chronic Grid Instability
Outside South Africa, grid reliability hovers below 60%, compelling facilities to size diesel plants for continuous rather than standby use. Nigerian sites budget diesel for weeks-long power gaps, elevating energy to 55-65% of operating expense compared with 35-45% in mature markets. Frequent genset cycling escalates maintenance and emissions, challenging sustainability narratives and limiting hyperscale commitment until renewables scale. South Africa’s load-shedding schedule, although predictable, still obliges a 1:1 redundancy between grid and backup sources, doubling capital outlay for electrical infrastructure. Operators with captive solar, wind, or geothermal assets gain a structural cost edge as battery storage costs decline.
Limited Skilled Workforce
Only a few hundred engineers graduate annually with the electrical, mechanical, and cybersecurity skills needed for concurrently maintainable data center environments. To keep availability above 99.982%, many operators import expatriate teams, inflating personnel budgets and complicating localisation requirements embedded in investment incentives. High staff turnover and migration exacerbate knowledge loss, while Uptime Institute audits show human error still causes 70% of outages worldwide. In response, leading providers launch academy programs and partner with technical universities to widen the talent funnel, but returns remain several years off, perpetuating wage inflation for seasoned professionals.
*Our forecasts treat driver/restraint impacts as directional, not additive. The impact forecasts reflect baseline growth, mix effects, and variable interactions.
Segment Analysis
By Data Center Size: Large Facilities Drive Consolidation Trends
Large facilities commanded 30.92% of the Africa data center market size in 2025, evidencing customer preference for consolidated halls that streamline compliance audits and interconnection design. Economies of scale allow superior power usage efficiency, more fault-tolerant electrical topologies, and onsite renewable integration, lowering per-rack total cost of ownership. Enterprises facing stringent data-protection reviews prefer hosting critical workloads in campuses that can demonstrate ISO 27001 adherence and layered physical security, reducing due-diligence cycles. Moreover, capital availability from infrastructure funds enables large operators to pre-fit shells and delay internal build until anchor tenants sign, keeping utilisation aligned with demand spikes in the Africa data center market.
The growth trajectory remains steep, 24.12% CAGR, because greenfield megawatts under construction in Johannesburg, Lagos, and Nairobi pipeline directly into large-format halls. Medium-sized sites continue to appeal to regional enterprises that desire customised suites without megawatt-scale commitments. Small footprints, though still relevant for municipal e-government and branch office workloads, face upgrade pressure as regulations tighten uptime and security benchmarks. Massive and mega-scale builds, predominantly in South Africa, serve spill-over traffic from multinational cloud and content providers and act as landing pads for cross-continent interconnection fabrics.


By Tier Standard: Tier 3 Dominance Reflects Pragmatic Infrastructure Approach
Tier 3 halls made up 57.92% of the Africa data center market size in 2025, striking a pragmatic balance between redundancy and capital intensity. The 99.982% availability threshold satisfies most BFSI, telecom, and government procurement checklists while keeping project budgets within reach for local investors. Tier 3 certification also aligns with power-quality realities, as dual utility feeds or diverse substations remain impractical in many African metros. As a result, operators deploy N+1 topologies with modular power blocks that can evolve toward Tier 4 if grid resilience improves.
Tier 4 adoption is nevertheless accelerating at 24.05% CAGR, predominantly through hyperscale expansions that require concurrently maintainable systems and fault-tolerant electrical paths. Such facilities anchor regional cloud availability zones, attracting fintech and e-commerce platforms that need low-latency, in-country processing. Tier 1 and Tier 2 sites persist for content caching and disaster-recovery use cases but increasingly attract scrutiny from regulators, nudging owners to retrofit additional redundancy. The tier mix therefore mirrors a gradual up-shift in customer expectations as African digital economies mature.
By Data Center Type: Colocation Model Addresses Infrastructure Sharing Needs
Colocation captured 85.05% of 2025 revenue, underscoring customer appetite for shared environments that offload power, cooling, and staffing complexity. Carrier-neutral campuses permit enterprises to cross-connect with multiple network, cloud, and payment providers, supporting hybrid architectures central to modern IT roadmaps. Retail racks give small and medium enterprises a pay-as-you-grow pathway into professional hosting, while wholesale cages serve regional banks and content delivery networks that demand controlled layouts and predictable cost curves in the Africa data center market.
Hyperscale self-builds and dedicated shells are expanding at 25.02% CAGR underpinned by cloud majors seeking to align availability zones with data-sovereignty statutes. Enterprise edge footprints rise in tandem with 5G, but remain below 5 MW per city, complementing rather than cannibalising core colocation demand. Success now hinges on optimising used versus reserved power to avoid stranded capacity as build schedules try to stay ahead of explosive utilisation growth. Operators therefore favour phased fit-outs tied to anchor pre-leases, maintaining balance sheets without sacrificing speed-to-market.

By End User Industry: Financial Services Drive Compliance-Focused Growth
IT and telecom organisations retained a 57.88% leadership share in 2025 because network backhaul, mobile-app back ends, and core routing nodes have long relied on carrier-neutral facilities. Yet BFSI workloads are rising fastest at a 24.77% CAGR, propelled by open-banking APIs, digital-ID verification, and central-bank rules that mandate in-country primary and secondary data copies. Nigerian and Kenyan fintech platforms push payment-stream micro-services into low-latency racks, while established South African banks containerise legacy cores to tap analytics and fraud-detection engines without breaching data-residency ceilings.
Government digitisation programs maintain a steady baseline as ministries migrate tax, land, and health registries from paper or dispersed servers to secure colocation hubs. E-commerce players anchor bundles of web-front and payment traffic, creating clumps of density near consumer clusters. Media and entertainment, though still nascent, shows upside given local content production and rising video streaming demands that thrive when CDN nodes sit within national borders.
Geography Analysis
South Africa remained the apex market, holding 40.76% share of the Africa data center market in 2025 and leveraging mature financial services, robust carrier ecosystems, and established subsea gateways in Cape Town and Durban. Johannesburg hosts the bulk of hyperscale builds, with Teraco’s latest JB7 expansion bringing 40 MW of additional capacity online under a ZAR 8 billion (USD 442 million) club-loan that underlines lender confidence despite grid load-shedding. Azure, AWS, and Equinix have all enlarged local zones, ensuring the Africa data center market sustains a critical mass of networks, cloud on-ramps, and payment hubs. Nonetheless, growth moderates compared with frontier markets because land and power near Gauteng technology corridors are tightening, pushing new builds toward solar-rich Northern Cape plots that require longer connectivity spurs.
Nigeria represents the most significant greenfield runway, supported by a 200 million population, booming fintech adoption, and the Data Protection Act 2023 that compels local hosting for high-volume data controllers. Lagos benefits from multiple cable landings and a dense banking cluster, but operators must budget for full-time diesel operation due to sub-5 GW grid generation for the entire country. Abuja and Port Harcourt emerge as secondary nodes, especially for government and oil-and-gas workloads. International investors typically form joint ventures with local power developers to lock long-term gas or solar PPAs, mitigating energy-price volatility and reinforcing ESG credentials within the Africa data center market
Kenya is crystallising as East Africa’s digital bridge, leveraging geothermal baseload from Olkaria and policy incentives under the Digital Economy Blueprint. Nairobi’s proximity to Mombasa’s cable-landing stations reduces backhaul cost and has attracted multi-tenant campuses that aggregate demand from regional telcos, airlines, and regional-headquarter offices. Microsoft and G42’s USD 1 billion geothermal-backed project elevates Kenya’s profile as a renewable-rich alternative to South African coal-heavy grids. The Rest of Africa block-encompassing Ghana, Rwanda, Morocco, Egypt, and Senegal-expands at a 26.04% CAGR, spurred by sovereign cloud mandates and donor-supported fibre arteries that reduce latency to European exchange points. Geographic dispersion of capacity is therefore set to intensify, shrinking the historical dominance of a few coastal metros and broadening the footprint of the Africa data center market.
Competitive Landscape
The Africa data center market displays moderate concentration, with regional champions such as Teraco, Africa Data Centres, and Raxio holding first-mover site permits, while global incumbents pursue acquisitions and joint ventures to sidestep protracted licensing. Digital Realty’s USD 3.5 billion agreement for a 55% Teraco stake underscores the premium placed on established land-bank portfolios and interconnection fabrics. Equinix’s Johannesburg debut signals arrival of carrier-neutral exchange specialists, intensifying competition for subsea-adjacent parcels. Meanwhile, cloud titans such as Microsoft deepen regional presence with renewable-tied power purchase agreements, offering tenants carbon-offset benefits unavailable in diesel-reliant setups.
Differentiation has shifted from megawatt bragging rights to sustainability and compliance depth. Teraco’s 120 MW solar farm and Microsoft’s geothermal arrays illustrate how renewable integration now commands board-room attention, especially as multinational tenants seek to align African workloads with global net-zero pledges. Operators also invest in in-house compliance teams versed in ISO 27001, PCI-DSS, and national data-protection assessments, providing bundled audit support that accelerates tenant onboarding. Workforce development partnerships—such as Standard Bank’s technician apprenticeship pipeline—help reduce outage risk from staffing deficits and reinforce ESG social pillars within investor scorecards.
Competitive white spaces remain in secondary markets where government digitisation targets outstrip the current rack supply. Players willing to pair smaller initial builds with modular expansion rights can capture first-mover advantage before large funds commit. Telecom carriers explore value-chain extension into managed hosting, leveraging tower real estate for micro-edge nodes, yet face steep learning curves in cooling, security, and multi-tenant neutrality. Overall, market positioning now hinges on an integrated package of renewable power, interconnection density, and regulatory fluency rather than on unutilised shell capacity alone, shaping the evolutionary arc of the Africa data center market.
Africa Data Center Industry Leaders
Teraco Data Environments (Digital Realty)
Africa Data Centers
Vantage Data Centers
N+ONE Data Centers
Raxio Data Centres
- *Disclaimer: Major Players sorted in no particular order

Recent Industry Developments
- January 2025: iXAfrica secured RMB financing for a 20 MW expansion in Nairobi aimed at Tier 3 workloads for East African finance and public-sector clients.
- November 2024: Teraco broke ground on a 40 MW Johannesburg addition (JB7) backed by a ZAR 8 billion loan syndicate.
- July 2025: Visa opened its first African data center in Johannesburg to localise payment processing and reduce transaction latency.
- May 2024: Microsoft and G42 unveiled a USD 1 billion geothermal-powered campus in Kenya alongside an AI research hub and workforce-training center.


Africa Data Center Market Report Scope
Large, Massive, Medium, Mega, Small are covered as segments by Data Center Size. Tier 1 and 2, Tier 3, Tier 4 are covered as segments by Tier Type. Non-Utilized, Utilized are covered as segments by Absorption. Nigeria, South Africa are covered as segments by Country.| Large |
| Hyperscale |
| Medium |
| Small |
| Tier 1 and 2 |
| Tier 3 |
| Tier 4 |
| Hyperscale/Self-built | ||
| Enterprise/Edge | ||
| Colocation | Non-Utilized | |
| Utilized | Retail Colocation | |
| Wholesale Colocation | ||
| BFSI |
| IT and ITES |
| E-Commerce |
| Government |
| Manufacturing |
| Media and Entertainment |
| Telecom |
| Other End Users |
| South Africa |
| Egypt |
| Nigeria |
| Rest of Africa |
| By Data Center Size | Large | ||
| Hyperscale | |||
| Medium | |||
| Small | |||
| By Tier Standard | Tier 1 and 2 | ||
| Tier 3 | |||
| Tier 4 | |||
| By Data Center Type | Hyperscale/Self-built | ||
| Enterprise/Edge | |||
| Colocation | Non-Utilized | ||
| Utilized | Retail Colocation | ||
| Wholesale Colocation | |||
| By End-User Industry | BFSI | ||
| IT and ITES | |||
| E-Commerce | |||
| Government | |||
| Manufacturing | |||
| Media and Entertainment | |||
| Telecom | |||
| Other End Users | |||
| By Country | South Africa | ||
| Egypt | |||
| Nigeria | |||
| Rest of Africa | |||


Market Definition
- IT LOAD CAPACITY - The IT load capacity or installed capacity, refers to the amount of energy consumed by servers and network equipments placed in a rack installed. It is measured in megawatt (MW).
- ABSORPTION RATE - It denotes the extend to which the data center capacity has been leased out. For instance, a 100 MW DC has leased out 75 MW, then absorption rate would be 75%. It is also referred as utilization rate and leased-out capacity.
- RAISED FLOOR SPACE - It is an elevated space build over the floor. This gap between the original floor and the elevated floor is used to accommodate wiring, cooling, and other data center equipment. This arrangement assist in having proper wiring and cooling infrastructure. It is measured in square feet (ft^2).
- DATA CENTER SIZE - Data Center Size is segmented based on the raised floor space allocated to the data center facilities. Mega DC - # of Racks must be more than 9000 or RFS (raised floor space) must be more than 225001 Sq. ft; Massive DC - # of Racks must be in between 9000 and 3001 or RFS must be in between 225000 Sq. ft and 75001 Sq. ft; Large DC - # of Racks must be in between 3000 and 801 or RFS must be in between 75000 Sq. ft and 20001 Sq. ft; Medium DC # of Racks must be in between 800 and 201 or RFS must be in between 20000 Sq. ft and 5001 Sq. ft; Small DC - # of Racks must be less than 200 or RFS must be less than 5000 Sq. ft.
- TIER TYPE - According to Uptime Institute the data centers are classified into four tiers based on the proficiencies of redundant equipment of the data center infrastructure. In this segment the data center are segmented as Tier 1,Tier 2, Tier 3 and Tier 4.
- COLOCATION TYPE - The segment is segregated into 3 categories namely Retail, Wholesale and Hyperscale Colocation service. The categorization is done based on the amount of IT load leased out to potential customers. Retail colocation service has leased capacity less than 250 kW; Wholesale colocation services has leased capacity between 251 kW and 4 MW and Hyperscale colocation services has leased capacity more than 4 MW.
- END CONSUMERS - The Data Center Market operates on a B2B basis. BFSI, Government, Cloud Operators, Media and Entertainment, E-Commerce, Telecom and Manufacturing are the major end-consumers in the market studied. The scope only includes colocation service operators catering to the increasing digitalization of the end-user industries.
| Keyword | Definition |
|---|---|
| Rack Unit | Generally referred as U or RU, it is the unit of measurement for the server unit housed in the racks in the data center. 1U is equal to 1.75 inches. |
| Rack Density | It defines the amount of power consumed by the equipment and server housed in a rack. It is measured in kilowatt (kW). This factor plays a critical role in data center design and, cooling and power planning. |
| IT Load Capacity | The IT load capacity or installed capacity, refers to the amount of energy consumed by servers and network equipment placed in a rack installed. It is measured in megawatt (MW). |
| Absorption Rate | It denotes how much of the data center capacity has been leased out. For instance, if a 100 MW DC has leased out 75 MW, then the absorption rate would be 75%. It is also referred to as utilization rate and leased-out capacity. |
| Raised Floor Space | It is an elevated space built over the floor. This gap between the original floor and the elevated floor is used to accommodate wiring, cooling, and other data center equipment. This arrangement assists in having proper wiring and cooling infrastructure. It is measured in square feet/meter. |
| Computer Room Air Conditioner (CRAC) | It is a device used to monitor and maintain the temperature, air circulation, and humidity inside the server room in the data center. |
| Aisle | It is the open space between the rows of racks. This open space is critical for maintaining the optimal temperature (20-25 °C) in the server room. There are primarily two aisles inside the server room, a hot aisle and a cold aisle. |
| Cold Aisle | It is the aisle wherein the front of the rack faces the aisle. Here, chilled air is directed into the aisle so that it can enter the front of the racks and maintain the temperature. |
| Hot Aisle | It is the aisle where the back of the racks faces the aisle. Here, the heat dissipated from the equipment’s in the rack is directed to the outlet vent of the CRAC. |
| Critical Load | It includes the servers and other computer equipment whose uptime is critical for data center operation. |
| Power Usage Effectiveness (PUE) | It is a metric which defines the efficiency of a data center. It is calculated by: (𝑇𝑜𝑡𝑎𝑙 𝐷𝑎𝑡𝑎 𝐶𝑒𝑛𝑡𝑒𝑟 𝐸𝑛𝑒𝑟𝑔𝑦 𝐶𝑜𝑛𝑠𝑢𝑚𝑝𝑡𝑖𝑜𝑛)/(𝑇𝑜𝑡𝑎𝑙 𝐼𝑇 𝐸𝑞𝑢𝑖𝑝𝑚𝑒𝑛𝑡 𝐸𝑛𝑒𝑟𝑔𝑦 𝐶𝑜𝑛𝑠𝑢𝑚𝑝𝑡𝑖𝑜𝑛). Further, a data center with a PUE of 1.2-1.5 is considered highly efficient, whereas, a data center with a PUE >2 is considered highly inefficient. |
| Redundancy | It is defined as a system design wherein additional component (UPS, generators, CRAC) is added so that in case of power outage, equipment failure, the IT equipment should not be affected. |
| Uninterruptible Power Supply (UPS) | It is a device that is connected in series with the utility power supply, storing energy in batteries such that the supply from UPS is continuous to IT equipment even during utility power is snapped. The UPS primarily supports the IT equipment only. |
| Generators | Just like UPS, generators are placed in the data center to ensure an uninterrupted power supply, avoiding downtime. Data center facilities have diesel generators and commonly, 48-hour diesel is stored in the facility to prevent disruption. |
| N | It denotes the tools and equipment required for a data center to function at full load. Only "N" indicates that there is no backup to the equipment in the event of any failure. |
| N+1 | Referred to as 'Need plus one', it denotes the additional equipment setup available to avoid downtime in case of failure. A data center is considered N+1 when there is one additional unit for every 4 components. For instance, if a data center has 4 UPS systems, then for to achieve N+1, an additional UPS system would be required. |
| 2N | It refers to fully redundant design wherein two independent power distribution system is deployed. Therefore, in the event of a complete failure of one distribution system, the other system will still supply power to the data center. |
| In-Row Cooling | It is the cooling design system installed between racks in a row where it draws warm air from the hot aisle and supplies cool air to the cold aisle, thereby maintaining the temperature. |
| Tier 1 | Tier classification determines the preparedness of a data center facility to sustain data center operation. A data center is classified as Tier 1 data center when it has a non-redundant (N) power component (UPS, generators), cooling components, and power distribution system (from utility power grids). The Tier 1 data center has an uptime of 99.67% and an annual downtime of <28.8 hours. |
| Tier 2 | A data center is classified as Tier 2 data center when it has a redundant power and cooling components (N+1) and a single non-redundant distribution system. Redundant components include extra generators, UPS, chillers, heat rejection equipment, and fuel tanks. The Tier 2 data center has an uptime of 99.74% and an annual downtime of <22 hours. |
| Tier 3 | A data center having redundant power and cooling components and multiple power distribution systems is referred to as a Tier 3 data center. The facility is resistant to planned (facility maintenance) and unplanned (power outage, cooling failure) disruption. The Tier 3 data center has an uptime of 99.98% and an annual downtime of <1.6 hours. |
| Tier 4 | It is the most tolerant type of data center. A Tier 4 data center has multiple, independent redundant power and cooling components and multiple power distribution paths. All IT equipment are dual powered, making them fault tolerant in case of any disruption, thereby ensuring interrupted operation. The Tier 4 data center has an uptime of 99.74% and an annual downtime of <26.3 minutes. |
| Small Data Center | Data center that has floor space area of ≤ 5,000 Sq. ft or the number of racks that can be installed is ≤ 200 is classified as a small data center. |
| Medium Data Center | Data center which has floor space area between 5,001-20,000 Sq. ft, or the number of racks that can be installed is between 201-800, is classified as a medium data center. |
| Large Data Center | Data center which has floor space area between 20,001-75,000 Sq. ft, or the number of racks that can be installed is between 801-3,000, is classified as a large data center. |
| Massive Data Center | Data center which has floor space area between 75,001-225,000 Sq. ft, or the number of racks that can be installed is between 3001-9,000, is classified as a massive data center. |
| Mega Data Center | Data center that has a floor space area of ≥ 225,001 Sq. ft or the number of racks that can be installed is ≥ 9001 is classified as a mega data center. |
| Retail Colocation | It refers to those customers who have a capacity requirement of 250 kW or less. These services are majorly opted by small and medium enterprises (SMEs). |
| Wholesale Colocation | It refers to those customers who have a capacity requirement between 250 kW to 4 MW. These services are majorly opted by medium to large enterprises. |
| Hyperscale Colocation | It refers to those customers who have a capacity requirement greater than 4 MW. The hyperscale demand primarily originates from large-scale cloud players, IT companies, BFSI, and OTT players (like Netflix, Hulu, and HBO+). |
| Mobile Data Speed | It is the mobile internet speed a user experiences via their smartphones. This speed is primarily dependent on the carrier technology being used in the smartphone. The carrier technologies available in the market are 2G, 3G, 4G, and 5G, where 2G provides the slowest speed while 5G is the fastest. |
| Fiber Connectivity Network | It is a network of optical fiber cables deployed across the country, connecting rural and urban regions with high-speed internet connection. It is measured in kilometer (km). |
| Data Traffic per Smartphone | It is a measure of average data consumption by a smartphone user in a month. It is measured in gigabyte (GB). |
| Broadband Data Speed | It is the internet speed that is supplied over the fixed cable connection. Commonly, copper cable and optic fiber cable are used in both residential and commercial use. Here, optic cable fiber provides faster internet speed than copper cable. |
| Submarine Cable | A submarine cable is a fiber optic cable laid down at two or more landing points. Through this cable, communication and internet connectivity between countries across the globe is established. These cables can transmit 100-200 terabits per second (Tbps) from one point to another. |
| Carbon Footprint | It is the measure of carbon dioxide generated during the regular operation of a data center. Since, coal, and oil & gas are the primary source of power generation, consumption of this power contributes to carbon emissions. Data center operators are incorporating renewable energy sources to curb the carbon footprint emerging in their facilities. |


Research Methodology
Mordor Intelligence follows a four-step methodology in all our reports.
- Step-1: Identify Key Variables: In order to build a robust forecasting methodology, the variables and factors identified in Step-1 are tested against available historical market numbers. Through an iterative process, the variables required for market forecast are set and the model is built on the basis of these variables.
- Step-2: Build a Market Model: Market-size estimations for the forecast years are in nominal terms. Inflation is not a part of the pricing, and the average selling price (ASP) is kept constant throughout the forecast period for each country.
- Step-3: Validate and Finalize: In this important step, all market numbers, variables and analyst calls are validated through an extensive network of primary research experts from the market studied. The respondents are selected across levels and functions to generate a holistic picture of the market studied.
- Step-4: Research Outputs: Syndicated Reports, Custom Consulting Assignments, Databases & Subscription Platforms


